Munich Personal RePEc Archive
Effectiveness of foreign aid in Small
Island Developing States
Bah, El-hadj M. and Ward, Jeremy
The University of Auckland
May 2011
Effectiveness of Foreign Aid in Small
Island Developing States
El-hadj M. Bah
*Jeremy Ward
The University of Auckland
May, 2011
Abstract
Small Island Developing States (SIDS) are usually left out in the aid effectiveness literature, despite being among the poorest and top receivers of foreign aid. This paper tests the main conditionality models of the literature and specifies a new model that best fit the data for 37 SIDS. The general finding is that aid has a positive and significant effect on growth. However, we do not find supporting evidence for the good policies conditionality or the existence of diminishing returns. Instead, we find that aid works best in the presence of sufficiently good governmental and social institutions.
Keywords: Foreign aid, Small Island Developing States, Aid effectiveness. JEL classification: O11, O19
*Lecturer, department of Economics, The University of Auckland, Auckland, New Zealand, Email:
1.
Introduction
Over the last several decades, Small Island Developing States (SIDS) have tended to receive
much more development aid, relative to size, than other developing countries. Whether this is
due to their small size, increased need due to vulnerability, or strong geographical ties to
various donor countries, these countries regularly rank among the world’s largest relative aid
recipients. In 2008, they made up almost half of the world’s top 20 recipients of Official
Development Assistance (ODA) as a percentage of GNI, with several well in excess of 30 per
cent.1 Despite this, growth remains low in many of these countries, and development is poor.
Although the aid effectiveness literature is increasingly comprehensive, SIDS are largely
absent from most studies, due largely to a simple lack of comprehensive and reliable data.
These omissions lead one to question whether the relationships found in the literature hold
true in these countries. This is further brought into question by these countries’ defining
characteristics, which make them a distinct and substantively different subset of the world’s
developing countries, allowing for the possibility that they may also differ in terms of drivers
of growth and aid effectiveness. The aim of this paper is to analyse the effectiveness of
development aid in Small Island Developing States by building upon the empirical
techniques used in the existing literature and applying them to a SIDS dataset.2
The importance of understanding aid effectiveness is clear. Strong results indicating success
or failure of development aid, or the conditions under which it can be successful or wasteful,
will help in optimizing both the quantity and quality of aid spending. Global ODA spending,
the measure of aid generally used by the literature, exceeded 128 billion US dollars in 2008,
increasing, with many countries, and the developed world as a whole, falling well short of the
0.7 per cent of GDP commitment made by developed nations at various times in recent
decades. Both the large absolute sums, and the small relative amounts, are politically
contentious, and a lack of clear results regarding aid effectiveness is surely one of the major
obstacles to rectifying this.
In keeping with the traditions of the existing literature, we focus on the effects of Official
Development Assistance (ODA) on growth rates of real per capita GDP. ODA is defined
broadly by the OECD Development Assistance Committee as aid meeting certain conditions
and with the goal of ‘the promotion of the economic development and welfare of developing
countries’.3 While clearly such a narrow dependent variable is an imperfect measure of the
success of ODA, we are unfortunately restricted to its use as long as there does not exist a
measure, or set of measures, that fully encompass and accurately gauge the outcomes of
development aid, and for which data are available.4 As such, we must be careful in framing
the results accordingly, rather than attempting to draw the grand conclusions that some
previous papers have suggested.
Our empirical analysis yields interesting findings. Most importantly, we find that ODA
appears to have a significant and positive effect on growth, although this is not robust to all
specifications and tests. We also find that ODA appears to be more effective in the presence
of high quality public institutions and political structures. This result differs from much of the
literature, but is generally found to be quite robust within our dataset. We also note that we
find little, if any, evidence for other prominent results, including diminishing returns to aid,
and increased effectiveness when combined with economic indicators indicative of ‘good’
The remainder of this paper is as follows. Section 2 will give a brief survey of the existing aid
effectiveness literature, and Section 3 will outline our data selection and empirical methods.
The heart of the paper is the application of prominent aid-growth models to the SIDS dataset,
results of which are found in Section 4, along with the development of a preferred
specification and general results. Finally, we discuss several brief conclusions drawn from
the results of these models.
2.
Existing
Literature
The Aid-Growth Literature
The body of literature dealing with aid effectiveness is large and growing, particularly over
the last decade. Several studies provide comprehensive reviews of the literature, including
Doucouliagos and Paldam (2006, 2009, 2010) and Hansen and Tarp (2000). Here, we focus
only on the literature most relevant to this study, namely the so called (and closely related)
‘Direct Growth’ and ‘Conditional Growth’ families (Doucouliagos and Paldam; 2006, 2009,
2010).
As these names suggest, the former focuses on testing the effect of aid on growth directly,
rather than by testing its effect on savings and investment as in earlier works, while the latter
tests for particular circumstances or recipient country characteristics that determine the
effectiveness of aid. The basis of direct growth models is generally estimation of a growth
equation of the form
where git is the dependent variable, generally per capita GDP growth in country i and time t,
α is a constant or fixed effect, hit is aid as a percentage of GNI, and xj represents any number
of other variables thought to drive growth, indexed by j. The coefficients to be estimated are
given by α, μ and γ. Closely related are the conditional growth models, which add a condition
variable, given by zit with coefficient δ, and an interaction term, simply aid multiplied by the
condition variable giving hitzit with coefficient ω, as follows:
While direct growth models determine aid effectiveness with significant results of the μ
coefficient, conditionality models additionally look for significance in the ω coefficient,
which suggests aid is more or less effective when the condition variable zit is large. It is these
two model types that we focus on in this review and adapt in the following sections for our
own analysis of aid effectiveness.
Rajan and Subramanian (2008) identify variables common to a number of more prominent
papers: initial level of per capita income, measures of institutional and policy quality,
financial depth or development (generally measured by ratio of money supply M2 to GDP),
inflation, a measure of ethnolinguistic fractionalization, assassinations (as a proxy for
political and social stability), and ratio of government budget balance to GDP. If not already
included as part of a combined policy variable, openness to trade is also generally used, often
along with regional dummies, population and population growth rates, and human capital
The first major addition to this basic model is the so called ‘medicine model’ approach,
which includes an aid squared variable, to determine whether there are increasing or
decreasing returns to aid.5 The general finding is that while aid has a positive effect, it has
decreasing returns, and an upper threshold above which additional aid is not beneficial.
Wagner (2008) extends this model, using nonlinear estimation to find both lower and upper
thresholds, between which aid is most effective. Despite such prominence in the literature,
however, Doucouliagos and Paldam’s (2009) meta-analysis finds that there is no real
evidence for the significance of the aid-squared term, be it positive or negative, particularly
when taking into account a prevalent publication bias, which they find significantly biases
results towards negative aid-squaredcoefficients.
Two more variables that have been used extensively as conditions for the effectiveness of aid,
sometimes together, are those measuring governmental policy and those measuring
institutional quality. For use in this manner, Burnside and Dollar (2000) derives a variable
representing ‘good’ economic policy (a weighted mean of inflation, budget balance, and
openness to trade), finding that the aid coefficient is insignificant, while the aid * policy
interaction coefficient is positive and significant, leading to the conclusion that aid is
generally ineffective in bad policy environments, but effective in good policy environments.
Elegant and intuitively appealing, with strong policy implications, these results have been the
focus of much policy debate, political rhetoric, and repeated development and retesting.
A decade after its initial publication, the policy conditionality model is still being tested with
varying results, most notably by Easterly, Levine, and Roodman (2004), as well as Hansen,
Tarp, and Dalgaard (2000; 2001; 2004), Dayton-Johnson and Hoddinott (2003), and others.6
Paldam (2010) find in meta-analysis that while there is a clear negative relationship between
coefficients of aid and aid * policy, but overall evidence for the good policy model is weak,
with only a quarter of papers finding a positive and significant aid * policy coefficient.
Further, the papers that do support the hypothesis in this way are seen to tend towards smaller
sample sizes and thus higher variance and less trustworthy results (Doucouliagos and Paldam,
2010).
Other variables which have been used as conditions include exogenous vulnerability to
climactic, economic, and demographic shocks (Guillaumont and Chauvet, 2001), political
instability (Chauvet and Guillaumont, 2004), democratization (Kosack, 2003), and savings
(Teboul and Moustier, 2001), although none are used in this study, generally due to lack of
suitable data.
A number of papers have included a measure of favourable geography, including Chervin
and van Wijnbergen (2010), Bosworth and Collins (2003), Clemens, Radelet and Bhavnani
(2004), Sachs (2001; 2003), and Dalgaard, Hansen and Tarp (2004), each finding geography
to be significant either on its own or as a condition for aid effectiveness. However, while the
preferred geographical measures - percentage of land in the tropics, and number of frost days
per year - may have significant implications for growth in SIDS, they are unusable here, with
the former effectively being a dummy variable taking the value of one for Bahrain and the
Bahamas, and the latter unavailable for our dataset.
Other notable areas of testing, beyond the scope of this paper, include comparing
nongovernmental and bilateral aid (Masud and Yontcheva; 2005) and comparing tied and
Miquel-Florensa, 2007). Burnside and Dollar (2000), Collier and Dollar (2001), and Kenny
(2006), amongst others, go beyond testing aid effectiveness to determine guidelines for
optimal aid allocation. Moe (2008), McGillivray and Noorbakhsh (2004), Williamson (2007),
Kosack (2003) and Gomanee, Girma, and Morrissey (2003) provide examples of the growing
use of HDI and other non-GDP welfare indicators as the dependent variable. Finally, and
perhaps most interestingly with regards to future study, is Wagner’s (2008) use of partially
nonlinear estimation techniques which give detailed insights into the changing effects of aid
at differing levels.
Small Island Developing States in the Literature
The literature surrounding aid effectiveness in Small Island Developing States has, until
recently, been near non-existent.7 Most closely related to this paper is a recent study by Feeny
and McGillivray (2010), which also extends some of the general methods of the aid
effectiveness literature to Small Island Developing States, and finds that aid is somewhat
effective but with diminishing returns. We test their result with a larger data set and alternate
methods bridging gaps to the existing literature in areas where they have diverged. Our
significantly different results outline some of the weaknesses in the methods of the
aid-growth literature, such as apparent sensitivity to choices of data and econometric techniques.
Such comparisons have formed the basis and driven the development of the aid-growth
literature, and allow for richer and more instructive results.
3.
Data
and
Econometric
Techniques
3.1 Data
Many of the major decisions regarding data, including the dimensions of the panel, are made
both received ODA over this period and for which enough reliable data is available for their
inclusion. We use annual series and 4-year aggregates where appropriate.8 One criticism we
wish to make of the existing literature is the method with which countries are selected. While
it is clearly an admirable goal to include only countries below some wealth or development
threshold, for those are the countries in whose development we are most interested, it appears
that much of the literature makes this selection based only on current wealth. This generally
excludes countries that were at one time as poor as some included countries, but whose
growth moved them above the current threshold. Removing the ‘success stories’ in such a
way can significantly alter our results. To combat this, we include in the full set all
country-years in which ODA was received, and test using both the full set and sets including only
country-years for which per capita GDP is below some threshold.9
We include countries for which data is available (and appropriate) for all or part of the time
period, and as such our panel is somewhat unbalanced.10 The full list of included SIDS is
available in Table A1 in the appendix. Further data and variable choices are generally made
by availability and an interest in comparability with existing literature. Many of our data are
sourced from the World Bank’s World Development Indicators, with a full list of sources
given in Table A2 in the appendix.
In some cases, for both testing purposes and necessity, we diverge from the literature, such as
the availability-forced exclusion of budget surplus from the Burnside and Dollar (2000) style
policy variable. Similarly, we use total trade as a percentage of GDP in place of the
Sachs-Warner coefficient, which appears to have fallen out of use. While these changes are not ideal
In keeping with much of the later literature, we have shied away from many self-constructed
policy and institution variables which have been discarded in favour of increasingly available
catch-all variables, such as those created for the World Bank by Kaufmann, Kraay, and Zoido
(referred to here as KKZ, 1999). The arithmetic mean of the six KKZ variables has become
of increasing use in the literature, as a broad measure of the quality of public institutions. We
also use the constituent parts individually where appropriate, often as replacements for
similar but unavailable variables. In particular, the KKZ Political Stability and Absence of
Violence measure makes an acceptable replacement for a measure of assassinations that is
widely used but unavailable for many of our countries.11 Similarly, KKZ Voice and
Accountability provides a suitably similar replacement for measures of democracy used in
some studies. The World Bank’s Country Policy and Institutional Assessment (CPIA)
variables, while attractive, are unavailable for too many of our countries and periods to be of
use.
One important note is the manner in which we treat variables such as KKZ and linguistic
fractionalization, which have short histories and are not available annually. Here we keep
with standard practice, which has been to use the earliest available value as a proxy for earlier
missing values, justified on the basis that the real values of these variables do not change
much over time. For linguistic fractionalization, which is only available as time-invariant
cross-sectional data, this means treating it as a constant. While we continue these practices
out of necessity, it is worth nothing that it is not ideal, particularly given the collinearity
effects it causes. This is particularly noticeable in fixed effects and GMM estimations, from
which these variables often need to be excluded. Table A2 provides a full list of variables
3.2 Econometric Techniques
We follow the literature to estimate the linear model of the general form outlined in the
previous section, with real per capita GDP growth as the dependant variable. In keeping with
early aid effectiveness studies, the first method used is Ordinary Least Squares. Due to the
potential for endogeneity amongst important variables, we also use 2-Stage Least Squares at
times, although it has generally proven difficult to find suitable instruments with countries for
which data is so porous. As in much of the literature, our results do not differ in any
meaningful way between these two methods, and as such we often do not report the latter.
We have also used panel regressions using country and period dummies, as much of the
recent literature has found this preferable to the previous two methods. The drawback of this
method is the necessary exclusion of variables for which our data do not vary over time, such
as linguistic fractionalization.
Finally, GMM estimation is used as an increasingly preferred regression technique, as
discussed in multiple works by David Roodman (2004; 2006; 2007; 2008). Within
Roodman’s xtabond2 framework for Stata, we use the two-step efficient, dynamic system
GMM estimator, with small sample size and Windmeijer correction options to reduce
downward bias in coefficient estimates that can otherwise occur.12
Our approach is to test the specifications of a number of prominent papers using the new,
Small Island Developing State dataset, and the closest available variables and econometric
methods. We then find a preferred specification that best explains the variations in the data
and draw appropriate conclusions.
4.
Results
Policy Conditionality
The first model we test is that of Burnside and Dollar (2000), using 4-year periods and OLS,
to investigate the hypothesis that aid is only significant in good policy environments.13 The
specification of the model can be seen in the results in Table 1. We use as close an
approximation as possible to the Burnside and Dollar specification as the data allows. We use
the KKZ Stability variable in place of the unavailable assassinations variable, exclude the
assassinations * ethnic fractionalization interaction, use the full KKZ mean as an institutional
quality measure, and of course replace the Sub-Saharan Africa and East Asia dummies with
our own – in this case Pacific and Caribbean dummies.
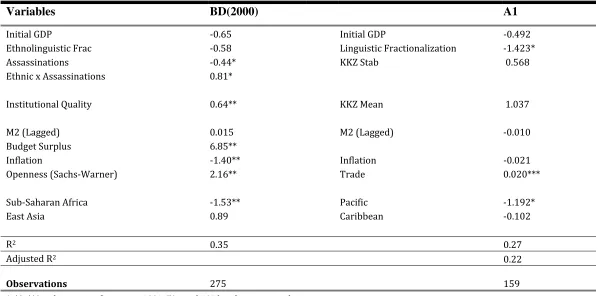
The first step is an OLS regression on all non-aid variables, the coefficients of which are used
to determine the weightings of the constituent parts in creating a policy variable.14 Due to
data unavailability, the budget surplus variable is omitted, and we create the policy index
using just inflation, trade, and a constant. The policy index is thus given by
4.96 0.021 0.020
The first term is the estimated constant (significant at ten per cent), allowing us to interpret
this Burnside and Dollar policy index as the expected growth given inflation and openness.
We then reintroduce aid and its interactions, including with the newly created policy variable.
The results of these regressions are shown in Table 1, along with those of Burnside and
Dollar (2000) and Easterly, Levine and Roodman (2004), who re-test the exact specification
using a larger dataset. In general, the results do not support the hypothesis that aid is only
effective in good policy environments. In regression (1) our results are broadly similar to
positive and significant effect on growth. The other variables found significant by Burnside
and Dollar were not found to be robust to the larger Easterly, Levine and Roodman dataset,
and these results continue here as we repeat their finding of a general lack of support for the
policy conditionality of aid effectiveness. We also repeat these regressions with a dataset
including only low-income countries,15 but these results yield no new findings and are not
reported.
The Medicine Model
Here we use the Hansen and Tarp (2000) model, which builds on Burnside and Dollar’s
framework to include squared aid variables and interactions. The model is otherwise similar,
although each of the constituent parts of the BD Policy variable are now included separately
in the final regression. While the budget surplus variable is unavailable for the SIDS dataset,
a measure of government consumption is added which is available. The results are presented
as regression (2).
The main difference between our results and Hansen and Tarp is that again we do not find aid
to be significant, either by itself or in squared or interactive terms. As before, institutional
quality (KKZ Mean) appears to be the greatest and most significant driver of growth. Perhaps
due to their inclusion as individual variables rather than part of an index, the policy variables
are now also insignificant, although with the exception of financial depth (M2) they enter
with the same sign as in Hansen and Tarp’s estimates.
Conditioning on Institutions
Collier and Dollar (2001) uses quality of institutions as a condition. While they use the
are prohibitively expensive, and as such we continue with the KKZ institutional measure.
Further, they use the CPIA mean as a measure of policy quality but due to lack of data, we
use the Burnside and Dollar policy variable.
The main result of this model, shown in Regression 3, is weak significance of aid both by
itself and in its interaction with the KKZ variable. This is our first indication that aid may be
having positive benefits, with the latter implying aid is more effective when combined with
good institutions. With these results seemingly sensitive to the specification of the model, it
is unclear at this stage what is driving them, providing additional impetus for further
investigation. Interestingly, the KKZ variable itself is now insignificant, an effect which is
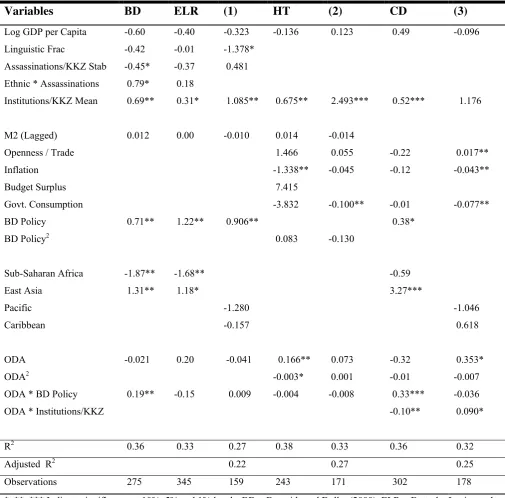
Table 1: Literature Specifications
Variables BD ELR (1) HT (2) CD (3)
Log GDP per Capita -0.60 -0.40 -0.323 -0.136 0.123 0.49 -0.096 Linguistic Frac -0.42 -0.01 -1.378*
Assassinations/KKZ Stab -0.45* -0.37 0.481 Ethnic * Assassinations 0.79* 0.18
Institutions/KKZ Mean 0.69** 0.31* 1.085** 0.675** 2.493*** 0.52*** 1.176
M2 (Lagged) 0.012 0.00 -0.010 0.014 -0.014
Openness / Trade 1.466 0.055 -0.22 0.017**
Inflation -1.338** -0.045 -0.12 -0.043**
Budget Surplus 7.415
Govt. Consumption -3.832 -0.100** -0.01 -0.077** BD Policy 0.71** 1.22** 0.906** 0.38*
BD Policy2 0.083 -0.130
Sub-Saharan Africa -1.87** -1.68** -0.59
East Asia 1.31** 1.18* 3.27***
Pacific -1.280 -1.046
Caribbean -0.157 0.618
ODA -0.021 0.20 -0.041 0.166** 0.073 -0.32 0.353*
ODA2 -0.003* 0.001 -0.01 -0.007
ODA * BD Policy 0.19** -0.15 0.009 -0.004 -0.008 0.33*** -0.036
ODA * Institutions/KKZ -0.10** 0.090*
R2 0.36 0.33 0.27 0.38 0.33 0.36 0.32
Adjusted R2 0.22 0.27 0.25
Observations 275 345 159 243 171 302 178 *, **, *** Indicate significance at 10%, 5% and 1% levels. BD = Burnside and Dollar (2000). ELR = Easterly, Levine and Roodman (2004). HT = Hansen and Tarp (2000). CD = Collier and Dollar (2001).
Budget surplus in HT is actually budget deficit, meaning signs are reversed.
In CD, Institutions/KKZ Mean is replaced by the ICRGE measure of institutions, and BD Policy is replaced by the CPIA Mean. CD also includes regional dummies for South Asia (2.44***), Middle East/North Africa 1.78***) and
Feeny and McGillivray specification
We next test the specifications used by Feeny and McGillivray (2010), which uses a SIDS
dataset covering the years 1980 to 2004. Notable additions to the previous specifications are
the introduction of a measure of the effect of natural disasters, which takes the value of one in
periods in which more than ten percent of the population are affected by disasters such as
floods and earthquakes, and zero otherwise; and two fragility variables, which take the value
of 1 if the country is in the bottom two CPIA quintiles for the first, and the bottom CPIA
quintile for the second, and zero otherwise. The disaster variable is easily constructed, but the
fragility variables were made available to the authors on a confidential basis by the World
Bank, and cannot be constructed for enough of our countries using publicly available data. As
the fragility variables are not central to the model, we proceed without them.
The authors first use a fixed effects model with an annual dataset, experimenting with
contemporaneous and lagged variables. This is different from the 4-year and 5-year period
norms of the literature, and our results show that it may significantly affect their results. Their
second set of regressions use 4-year aggregated periods in a two-step GMM estimation,
which we also use.
In keeping with the traditions set out by Easterly, Levine and Roodman (2004), we also test
using both our full dataset and again using a dataset restricted only to Feeny and
McGillivray’s listed countries and periods.16 We note that the major difference between our
full dataset and the dataset restricted to Feeny and McGillivray’s countries appears to be that
the former includes all country-year observations in which the country received ODA, rather
below the threshold but still excluded from their dataset. Table 2 shows results for the fixed
effects (4 - 6) and GMM (7, 8) regressions.
Regressions 4 and 5 test two annual data specifications differing only in their lag structures,
with regressions marked ‘a’ and ‘b’ utilizing the full dataset and restricted dataset
respectively. Regression 6 seeks to bridge the gap to the literature by using the norm of
4-year periods, removing the need for lagged variables, and focusing the analysis on long run
rather than short run (and potentially cyclical) relationships.
We first note that the signs and magnitudes of the variables are broadly similar across each of
these regressions and the Feeny and McGillivray counterparts, suggesting genuine
relationships, but that they differ in their significance. Differences between regressions using
the unrestricted and restricted datasets show the sensitivity to country and period choices.
Given this, and our inability to accurately recreate the Feeny and McGillivray dataset, it is no
surprise that we have been unable to recreate their results as hoped.
The results are instructive, however. In particular, we note that the lag structure appears to
greatly affect the significance of all lagged variables. Each policy variable becomes less
significant when lagged in our annual data regressions, whereas Feeny and McGillivray see
the same effect on trade, while inflation gains in significance. The aid variables also have
differing results – significant when contemporaneous but much less so when lagged in our
regressions, but insignificant when contemporaneous and significant when twice lagged for
Feeny and McGillivray. In each case the results do not support Feeny and McGillivray’s
It is partly for this reason, and the desire to focus more on long run growth effects, that much
of the literature uses 4-year periods. We note that doing so in Regression 6 yields results with
a much higher explanatory power, and results that much better echo those of the previous
models: institutional quality and policy appear to be significant drivers of growth, while aid
and aid2 are more sensitive to the specification.
Regression 7 uses the two-step GMM estimator discussed previously, also used in FM3.
Again these results are unable to support those of Feeny and McGillivray, with aid and aid2
found to be insignificant, and the sign and magnitude of the former also sensitive to the
dataset.
Overall, we cannot confirm the results of the Feeny and McGillivray estimations, even when
restricting the dataset to those countries and periods included in their dataset.17 Using the
fixed effect regressions, we do find the expected support for policy and institutional variables
as significant drivers of growth, but aid appears to be dependent on the specification. As the
results of the annual data models appear so sensitive to changes in the data set, and the
explanatory power of these models are so low, it is unclear what exactly is driving the results,
and we cannot claim a high level of confidence in them. As such, we proceed in favour of
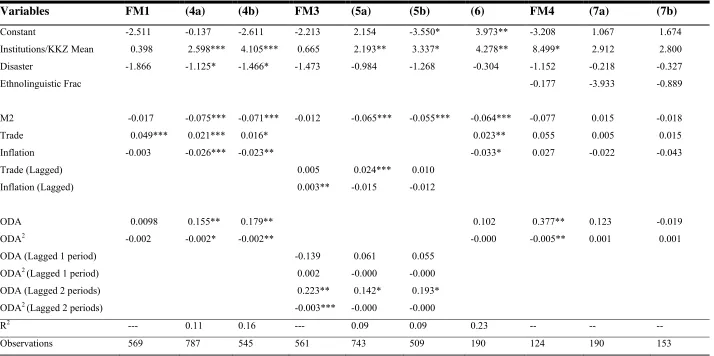
Table 2: Feeny and McGillivray Specifications
Variables FM1 (4a) (4b) FM3 (5a) (5b) (6) FM4 (7a) (7b)
Constant -2.511 -0.137 -2.611 -2.213 2.154 -3.550* 3.973** -3.208 1.067 1.674 Institutions/KKZ Mean 0.398 2.598*** 4.105*** 0.665 2.193** 3.337* 4.278** 8.499* 2.912 2.800 Disaster -1.866 -1.125* -1.466* -1.473 -0.984 -1.268 -0.304 -1.152 -0.218 -0.327
Ethnolinguistic Frac -0.177 -3.933 -0.889
M2 -0.017 -0.075*** -0.071*** -0.012 -0.065*** -0.055*** -0.064*** -0.077 0.015 -0.018 Trade 0.049*** 0.021*** 0.016* 0.023** 0.055 0.005 0.015
Inflation -0.003 -0.026*** -0.023** -0.033* 0.027 -0.022 -0.043 Trade (Lagged) 0.005 0.024*** 0.010
Inflation (Lagged) 0.003** -0.015 -0.012
ODA 0.0098 0.155** 0.179** 0.102 0.377** 0.123 -0.019
ODA2 -0.002 -0.002* -0.002** -0.000 -0.005** 0.001 0.001
ODA (Lagged 1 period) -0.139 0.061 0.055 ODA2 (Lagged 1 period) 0.002 -0.000 -0.000 ODA (Lagged 2 periods) 0.223** 0.142* 0.193* ODA2 (Lagged 2 periods) -0.003*** -0.000 -0.000
R2 --- 0.11 0.16 --- 0.09 0.09 0.23 -- -- --
Observations 569 787 545 561 743 509 190 124 190 153
Towards a preferred specification: The Basic Model
Having tested the results of several prominent models, here we seek to combine their
contributions to create a model that best explains the relationship between growth and foreign
aid in SIDS. To do so, we first test numerous specifications, both new and taken from the
literature, to determine which non-aid variables best explain growth in the dataset, and
combine them to create a basic model.18 We then test the effectiveness of aid and its
conditions by adding them to the basic model and observing the results. For comparability
with past papers, we predominantly rely on OLS estimation, although fixed effects and GMM
results are also reported for the final results.
The major variables, common to almost all other papers, are generally well behaved in these
regressions, and the results shown in regression (8a – 8g) of Table 3 are representative of
these behaviours. The coefficient on log of GDP is generally negative, suggesting a
convergence effect, while the coefficients on the policy variables are also as expected, with
trade positive, while inflation, government consumption, and M2 all negative. Trade is
generally significant, with inflation also significant but less so. A new policy index, created
using the same method as Burnside and Dollar (2000) but combining all four of these
variables, adds a small amount to the predictive power of the model, and is generally more
significant (and enters with a greater coefficient) than the Burnside and Dollar variable,
suggesting it is a better measure of ‘good’ policy for this dataset.
It is the institutional quality variables, in particular KKZ Mean and its constituent parts that
appear to have the most consistently significant effect on growth. This effect is always
positive and generally quite large. Using the constituent measures of KKZ, rather than the
Attempts to incorporate a measure of volatility of aid, inspired by Guillaumont (2009), and
Bulir and Hamann (2003; 2007), did not add significantly to the model. In general the
coefficient was negative, as expected, but never significant. Incorporating life expectancy,
population, domestic credit as a percentage of GDP, and migrant stock as a percentage of
population (as a proxy for openness and knowledge transfer) all had no significant effect on
the model.
We also modify the disaster variable so that it measures the percentage of the population
affected by disasters in any given year, rather than a dummy taking the value of one when
this measure is above ten per cent.19 Surprisingly, neither form is a significant driver of
growth, nor adds to the predictive power of the model. In some cases it enters positively, a
result that leads to its exclusion, as there is no clear theoretical basis for this.
The Pacific dummy also adds to the model somewhat, showing growth rates up to two per
cent lower than the rest of the sample, while the other regional dummies add nothing and are
thus excluded. The significance of the Pacific dummy disappears with the inclusion of
linguistic fractionalization, however, suggesting they each capture some of the same effects.
Including just linguistic fractionalization results in a similarly negative coefficient. This
appears to reflect slow growth in highly fractionalized Pacific countries such as Papua New
Guinea, Vanuatu, and the Solomon Islands, contrasted with high growth in non-Pacific
countries with low fractionalization such as the Seychelles, St Kitts and Nevis, and St
Vincent and the Grenadines. As the linguistic fractionalization variable is a constant, and thus
unavailable in the fixed effects models, both are included in the basic model and excluded
These general results provide the basis for a model to which we can add aid and its
interactions to determine their effectiveness. This basic model, with aid variables excluded, is
[image:23.595.70.556.289.654.2]presented in Regression 8a on Table 3.
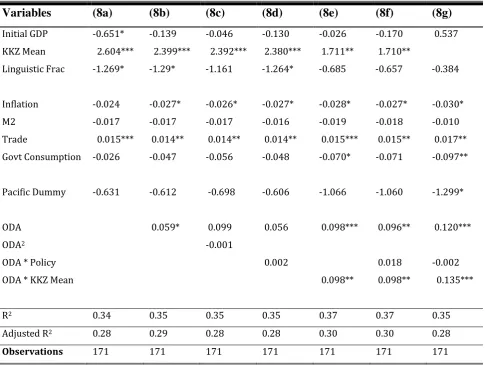
Table 3: Preferred Specification, OLS
Variables (8a) (8b) (8c) (8d) (8e) (8f) (8g)
Initial GDP ‐0.651* ‐0.139 ‐0.046 ‐0.130 ‐0.026 ‐0.170 0.537 KKZ Mean 2.604*** 2.399*** 2.392*** 2.380*** 1.711** 1.710**
Linguistic Frac ‐1.269* ‐1.29* ‐1.161 ‐1.264* ‐0.685 ‐0.657 ‐0.384
Inflation ‐0.024 ‐0.027* ‐0.026* ‐0.027* ‐0.028* ‐0.027* ‐0.030* M2 ‐0.017 ‐0.017 ‐0.017 ‐0.016 ‐0.019 ‐0.018 ‐0.010 Trade 0.015*** 0.014** 0.014** 0.014** 0.015*** 0.015** 0.017** Govt Consumption ‐0.026 ‐0.047 ‐0.056 ‐0.048 ‐0.070* ‐0.071 ‐0.097**
Pacific Dummy ‐0.631 ‐0.612 ‐0.698 ‐0.606 ‐1.066 ‐1.060 ‐1.299*
ODA 0.059* 0.099 0.056 0.098*** 0.096** 0.120***
ODA2 ‐0.001
ODA * Policy 0.002 0.018 ‐0.002
ODA * KKZ Mean 0.098** 0.098** 0.135***
R2 0.34 0.35 0.35 0.35 0.37 0.37 0.35
Adjusted R2 0.28 0.29 0.28 0.28 0.30 0.30 0.28
Observations 171 171 171 171 171 171 171
Towards a preferred specification: Including Aid and its Interactions
We next add the aid and interaction variables successively (regressions 8b – 8g, Table 3). We
note that aid is significant when included by itself, but loses significance when the squared
term is introduced, suggesting some interference between the variables, presumably caused
by their correlation20. Because of this, and due to the fact we have found little evidence for
the medicine model, we exclude the aid squared variable.21 Aid, then, is generally found to
have a positive and significant effect on growth in this model. The interaction of aid and
policy is insignificant, supporting the same finding in Easterly, Levine and Roodman (2004)
and Hansen and Tarp (2000), and contrasting that of Burnside and Dollar (2000). These
results are supported by the fixed effects estimations, although the GMM regressions are
more volatile and find less significance for all variables.22
Beyond aid itself, clearly the most significant result, and the most significant driver of
growth, is the quality of political and social institutions, measured by the KKZ variable. The
coefficient on the variable by itself is always large, positive, and significant, as is its
interaction with aid. The positive coefficient on the interaction term suggests that aid is more
effective when combined with good institutions, as was found when testing the Collier and
Dollar (2001) model. Given the constituent parts of KKZ, there is a clear interpretation for
this result. Interestingly, Collier and Dollar’s initial results found a negative coefficient on the
interaction of aid and institutions, with a positive coefficient on the interaction of aid and
policy. Again, greater data availability, particularly of other variables such as the ICRGE
measure of institutional quality and the CPIA measures of policy, would likely help to shed
Overall, this model represented by regressions 8e – 8g appear to fit the SIDS dataset more
satisfactorily than those taken from the literature, resulting in much great R2 values.
Although adjusted R2 values are generally not reported in the literature, they too are much
greater for these preferred specifications, in most cases exceeding the unadjusted R2 values of
the previous models.
5.
Conclusions
This paper extends the methods used in existing literature to test the statistical evidence of the
effect of aid on growth in Small Island Developing States. In general, we are able to
satisfactorily reproduce a number of the major models from the literature, with few
divergences when necessary, and create a preferred specification that appears to better fit the
SIDS dataset and shed some light on aid effectiveness in these countries.
Our results on aid are encouraging. We find in a number of models, including our preferred
specification, that aid has a significant and positive effect on growth. We also find that aid
appears to be more effective when combined with high quality institutions and social
infrastructure, such as the rule of law, government effectiveness and accountability, and
political stability and the absence of violence, which is a relatively clear result with a strong
intuitive basis. On the other hand, we depart from part of the literature in finding no evidence
that aid is more effective when combined with ‘good’ governmental policy, as defined by low
inflation, high openness to trade, low government consumption, and low financial depth. We
also find no substantial support for the so-called medicine model of aid effectiveness, and
These differences suggest that the conditionality and overall effectiveness of Official
Development Assistance differs significantly between the Small Island Developing States
and the general, all-inclusive datasets used in previous studies. For donors, particularly those
such as New Zealand and Australia, who primarily focus their development aid on countries
within our dataset, this could have strong implications. The results may suggest optimal
reallocation of aid to those countries with strong institutions, and perhaps the use of aid to
incentivize development of these institutions in countries where they are weak, in order to
increase both aid effectiveness and the direct growth effects of strong institutions.
These results show the underlying importance of considering distinct groups of countries, or
even individual countries, when making investigations of this nature. While many studies
find strong results over large datasets, these results cannot necessarily be generalized to all
countries, whether included in the study or not. This shows a need for expansion of the aid
effectiveness literature not just to new models and larger datasets, but also to smaller and
more specific datasets. Different countries, and groups of countries with unifying
characteristics, evidently have different drivers of growth and reactions to development aid,
with strong implications for optimal aid spending and allocation. These results for Small
Appendix
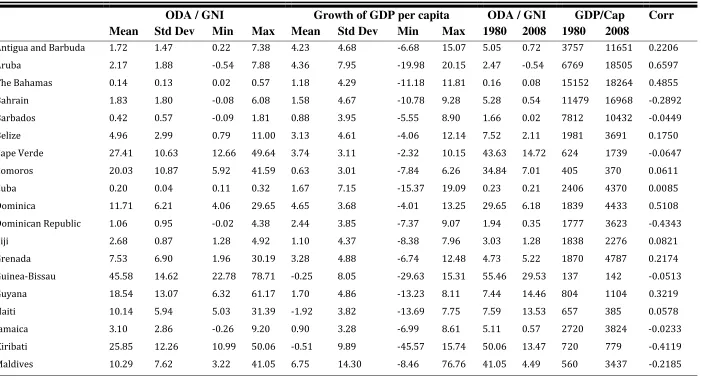
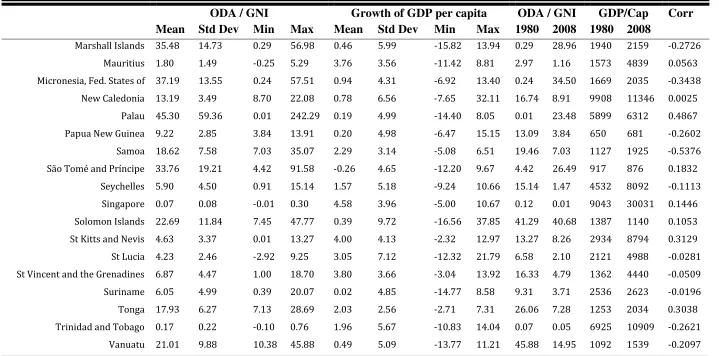
Table A1: Countries and Summary Data
ODA / GNI Growth of GDP per capita ODA / GNI GDP/Cap Corr Mean Std Dev Min Max Mean Std Dev Min Max 1980 2008 1980 2008
Table A1: Countries and Summary Data (cont.)
ODA / GNI Growth of GDP per capita ODA / GNI GDP/Cap Corr Mean Std Dev Min Max Mean Std Dev Min Max 1980 2008 1980 2008
Marshall Islands 35.48 14.73 0.29 56.98 0.46 5.99 ‐15.82 13.94 0.29 28.96 1940 2159 ‐0.2726 Mauritius 1.80 1.49 ‐0.25 5.29 3.76 3.56 ‐11.42 8.81 2.97 1.16 1573 4839 0.0563 Micronesia, Fed. States of 37.19 13.55 0.24 57.51 0.94 4.31 ‐6.92 13.40 0.24 34.50 1669 2035 ‐0.3438
New Caledonia 13.19 3.49 8.70 22.08 0.78 6.56 ‐7.65 32.11 16.74 8.91 9908 11346 0.0025 Palau 45.30 59.36 0.01 242.29 0.19 4.99 ‐14.40 8.05 0.01 23.48 5899 6312 0.4867 Papua New Guinea 9.22 2.85 3.84 13.91 0.20 4.98 ‐6.47 15.15 13.09 3.84 650 681 ‐0.2602
Samoa 18.62 7.58 7.03 35.07 2.29 3.14 ‐5.08 6.51 19.46 7.03 1127 1925 ‐0.5376 São Tomé and Príncipe 33.76 19.21 4.42 91.58 ‐0.26 4.65 ‐12.20 9.67 4.42 26.49 917 876 0.1832
Seychelles 5.90 4.50 0.91 15.14 1.57 5.18 ‐9.24 10.66 15.14 1.47 4532 8092 ‐0.1113 Singapore 0.07 0.08 ‐0.01 0.30 4.58 3.96 ‐5.00 10.67 0.12 0.01 9043 30031 0.1446 Solomon Islands 22.69 11.84 7.45 47.77 0.39 9.72 ‐16.56 37.85 41.29 40.68 1387 1140 0.1053 St Kitts and Nevis 4.63 3.37 0.01 13.27 4.00 4.13 ‐2.32 12.97 13.27 8.26 2934 8794 0.3129 St Lucia 4.23 2.46 ‐2.92 9.25 3.05 7.12 ‐12.32 21.79 6.58 2.10 2121 4988 ‐0.0281 St Vincent and the Grenadines 6.87 4.47 1.00 18.70 3.80 3.66 ‐3.04 13.92 16.33 4.79 1362 4440 ‐0.0509 Suriname 6.05 4.99 0.39 20.07 0.02 4.85 ‐14.77 8.58 9.31 3.71 2536 2623 ‐0.0196 Tonga 17.93 6.27 7.13 28.69 2.03 2.56 ‐2.71 7.31 26.06 7.28 1253 2034 0.3038 Trinidad and Tobago 0.17 0.22 ‐0.10 0.76 1.96 5.67 ‐10.83 14.04 0.07 0.05 6925 10909 ‐0.2621
Vanuatu 21.01 9.88 10.38 45.88 0.49 5.09 ‐13.77 11.21 45.88 14.95 1092 1539 ‐0.2097
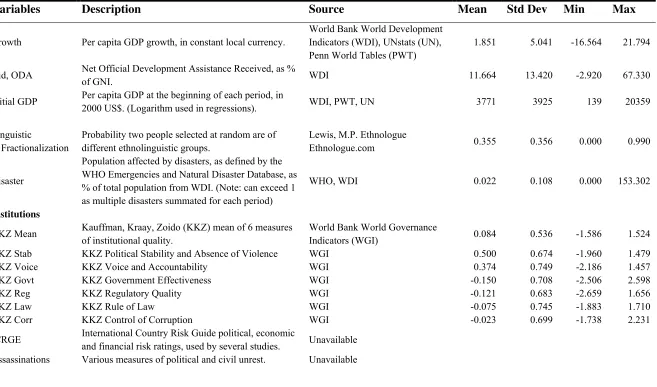
Table A2: Variable Descriptions
Variables Description Source Mean Std Dev Min Max
Growth Per capita GDP growth, in constant local currency.
World Bank World Development Indicators (WDI), UNstats (UN), Penn World Tables (PWT)
1.851 5.041 -16.564 21.794
Aid, ODA Net Official Development Assistance Received, as %
of GNI. WDI 11.664 13.420 -2.920 67.330
Initial GDP Per capita GDP at the beginning of each period, in
2000 US$. (Logarithm used in regressions). WDI, PWT, UN 3771 3925 139 20359
Linguistic Fractionalization
Probability two people selected at random are of different ethnolinguistic groups.
Lewis, M.P. Ethnologue
Ethnologue.com 0.355 0.356 0.000 0.990
Disaster
Population affected by disasters, as defined by the WHO Emergencies and Natural Disaster Database, as % of total population from WDI. (Note: can exceed 1 as multiple disasters summated for each period)
WHO, WDI 0.022 0.108 0.000 153.302
Institutions
KKZ Mean Kauffman, Kraay, Zoido (KKZ) mean of 6 measures of institutional quality.
World Bank World Governance
Indicators (WGI) 0.084 0.536 -1.586 1.524 KKZ Stab KKZ Political Stability and Absence of Violence WGI 0.500 0.674 -1.960 1.479 KKZ Voice KKZ Voice and Accountability WGI 0.374 0.749 -2.186 1.457 KKZ Govt KKZ Government Effectiveness WGI -0.150 0.708 -2.506 2.598 KKZ Reg KKZ Regulatory Quality WGI -0.121 0.683 -2.659 1.656 KKZ Law KKZ Rule of Law WGI -0.075 0.745 -1.883 1.710 KKZ Corr KKZ Control of Corruption WGI -0.023 0.699 -1.738 2.231
ICRGE International Country Risk Guide political, economic
Notes: All data represents annual data, except those for BD Policy which is only calculated for 4-year data. Those country-years determined as outliers by the Hadi method for aid and per capita growth are excluded. Because of the summation of multiple disasters in some country-years, the disaster variable can exceed 100% of the population. This maximum is an extreme outlier.
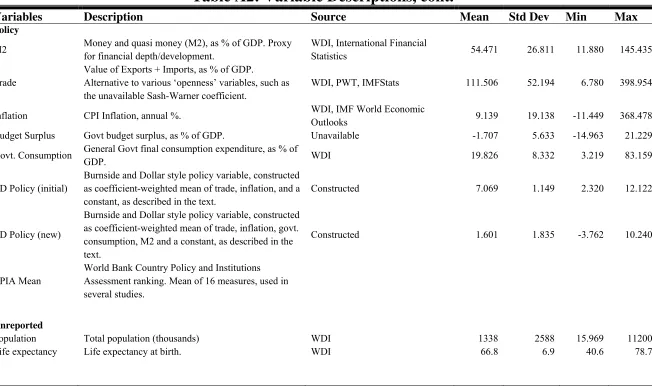
Table A2: Variable Descriptions, cont.
Variables Description Source Mean Std Dev Min Max
Policy
M2 Money and quasi money (M2), as % of GDP. Proxy for financial depth/development.
WDI, International Financial
Statistics 54.471 26.811 11.880 145.435
Trade
Value of Exports + Imports, as % of GDP.
Alternative to various ‘openness’ variables, such as the unavailable Sash-Warner coefficient.
WDI, PWT, IMFStats 111.506 52.194 6.780 398.954
Inflation CPI Inflation, annual %. WDI, IMF World Economic
Outlooks 9.139 19.138 -11.449 368.478 Budget Surplus Govt budget surplus, as % of GDP. Unavailable -1.707 5.633 -14.963 21.229
Govt. Consumption General Govt final consumption expenditure, as % of
GDP. WDI 19.826 8.332 3.219 83.159
BD Policy (initial)
Burnside and Dollar style policy variable, constructed as coefficient-weighted mean of trade, inflation, and a constant, as described in the text.
Constructed 7.069 1.149 2.320 12.122
BD Policy (new)
Burnside and Dollar style policy variable, constructed as coefficient-weighted mean of trade, inflation, govt. consumption, M2 and a constant, as described in the text.
Constructed 1.601 1.835 -3.762 10.240
CPIA Mean
World Bank Country Policy and Institutions Assessment ranking. Mean of 16 measures, used in several studies.
Unreported
Table A3: Burnside and Dollar Policy Variable Regression
Variables BD(2000) A1
Initial GDP ‐0.65 Initial GDP ‐0.492
Ethnolinguistic Frac ‐0.58 Linguistic Fractionalization ‐1.423*
Assassinations ‐0.44* KKZ Stab 0.568
Ethnic x Assassinations 0.81*
Institutional Quality 0.64** KKZ Mean 1.037
M2 (Lagged) 0.015 M2 (Lagged) ‐0.010
Budget Surplus 6.85**
Inflation ‐1.40** Inflation ‐0.021
Openness (Sachs‐Warner) 2.16** Trade 0.020***
Sub‐Saharan Africa ‐1.53** Pacific ‐1.192*
East Asia 0.89 Caribbean ‐0.102
R2 0.35 0.27
Adjusted R2 0.22
Observations 275 159
*, **, *** indicate significance at 10%, 5% and 1% levels respectively.
Constant not reported. Trade, Govt Consumption, Budget Surplus and M2 given as % of GDP, ODA as % GNI.
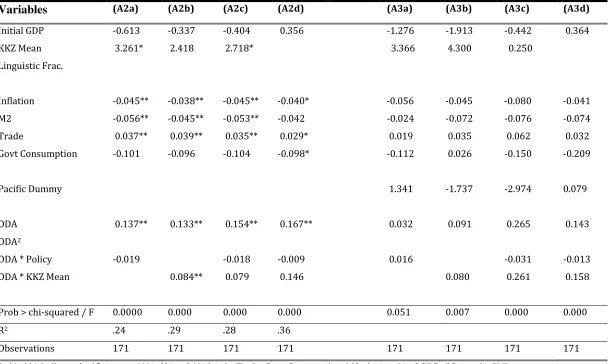
Table A4: Preferred Specification, FE and GMM
Variables (A2a) (A2b) (A2c) (A2d) (A3a) (A3b) (A3c) (A3d) Initial GDP ‐0.613 ‐0.337 ‐0.404 0.356 ‐1.276 ‐1.913 ‐0.442 0.364
KKZ Mean 3.261* 2.418 2.718* 3.366 4.300 0.250
Linguistic Frac.
Inflation ‐0.045** ‐0.038** ‐0.045** ‐0.040* ‐0.056 ‐0.045 ‐0.080 ‐0.041 M2 ‐0.056** ‐0.045** ‐0.053** ‐0.042 ‐0.024 ‐0.072 ‐0.076 ‐0.074 Trade 0.037** 0.039** 0.035** 0.029* 0.019 0.035 0.062 0.032 Govt Consumption ‐0.101 ‐0.096 ‐0.104 ‐0.098* ‐0.112 0.026 ‐0.150 ‐0.209
Pacific Dummy 1.341 ‐1.737 ‐2.974 0.079
ODA 0.137** 0.133** 0.154** 0.167** 0.032 0.091 0.265 0.143
ODA2
ODA * Policy ‐0.019 ‐0.018 ‐0.009 0.016 ‐0.031 ‐0.013
ODA * KKZ Mean 0.084** 0.079 0.146 0.080 0.261 0.158
Prob > chi‐squared / F 0.0000 0.000 0.000 0.000 0.051 0.007 0.000 0.000
R2 .24 .29 .28 .36
Observations 171 171 171 171 171 171 171 171
*, **, *** Indicate significance at 10%, 5% and 1% levels. Trade, Govt Consumption, M2 given as % of GDP, ODA as % GNI. Period dummies not reported.
Table A5: Preferred Specification, OLS (including ODA
2)
Variables (8a) (8b) (8c) (8d) (8e) (8f) (8g)
Initial GDP ‐0.651* ‐0.139 ‐0.046 ‐0.040 ‐0.166 ‐0.155 0.247
KKZ Mean 2.604*** 2.399*** 2.392*** 2.391*** 1.558* 1.554*
Linguistic Frac ‐1.269* ‐1.29* ‐1.161 ‐1.141 ‐0.778 ‐0.737 ‐0.545
Inflation ‐0.024 ‐0.027* ‐0.026* ‐0.026 ‐0.029** ‐0.029* ‐0.032**
M2 ‐0.017 ‐0.017 ‐0.017 ‐0.016 ‐0.019 ‐0.018 ‐0.011
Trade 0.015*** 0.014** 0.014** 0.014** 0.016*** 0.015** 0.017**
Govt Consumption ‐0.026 ‐0.047 ‐0.056 ‐0.057** ‐0.059 ‐0.061 ‐0.077*
Pacific Dummy ‐0.631 ‐0.612 ‐0.698 ‐0.693 ‐1.020 ‐1.010 ‐1.188*
ODA 0.059* 0.099 0.098 0.035 0.032 0.018
ODA2 ‐0.001 0.001 0.002 0.003 0.003
ODA * Policy ‐0.001 0.002 ‐0.004
ODA * KKZ Mean 0.121** 0.121** 0.167***
R2 0.34 0.35 0.35 0.35 0.37 0.37 0.36
Adjusted R2 0.28 0.29 0.28 0.28 0.30 0.30 0.28
Observations 171 171 171 171 171 171 171
Notes
1
All aid data are taken from the World Bank World Development Indicators and SourceOECD databases. See Table A1 for summary aid data.
2
A full list of countries to be used can be found in Table A1. 3
ODA must be official aid intended for development purposes, and includes pure donations as well as loans with a grant element of at least 25%, at a fixed discount rate of 10%. It includes debt relief plans, which reduces the accuracy of the data for analyses such as this by adding a delay between receipt of funds and appearance in ODA statistics. It does not exclude tied aid nor aid in the form of technical co-operation. By definition, it is only received by countries meeting certain DAC ‘least developed’ criteria, but in some cases we include the
equivalent, Official Aid, for countries who have recently been removed from the list of such least developed countries.
4
While a panel of existing indicators such as the UNDP’s Human Development Index, life expectancy, infant mortality, educational rates, measures of human rights, and so on, would be of some use in an analysis such as this, the stock of such data for these countries is so porous that any analysis would be econometrically weak. 5
See Hadjimichael et al (2005), Lesink and White (2001), Dalgaard and Hansen (2001), Hansen and Tarp (2000; 2001), Dalgaard, Hansen and Tarp (2004), Feeny and McGillivray (2010), Collier and Dollar (2002), Clemens, Radalet and Bhavnani (2004), and incorporated in a slightly modified form into Burnside and Dollar (2000; 2004; and their extensions) and Murphy and Tresp (2006), among others.
6
See also Guillaumont and Chauvet (2004), Murphy and Tresp (2006); Roodman (2004; 2008), Feeny and McGillivray (2010), and Rajan and Subramanian (2005; 2008).
7
Exceptions include Pavlov and Sugden (2006), and Rao, Sharma and Singh (2007), however the former focuses on just seven Pacific countries, while the later develops a growth model that is too divergent from the core aid effectiveness literature to provide any sort of results comparability.
8
For robustness, we tested the effects of aggregating using a moving average, rather than the traditional method, as well as with periods of various lengths. None of these results were particularly instructive, and as such we keep with the usual methods used in the literature, where the norm is 4-year periods.
9
One result of this is the inclusion of countries such as Singapore, which are generally now considered anything but ‘developing’, however this is necessary to remove the bias mentioned, and only years in which they were listed as ODA recipients are included.
10
We also exclude country-years for which the data is a significant outlier, as determined by the Hadi method for multivariate samples using our aid and growth variables. These 13 outliers include events such as Kiribati’s 1980 post-independence adjustment of high aid and extremely high negative growth, years of extremely high aid and low growth in 1994-1998 post-independence Palau, and Guinea-Bissau’s 1998 attempted coup and civil war. Outliers are also excluded from 4-year aggregations.
11
In fact, the KKZ Stability variable may be a better measure of what the assassinations variable intends to capture.
12
This is designed to be appropriate for small T, large N panels with linear functional relationships; inclusion of variables which are endogenous, particularly through correlation with their own past and future values; use of a dependent variable that is potentially correlated with its past values; inclusion of fixed individual effects; and possible presence of heteroskedasticity and autocorrelation within individuals.
13
Burnside and Dollar also use 2SLS, but note little difference in its results. I also test using both methods, using the same instruments as Burnside and Dollar, with the exception of the unavailable arms imports variable. As our results are also unaffected, we do not report these extra regressions.
14
Full results of this regression are reported in Table A3 of the appendix.
This is later re-estimated when using different time-horizons and aggregation methods, but the full regressions are not re-reported.
15
Defined here as having per capita GDP less than US$10,000 (Constant 2000 Dollars) in any given period 16
When restricted to their listed countries and periods, the dataset still has more observations than their full dataset. Without access to their dataset, we are unable to see where the gaps are, and thus unable to remove those observances. While this is clearly not ideal, and likely accounts for many of the differences between their results and my ‘restricted’ dataset results, there is no way around this and I must proceed with the restricted dataset as is.
17 Again it is important to emphasize that our restricted dataset is not identical to Feeny and
McGillivray’s. See note 17.
18
19
Due to simple summation of number affected in the case of multiple disasters, there are several data-points that have a percentage slightly above 100.
20
Roodman (2008) explores this issue at length, arguing that proliferation of interaction variables, particularly the aid squared term, causes multicollinearity and can, in some cases, magnify endogeneity effects and lead to invalid results.
21
For comparison, the results including the aid-squared variable are in Table A5 in the appendix. We note the decreased significance of aid whenever aid squared is included.
22
These results are presented in Appendix Table A4, with Regression A2 representing fixed effects regressions and A3 representing the two-step GMM regressions.
Interactions with other variables, such as the disaster variable, population, per capita GDP, life expectancy, KKZ Voice and Accountability, and the Pacific Dummy are insignificant and sensitive to specification, and thus these tests are not reported.
References
Bulir, A., and A. J. Hamann. (2007) Volatility of Development Aid: An Update.
IMF Staff Papers 54 pp.727-39.
Bulir, A., and A. J. Hamann. (2003) Aid Volatility: An Empirical Assessment.
IMF Staff Papers 50, no. 1 pp.64-89.
Burnside, C., and D. Dollar. (2004) Aid, Policies and Growth: Reply.
American Economic Review 94 pp.781-84.
Burnside, C., and D. Dollar. (2000) Aid, Policies, and Growth.
The American Economic Review 90, no. 4 pp. 847-868.
Burnside, C., and D. Dollar. (2004b) Aid, Policies, and Growth: Revisiting the Evidence. World Bank Policy Research Paper Number O-2834
Bosworth, B., and S. M. Collins. (2003) The Empirics of Growth: Comments and Discussion An Update. Brookings Papers on Economic Activity 2 pp.113-206.
Chauvet, L., and P. Guillaumont. (2003) Aid and Growth Revisited: Policy, Economic Vulnerability and Political Instability. CERDI Working Paper 2003.27.
Chervin, C., and S. van Wijnbergen. (2010) Economic Growth and the Volatility of Foreign Aid. Tinbergen Institute Discussion Paper.
Christensen, P. W., H. Doucouliagos, and M. Paldam. (2010) Master List of the AEL: Aid Effectiveness Literature. University of Aarhus
http://mit.econ.au.dk/vip_htm/MPaldam/papers-meta.php4 (accessed 11/11/2010).
Clemens, M., S. Radalet, and R. Bhavnani. (2004) Counting Chickens When They Hatch: The Short- Term Effect of Aid on Growth. Centre For Global Development Working Paper 44
Collier, P., and D. Dollar. (2002) Aid Allocation and Poverty Reduction.
European Economic Review 46 pp.1475-1500.
Cordella, T., and G. Dell'Ariccia. (2007) Budget Support Versus Project Aid: A Theoretical Appraisal. The Economic Journal 117 pp.1260-1279.
Easterly, W., R. Levine, and D. Roodman. (2004) Aid, Policies, and Growth: Comment.
The American Economic Review 94, no. 3 p.774.
Dayton-Johnson, J., and J. Hoddinott. (2003) Aid, Policies, and Growth, redux. Dalhousie University Working Paper
Dalgaard, C.-J., and H. Hansen. (2001) On Aid, Growth, and Good Policies.
Economic Journal 114, no. 191-216
Doucouliagos, H., and M. Paldam. (2006) Aid Effectiveness on Accumulation: A Meta Study.
KYKLOS 59, no. 2 pp. 227-254.
Doucouliagos, H., and M. Paldam. (2010) Conditional Aid Effectiveness: A Meta-Study.
Journal of International Development 22 pp. 391-410.
Doucouliagos, H., and M. Paldam. (2009) The Aid Effectiveness Literature: The Sad Results of 40 Years of Reasearch. Journal of Economic Surveys 23, no. 3 pp. 443-461.
Feeny, S., and M. McGillivray. (2010) Aid and Growth in Small Island Developing States. Journal of Development Studies 46, no. 5 pp.897-917.
Guillaumont, P. (2009) Assessing the Economic Vulnerability of Small Island Developing States and the Least Developed Countries. CERDI Working Paper 2009.12
Guillaumont, P., and L. Chauvet. (2001) Aid and Performance: A Reassessment.
Journal of Development Studies 37, pp.66-92
Gomanee, K., S. Girma, and O. Morrissey. (2003) Aid, Public Spending, and Human Welfare: Evidence from Quantile Regressions. DSA Annual Conference Paper.
Hajimichael, M. T., D. Ghura, M. Mühleisen, R. Nord, and E. Ucer. (1995) Sub-Saharan Africa: Growth, Savings and Investment, 1986-93. IMF Occasional Paper, No. 118.
Hansen, H., and F. Tarp. (2001) Aid and Growth Regressions. Journal of Development Economics 64 pp. 547-570.
Hansen, H., and F. Tarp. (2000) Aid Effectiveness Disputed. Journal of International Development 12 pp.375-398.
Hefeker, C. (2005) Project Aid or Budget Aid? The Interests of Governments and Financial Institutions. University of Siegen Conference Report
Jelovac, I., and F. Vandeninden. (2008) How Should Donors Give Foreign Aid? Project Aid Versus Budget Support. CNRS Working Paper 08-13
Kaufmann, D., A. Kraay, and P. Zoido. (1999) Aggregating Governance Indicators. World Bank Policy Research Working Paper No. 2195.
Kenny, C. (2006) What Is Effective Aid? How Would Donors Allocate It? World Bank Policy Research Working Paper 4005.
Kosack, S. (2003) Effective Aid: How Democracy Allows Development Aid to Improve the Quality of Life. World Development 31 pp. 1-22.
Lensick, R., and H. White. (2001) Are There Negative Returns to Aid? Journal of Development Studies 37, no. 6 pp. 42-65.
Murphy, R. G., and N. G. Tresp. (2006) Government Policy and the Effectiveness of Foreign Aid. Economics Dept, Boston College, Working Paper 399.
Masud, N., and B. Yontcheva. (2005) Does Foreign aid Reduce Poverty? Empirical Evidence from Nongovernmental and Bilateral Aid. IMF Working Paper
McGillivray, M., and F. Noorbakhsh. (2007) Aid, Conflict and Human Development. University of Glasgow Working Papers 2007-03
Miquel-Florensa, J. M. (2007) Aid Effectiveness: A Comparison of Tied and Untied Aid. York University Working Paper 2007-02
Moe, T. L. (2008) An Empirical Investigation of Relationships Between Official Development Assistance (ODA) and Human and Educational Development.
International Journal of Social Economics 35, no. 3 pp.202-221. Pavlov, V., and C. Sugden. (2006) Aid and Growth in the Pacific Islands.
National Bureau of Economics Working Paper W9490 Sachs, J. D. (2001) Tropical Underdevelopment.
National Burea of Economic Reasearch Working Paper W8119
Rajan, R. G., and A. Subramanian. (2008) Aid and Growth: What Does The Cross Country Evidence Really Show? The Review of Economics and Statistics 90, no. 4 pp.643-665.
Rajan, R. G., and A. Subramanian. (2005) Aid and Growth: What Does the Cross-Country Evidence Really Show? IMF Working Paper
Rao, B. B., K. L. Sharma, and R. Singh. (2007) Estimating Aid-Growth Equations: the Case of Pacific Island Countries. MPRA Paper No. 4696.
Roodman, D. (2006) How to do xtabond2: An Introduction to Difference and System GMM in Stata. Center for Global Development Working Paper 103.
Roodman, D. (2007) Macro Aid Effectiveness Research: A Guide for the Perplexed. Center for Global Development Working Paper 134
Roodman, D. (2004) The Anarchy of Numbers: Aid, Development and Cross-Country Empirics. Center for Global Development Working Paper 32
Roodman, D. (2008) Through the Looking Glass, and What OLS Found There: On Growth, Foreign Aid, and Reverse Causality.
Working Paper, Centre for Global Development, Centre for Global Development.
Teboul, R., and E. Moustier. (2001) Foreign Aid and Economic Growth: The Case of the Countries South of the Mediterranean. Applied Economics Letters 8 pp. 187-90.
Wagner, L. (2008) Thresholds in Aid Effectiveness. CERDI Working Paper 2008.22.
Williamson, C. (2008) Foreign Aid and Human Development: The Impact of Foreign Aid to the Health Sector. Southern Economic Journal 75, no. 1 pp.188-207.