Munich Personal RePEc Archive
Assessment of the income situation of
households in the Czech Republic
Turčínková, Jana and Stávková, Jana
Mendel University, Faculty of Business and Economics
7 February 2011
Online at
https://mpra.ub.uni-muenchen.de/33508/
The evaluations of the standard of living using macroeconomic aggregates – gDP per capita and gDP growth rates, does not tell, due to structure of gDP (private consumption, government consump-tion and investment) much about the standard of living of the population adequately (Kabát 2007). This economic perspective is appropriate to be sup-plemented with the findings of social research. An important part of the social survey research is the assessment of the income situation of households, their physical equipment, standard of living and the perceptions of the economic situation of households themselves. The most frequent subject of research interest is the income differentiation of population with emphasis on households at the risk of poverty, households with the lowest income, the relation of the income group to the household segmentation in social, age, educational and regional categories (Sirovátka and Mareš 2009).
The main objective of the presented analysis is to evaluate the basic indicators of the income situ-ation of households in the czech republic (cr) collectively, by social groups, the development of income differentiation in the years 2005–2008 and
the perception of income and material situation of households.
The results of the analysis can be used in formulating social policies, building and managing social networks and by doing so, it can provide also the protection of the individuals and social groups that are vulner-able to poverty and consequently may lead to social exclusion (non-availability of housing, employment, education). Another use of these results of the analy-sis suggests itself in determining the incentives for entrepreneurship and their impact on consumers and the incentives for the development of regions. The results of the income situation analysis of households in a selected group (farmers) were already published by Stejskal and Stávková (2010).
METHODOLOGY
The analysis of the income situation is based on the data obtained from the project EU-SiLc (European Union – Statistics on income and Living conditions), following the EU methodology for the years 2005– 2008. The basic variable is the level of the monthly
Assessment of the income situation of households
in the Czech Republic
Jana TURČÍNKOVÁ, Jana STÁVKOVÁ
Department of Marketing and Trade, Faculty of Business and Economics,
Mendel University in Brno, Brno, Czech Republic
Abstract: The paper deals with the assessment of income situation of households in the czech republic. The primary source for the analysis were the data of the survey EU-SiLc European Union – Statistics on income and Living conditions. The basic variable for the analysis is the level of the household income in 2005–2008. in addition to the decile classification, characteristics such as the average income per one household member, poverty threshold, poverty depth coefficient, Lorenz curve and gini coefficient. were calculated in order to evaluate the income situation. The results show an increase of the average household income. The Lorenz curve followed by the gini coefficient demonstrate the uniformity of distribution of income values. The results show a decreasing income differentiation. The poverty threshold was defined on the level of 60% of the median value and with this given threshold, the households were assessed, whether they belong to the ones at the risk of poverty. The results reveal a decreasing number of households at the risk of poverty. The poverty depth coefficient has a stronger explanatory power and shows how far below the poverty threshold the households are, or what is an income deficit of these households. Each category of households at the risk of poverty varies with the depth of poverty. The analysis also provides the results of how the households’ income situation or poverty is perceived by the households themselves.
Key words: income differentiation of households, households at risk of poverty, material deprivation, perception of the income situation, EU SiLc
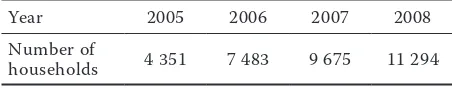
disposable income per a particular household. The samples are representative in accordance with the de-mographic and socioeconomic characteristics (Stejskal et al. 2010). Sample sizes are given in Table 1.
The calculation of the characteristics of general levels (mean and median) is based on those obtained D-FYz and converted values (equivalised) D-EKV. The conversion is performed in compliance with the common EU methodology – the household is assigned an coefficient 1 for one adult member, the coefficient 0.5 for other adults in the household and child from 13 years of age, and for each child aged 0–13 years the coefficient of 0.3. To make international comparisons possible (which is beyond the scope of this paper), all calculations and analyses were carried out using equiv-alised values. This calculation procedure also allows a comparison of the income situation of households of different sizes and different composition.
To reflect the income differentiation, the Lorenz curve and gini coefficient were used. The Lorenz curve is a result of the projection of the percentage of population on the x axis and the percentage of household income on the y axis. The curve expresses
the relationship between the absolute equality and the actual inequality in income distribution. comparing the actual and the ideal Lorenz curve, there is obtained the gini coefficient, which expresses the deviation from the absolute equality. The calculation is based on the equation
Y
Y
X
X
k kn k k k k G 1 1 0 1 1
where Xk and Yk are the cumulative frequencies of
population and income variables.
To determine the poverty threshold, the decile classification is used (Stejskal and Stávková 2010). The proportion of population in the risk of poverty is estimated on the basis of the value of the poverty threshold as 60% of the median of the appropriate income variable. halleröd and Larsson (2008: 16) define the poor as: “those who, due to insufficient access to economic resources, have an unacceptably low level of consumption of goods and services” and they note that different measures serve identification of different individual as poor and, therefore, differ-ent measures of poverty lead to differdiffer-ent distribution in population.
Poverty can be seen as one out of number of dimen-sions of exclusion (thus a rupture of the relationship between an individual and the society at different levels), or as a result of being excluded from the labour market (Woodward and Kohli 2001).
Poverty can be seen as one out of number of dimen-sions of exclusion (thus a rupture of the relationship between an individual and the society at different levels), or as a result of being excluded from the labour market (Woodward and Kohli 2001).
Medeiros (2006: 4) points out that poverty situa-tion is such as “one or more individuals live below the minimum considered conditions”, however, the definition of what is the minimum is based on a value judgment that usually takes into consideration “life conditions of the other individuals”. The construc-tion of poverty lines is based on the criteria almost never fully consensual.
The identification of the thresholds of households at the risk of poverty leading to the division of house-holds “at risk” of poverty and “others” is, according to Proctor and Dalaker (2003), not sufficient. They, therefore, recommend the calculation of additional parameters – the depth of poverty. This index reflects better the allocation of resources among households. The depth of poverty is defined by Proctor as the ratio of the household income to the defined poverty threshold. if this ratio ranges from 1 to 1.25, the household is already considered as poor, while 1.25 puts the family in the category “already poor”, value 1 sets the family in the category “poor” household, and where the coefficient is less than 1, the house-hold is considered “very poor”. Besides the objective poverty, the subjective perceptions of poverty should be analyzed too.
For deeper poverty, the assessment indicators of material deprivation were used. Deprivation is un-derstood as the physical and/or mental suffering, as a lack of something that is in a particular society considered to be a value. As a value, we can indicate a certain level of the household income, household accessories and equipment, however, also education, work, health, etc. can be regarded as a value. Townsend (Boháčová 2007) has made a list of 12 indicators of material deprivation. The paper will focus on only one of them, the basic needs.
[image:3.595.63.289.85.129.2]The perceptions of the household income situation obtained from the SiLc project is confronted with the views on the economic situation of households collected in the investigation of the Public opinion research centre of the institute of Sociology of the Academy of Sciences of the czech republic in 2008, and the results of the common research conducted within the framework of the consumer
Table 1. Sample sizes
Year 2005 2006 2007 2008 number of
households 4 351 7 483 9 675 11 294
BEhaviour research Erasmus network (coBErEn) – a network of expert partners in the consumer Behaviour in Europe with the purpose of analysing and disseminating the knowledge on consumer Behaviour. The authors are members of the research team representing the czech republic.
RESULTS
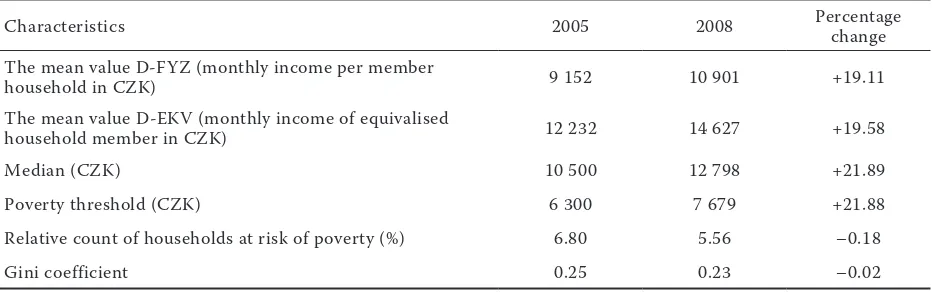
The values of the characteristics of income dif-ferentiation and their changes in 2005 and 2008 are listed in Table 2.
Data from Table 2 suggest that the average monthly income per one household member during the re-porting period increased by 19.5%, the median rose by 21.9%. in absolute terms, the average monthly income per one household member has increased from 2005 to 2008 by 1749 czK.
Table 2 also shows that the at-risk-of-poverty rate in 2005 was 6.8%, in 2008 there was a decrease of 1.2% to 5.56% (with an increase in poverty threshold by 21%). Thus the number of households that have not reached the income threshold (and thus can be classified in poverty risk) decreases. given the size of the household sample, the authors do not want to comment on the results in absolute terms, but they consider it possible to generalize and apply the findings and the relative values to the total popula-tion of czech republic. The gini coefficient, which is an indicator of income inequality, reaches 0.25. its decline to 0.23 in 2008 shows a decline in the income differentiation.
[image:4.595.65.536.85.231.2]Looking at the Lorenz curve (Figure 1), we can say that 10% of households with the lowest incomes receive about 4% of the total incomes and 10% of households with the highest income take almost 20% of the total incomes.
Table 2. income situation of households in the czech republic
characteristics 2005 2008 Percentage change
The mean value D-FYz (monthly income per member
household in czK) 9 152 10 901 +19.11
The mean value D-EKV (monthly income of equivalised
household member in czK) 12 232 14 627 +19.58
Median (czK) 10 500 12 798 +21.89
Poverty threshold (czK) 6 300 7 679 +21.88
relative count of households at risk of poverty (%) 6.80 5.56 –0.18
gini coefficient 0.25 0.23 –0.02
[image:4.595.98.495.540.725.2]Source: calculations of authors
Figure 1. Lorenz curve in 2008
Source: Data from SiLc processes by authors
40 50 60 70 80 90 100
h
o
u
se
h
o
ld
i
n
co
m
es
s
h
ar
e
(%
)
Lorenz curve
Ideal income distribution curve
0 10 20 30
0 10 20 30 40 50 60 70 80 90 100
C
u
m
m
u
la
ti
v
e
h
For a better orientation in the distribution of house-hold incomes, the following Table 3 provides the selected characteristics of households in different deciles.
in Table 3 in the second column, there are the limit values of the measured income listed, sorted in the appropriate deciles. The growth of income variables over the period can be perceived positively. The
[image:5.595.63.535.85.295.2]percentage distribution of income volumes in the individual deciles in the reporting period 2005 and 2008 is nearly identical. The average income per one household member in the first decile increased at the 4-year reporting period by 27.35%, the average income per one household member in the last decile increased by 19.60%. All these facts are a manifestation of the decreasing level of income differentiation.
Table 3. Decile classification
Deciles
2005 2008
range of values cumulative amount of income (%) incomesaverage range of values cumulative amount of income (%) incomesaverage
10 750–6 846 4 5 507 0–8 500 5 7 013
20 6 851–7 968 11 12 937 8 500–9 797 11 16 197 30 7 968–8 846 18 21 334 9 800–10 786 18 26 489 40 8 850–9 644 25 30 579 10 786–11 777 26 37 775 50 9 644–10 500 35 40 660 11 778–12 795 35 50 045 60 10 500–11 642 44 51 727 12 796–14 181 44 63 509 70 11 646–13 222 54 64 105 14 182–15 854 54 78 453 80 13 222–15 321 66 78 313 15 854–18 235 65 95 424 90 15 331–18 789 80 95 133 18 238–22 220 79 115 427 100 18 861–253 348 100 122 282 20 220–220 102 100 146 244
Source: calculations of author
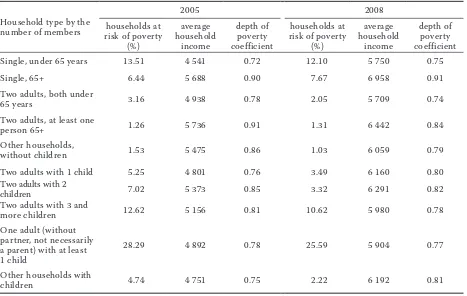
Table 4. characteristics of poverty for households at risk of poverty based on the number of household members
household type by the number of members
2005 2008
households at risk of poverty
(%)
average household
income
depth of poverty coefficient
households at risk of poverty
(%)
average household
income
depth of poverty coefficient Single, under 65 years 13.51 4 541 0.72 12.10 5 750 0.75
Single, 65+ 6.44 5 688 0.90 7.67 6 958 0.91
Two adults, both under
65 years 3.16 4 938 0.78 2.05 5 709 0.74
Two adults, at least one
person 65+ 1.26 5 736 0.91 1.31 6 442 0.84
other households,
without children 1.53 5 475 0.86 1.03 6 059 0.79 Two adults with 1 child 5.25 4 801 0.76 3.49 6 160 0.80 Two adults with 2
children 7.02 5 373 0.85 3.32 6 291 0.82
Two adults with 3 and
more children 12.62 5 156 0.81 10.62 5 980 0.78 one adult (without
partner, not necessarily a parent) with at least 1 child
28.29 4 892 0.78 25.59 5 904 0.77
other households with
children 4.74 4 751 0.75 2.22 6 192 0.81
[image:5.595.67.534.456.752.2]To determine the effective measures taken in con-nection with the definition of social policy, regional development and to support entrepreneurial activities, it is necessary to analyze the income situation in detail. one option is to follow up, how the households are affected differently by the risk of poverty based on their belonging to the particular social groups, how differently they are threatened by the poverty risk due to the household structure or divided by other criteria, such as the type of education, etc.
The number of households at the risk of poverty in different households based on the number of house-hold members is shown in Table 4.
The individual segments of households by the number of members most vulnerable to poverty are the households that consist of at least one adult and one child, the households made up by individuals un-der 65 years, and complete households with 3 or more children. over the period 2005–2008, the situation improved in two-parent households with 2 children (7% of households at the risk of poverty fell to 3%), in other categories of households, we experienced an income situation improvement, however, not very significant. The deterioration of financial situation has occurred only in the household type single, 65+.
As an additional characteristic of households in the risk of poverty, the Table 4 provides a calculated coef-ficient of the poverty depth for different household types according to the number of their members. This indicator shows how far below the poverty threshold the individual households (with a different number of household members) are. Still, the most vulnerable group of households appears to be the household type: single under 65 years of age. This segment has the highest rate of households at the risk of poverty and also with the deepest poverty.
Similar is the situation for the segment of households with at least one adult child, which is the most numer-ous and suffers the third highest poverty. Attention should be also paid to the segments of households, which do not show a high percentage of households at the risk of poverty, but their poverty is deep, e.g. two adults both under 65 years old (the depth of poverty in 2008 was 0.74) or two adults with one child (0.76 in 2004). From these data, we can derive the income deficit, necessary for these households to reach at least the threshold of poverty risk. The results may be useful in developing the family social policy.
[image:6.595.66.532.84.221.2]Segmentation by other criteria such as the social group (Stávková et al. 2011) leads to an interesting finding in the group of “unemployed”. The ratio of
Table 5. characteristics of poverty for different social groups of households at risk of poverty
Type of household by social group
2005 2008
households at risk of poverty
(%)
average household
income
depth of poverty coefficient
households at risk of poverty
(%)
average household
income
depth of poverty coefficient
Employed 3.07 5 503 0.87 2.28 6 529 0.85
Self-employed 5.12 5 081 0.81 5.52 6 215 0.81
Pensioner 4.99 5 586 0.89 5.84 6 730 0.88
Unemployed 66.41 4 385 0.70 52.99 4 836 0.63
other 55.13 4 340 0.69 43.20 5 498 0.72
Source: calculations of authors
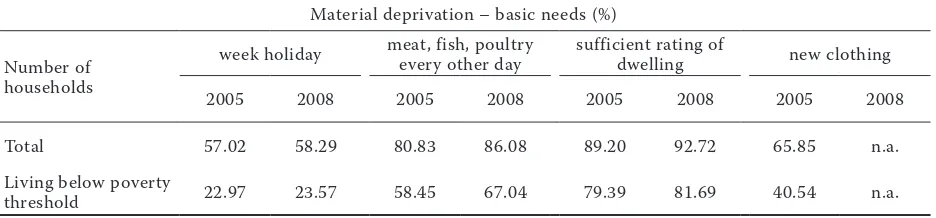
Table 6. indicator of material deprivation – basic needs
Material deprivation – basic needs (%)
number of households
week holiday meat, fish, poultry every other day sufficient rating of dwelling new clothing
2005 2008 2005 2008 2005 2008 2005 2008
Total 57.02 58.29 80.83 86.08 89.20 92.72 65.85 n.a. Living below poverty
threshold 22.97 23.57 58.45 67.04 79.39 81.69 40.54 n.a.
n.a. = in 2008 not collected (data not available)
[image:6.595.65.533.621.730.2]households at the risk of poverty decreased by more than 13% (66.41 to 52.99) in the 4-year reporting period, the group of self-employed (entrepreneurs) experi-enced only a slight, but still an increase in the ratio of households at the risk of poverty (5.12 to 5.52).
From the analysis of households at the risk of pov-erty, broken down by their belonging to a particular social group, we can say that the best achievability to reach the threshold seems to be for a relatively low percentage of pensioners (approximately 5% at the risk of poverty with the depth of poverty 0.8), the deepest poverty is shown by the unemployed and the segment of households classified as others. The indicator of poverty depth corrects the positive trend of a decreasing number of households at the risk of poverty in the category unemployed, as those who remain “poor” are even poorer.
Another indicator reflecting (besides the income) the material situation of households, the consumption and the quality of life is material deprivation1. out of a number of indicators, there was used only one for the illustration – the basic needs (Table 6).
The selected indicator of material deprivation – ba-sic needs – is used in the paper in order to demonstrate the complexity of the problem of not only income, but also the consumption and material situation of the households and particularly the households’
perception of their situation, or the urge to change this situation. Therefore, Table 6 includes not only households at the risk of poverty, suggesting how they can (or want) enjoy the benefits characterized by four indicators of material deprivation – the ba-sic needs. About one quarter of the households at the risk of poverty can afford a one-week annual holiday away from home, whereas only one half of the families not suffering financially can enjoy this one-week vacation. The difference in the number of households (at risk of poverty × others) who can af-ford the selected food is reduced to about 20%, the difference is even smaller for the item: the adequate heating of a dwelling.
if the households perceive their income and material situation negatively, there is a dissatisfaction that may even lead to social exclusion. Therefore, the objective measurement of income and expenditure situation of households must be accompanied by an investi-gation of how the situation is subjectively perceived by the households, especially for the households at the risk of poverty.
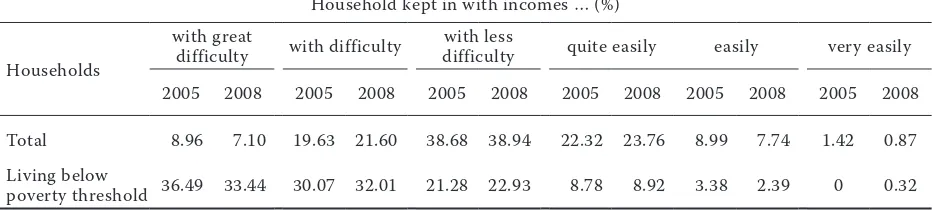
The perception of the financial situation of house-holds according to the SiLc data collection in 2005 and 2008 is shown in Table 7.
[image:7.595.64.533.93.198.2]1Material deprivation refers to the inability for individuals or households to afford those consumption goods and activi-ties that are typical in the society at the given point of time, irrespective of the people’s preferences with respect to these items (oEcD 2007). read more at: http://epp.eurostat.ec.europa.eu/statistics_explained/index.php/glossary: Material_deprivation
Table 7. Self-assessment of the household financial situation
household kept in with incomes … (%)
households
with great
difficulty with difficulty difficultywith less quite easily easily very easily
2005 2008 2005 2008 2005 2008 2005 2008 2005 2008 2005 2008
Total 8.96 7.10 19.63 21.60 38.68 38.94 22.32 23.76 8.99 7.74 1.42 0.87
Living below
poverty threshold 36.49 33.44 30.07 32.01 21.28 22.93 8.78 8.92 3.38 2.39 0 0.32
[image:7.595.306.530.610.679.2]Source: SiLc, calculations of authors
Table 8. objective findings about the financial situation (in %)
Lower class Middle class Upper class
2005 11 69 20
2008 11 68 21
Source: SiLc, calculations of authors
Table 9. Subjective perception of the household financial situation (%)
With great difficulty or with difficulty
With less difficulty or
quite easily
Easily or very easily
2005 28.59 61.00 10.41 2008 28.70 62.70 8.61
[image:7.595.62.291.628.680.2]it is interesting to compare the objective findings with the subjective perception of poverty.
it is generally assumed that the first 20% of house-holds ranked by the volume of income can be referred to as the “low class”, followed by the “middle class” and the last 20% of households with the highest income is referred to as the “upper class”.
According to the survey results of the objective income situation, the distribution of social “classes” is obvious from Table 8. Differences in the analyzed years 2005 and 2008 are not recorded, but the lower class (based on the findings about the volume of income) is only 11% of the total.
The same set of households, which has been sur-veyed about their income situation, was also asked to answer a question of how they meet the spending needs of the household, whether with a great difficulty or witha less difficulty or very easily. The Table 9 presents the results of how the household manages do deal with the necessary expenditures.
To support the informative value of the results of the investigation of the subjective perception of the financial situation based on the SiLc data, we provide the results of the Public opinion research centre of the institute of Sociology of the Academy of Sciences of the czech republic from october 2008 (Table 10). if we combine the semantically close categories, the results do not show any significant differences.
To support the investigation demandingness of the subjective perception of income, expenditure and material situation of households, drawing con-clusions from these investigations, we provide the results of the same investigation, which used other means of expression, i.e. concepts such as poverty and wealth. The results of the survey on perceptions of the poverty level or the degree of wealth are shown in Table 11.
Traditionally, almost two thirds of households consider themselves neither rich or poor, 28% of them consider themselves as poor and 3% as very poor. none of the households considers themselves as very rich, while 6% of the households identified themselves as rather rich.
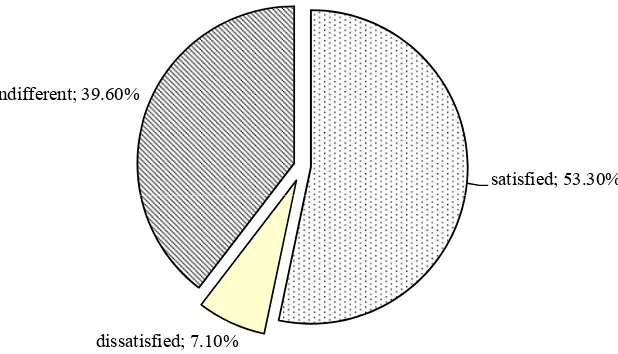
The coBErEn2 project collected and processed a big volume of secondary data, including an ex-tensive survey of the opinion on the life style, the satisfaction with the financial, material conditions of households, satisfaction with health care, education, etc. in all the EU countries. one of the questions focused on the satisfaction with life, and the czech republic ranked on 14th position in Europe. over one half of the czech population is satisfied with its life (regardless of financial situation), 40% marked the indifferent opinion and only 7% are dissatisfied with life (Figure 2).
CONCLUSIONS
The conducted analyses basically summarize the results of the EU SiLc 2005–2008. The sample of households, which provided the initial information on the amount of income, also includes the identi-fication of the sociodemographic nature, allowing a more detailed investigation of the selected groups of households.
[image:8.595.65.529.87.128.2]An average income per one household member dur-ing the 4-year reportdur-ing period increased by 19.5%, in 2008, the average income D-EKV reached 14 627 czK. The median, which is an additional variable of the average values, characterizes the distribution of values within a set, rose by 21.9%, which is almost neg-ligible, but yet a positive trend, a faster growth in the group of low-income households. At-risk-of-poverty
Table 11. Subjective perception of poverty (%)
Very poor rather poor neither rich nor poor rather rich Very rich Don’t know
3 25 65 6 0 1
[image:8.595.64.530.673.715.2]Source: Public opinion research centre of the institute of Sociology Table 10. how households cope with their incomes (%)
With great
difficulty With difficulty rather with difficulty rather easily Easily Very easily Don’t know
6 13 35 33 9 1 3
Source: Public opinion research centre of the institute of Sociology
rate of the total declined by 1.2% during the report-ing 4-year period. The investigation of the Federal Statistical office in Wiesbaden conducted in 2010 and published on January 26, 2011, shows that the rate of households at the risk of poverty is the lowest in the czech republic (Parlamentní listy 2011).
A study of income differentiation of households is often associated with the development of macroeco-nomic indicators. it will, therefore, be interesting to see how and with what time lag will the decline in gDP in 2006–2009 and a sharp rise in unemployment in 2009 (from 2005 to 2008 decline) affect the income differentiation of households (Kabát 2007).
From the presented Lorenz curve, we can derive that the income diversification is relatively uniform, 10% of the households with the lowest incomes pumped out of the total volume of about 4%, three income deciles with the highest incomes show the most sig-nificant deviation from the ideal distribution, showing the fact that 10% of the households with the highest incomes draw almost 20% of the total revenues. The gini coefficient as a commonly used indicator of income inequality reaches the value of 0.25 in 2005 and 0.23 in 2008 and shows a decline in the already relatively equal income differentiation.
in general, the authors draw attention to the in-formation from the popular source; especially the widening inequality of the property ownership is a dynamic trend of the present society. The results of analyses of the income situation of households do
not record that and it will be interesting to follow the results of such analyses in the coming years, es-pecially with regard to the impact of the economic crisis in society.
As a valuable information resulting from the con-ducted analyses, there can be considered the income differentiation of households of different types of households, where the sorting parameter was belong-ing to the particular social group household category or the number of members per household. The results show that the long-term poverty threatens the most the single-parent households (with at least one adult and one child), then the older person households and the third most threatened household category are the households with more than three children.
The results are good arguments for the social policy development and maintaining sustainable consumption. The analysis of the income situation of households at the risk of poverty is more reveal-ing with the use of the depth of poverty indicators for the various household types, which point to a diverse income deficit. Evidently there are different types of households with a relatively higher at-risk-of-poverty rate, but a relatively low income deficit (with incomes just below the at-the-risk-of-poverty threshold). on the other hand, there are groups of households where only a small number of them is threatened by poverty, but their income is far below the at-the-risk-of-poverty threshold.
satisfied; 53.30% indifferent; 39.60%
[image:9.595.135.444.69.246.2]dissatisfied; 7.10%
Figure 2. Satisfaction in life in the czech republic
Source: EVS (2008)
it was an intention of this paper to focus on the issues of income resources, not the share of social transfers in the household income. Exploitation of these analy-ses for the provision of social transfers to the needy target groups can contribute to the improvement of the subjective perception of the financial situation of households, which is an important part of the as-sessment of the living conditions of people.
REFERENCES
Boháčová T. (2007): Materiální deprivace a chudoba domác-ností v Čr (Material Deprivation and Poverty of czech households). Available at http://is.muni.cz/th/102755/ fss_b/BKL-Bohacova_102755.doc (accessed november 2010).
halleröd, B, Larsson, D. (2008): Poverty, welfare problems and social exclusion. international Journal of Social welfare, 17: 15–25.
Kabát L. (2007): Příjmová situácia a životné podmienky obyvateľstva Slovenska podľa štatistiky SiLc (income Situation and Living Situation in Slovakia). Slovenská štatistika a demografia, 3: 36 p.
Madeiros M. (2006): The rich and the poor: The construc-tion of an affluence line from the poverty line. Social indicators research, 78: 1–18.
oEcD (2007). Society at a glance: oEcD Social indicators, 2006 Edition. oEcD, Paris. Available at http://photo. kathimerini.gr/xtra/files/Meletes/pdf/Mel090307.pdf Parlamentní listy (Parliamentary Journal) (2011). Dobrá
zpráva: Česko má nejméně chudých v Evropě (good
news: czech republic has the lowest rate of poor in Europe) Available at http://www.parlamentnilisty.cz/ arena/monitor/187341.aspx (accessed January 2011). Proctor B.D., Dalaker J. (2003): Poverty in the United States:
2002. current Population reports, Series P60-222. US census Bureau, Washington, Dc.
Sirovátka T., Mareš P. (2009): Poverty, deprivation and social exclusion: The unemployed and the working poor. in: Fournier M.c., Mercier ch.S. (eds.): Economics of Employment and Unemployment. 1st ed. nova Science Publishers, new York, pp. 1–32; iSBn 978-1-60456-741-0.
Stávková J., Stejskal L., nagyová L. (2011): income differ-entiation of households in the cr. Acta Universitatis Agriculturae et Silviculturae Mendelianae Brunensis, 59: 26–52.
Stejskal L., Pustinová J., Stávková J. (2010): Příjmová situ-ace domácností Čr podle statistiky EU SiLc (income Situation of czech households in accordance with EU SiLc). Acta Universitatis Agriculturae et Silviculturae Mendelianae Brunensis: Acta of Mendel University of Agriculture and Forestry Brno, 58: 251–259.
Stejskal L., Stávková J. (2010) Living conditions of czech farmers according to EU statistics on income. Agricul-tural Economics – czech, 56: 310–316.
Townsend P. et al. (1988): health and Deprivation: inequal-ity and the north. croom helm, London.
Woodward A., Kohli M (2001): European Societies: inclu-sions/Exclusions? in: Woodward A., Kohli M. (eds.): in-clusion and Exin-clusion in European Societies. routledge, London, pp. 1–17.
Arrived on 7th February 2011
Contact address: