Munich Personal RePEc Archive
An Inflation Hedging Strategy with
Commodities: A Core Driven Global
Macro
Fulli-Lemaire, Nicolas
University of Paris 2, Amundi AM
26 March 2012
An Inflation Hedging Strategy with Commodities:
A Core Driven Global Macro
Nicolas Fulli-Lemaire1
Amundi University of Paris II
Third Version: 24/01/2013
Published in The Journal of Investment Strategies - Risk
Summer Issue - June 2013, Volume 2 (Number 3).
Abstract
Recent academic studies have shown that since the mid-nineties, the pass-through of exogenous oil shocks into headline inflation has been increasing while the pass through into core inflation seems to have ceased. This paper explores the implications in terms of commodity allocation for inflation hedging portfolios these recent works have paved the way for. We proceed by first evidencing a link between the headline to core inflation spread and tradable commodities. We subsequently intend to exploit this link in two ways: firstly by devising an efficient strategic allocation using core inflation forecasts to determine the commodities’ natural weight in the portfolio as dictated by our macro approach. And secondly by testing a tactical allocation strategy which would time the pass-through cycle to dynamically determine the optimal share of commodities in the allocation.
Keywords: Inflation Hedging, Portfolio Allocation, Commodities, Core Inflation, Global
Macro, Inflation Pass-through, Arbitrage Pricing, Strategic Allocation, Tactical Allocation
JEL classification: C58, C63, E3, G11, Q02, N1
1
This document presents the ideas and views of the author only and does not reflect Amundi AM’s opinion in any way. It does not constitute investment advice and is for information purpose only.
Plan
Introduc 1. Shif 1.1. 1.2. 1.3. 2. Fina
2.1. 2.2. 2.3. 3. Em
3.1. 3.2. Conclusi Referenc List of Fi List of Ta
ction ... fting paradig
The macro The vanish The case fo ancial asset
Historic co Pricing imp Co‐integra pirical estim Strategical Tactically a ion ... ces ... igures ... ables ...
... gm, vanishin oeconomic lit hing pass‐thr
or a commod consequenc orrelations an
plications of tion analysis mations of all ly allocating allocating co ... ... ... ...
... ng pass‐throu
terature of th ough... dity allocatio ces of the shi nd volatility a the pass‐thr s as a predict location stra commoditie mmodities in ... ... ... ...
... ugh and allo he shifting p ... on in asset lia
ifting macro analysis ... rough ... tor of long‐te ategies ... es in inflation
n inflation he ... ... ... ...
... ocation issue paradigm ... ... ability manag o‐structure ..
... ... erm trends .. ... n hedging po edging portf ... ... ... ...
... es ... ... ... gement ... ... ... ... ... ... ortfolios ...
olios ... ... ... ... ... ... ... ... ... ... ... ... ... ... ... ... ... ... ... ... ...
... 3
... 5
... 5
... 6
... 7
... 8
... 8
... 10
... 12
... 15
... 15
... 18
... 22
... 24
... 27
Introduction
The intricate relationship between crude oil prices and macroeconomic variables, inflation in particular, has been extensively studied in the last decade. Following the seminal work of (Blanchard & Gali, 2007), it has been commonly accepted that the pass-through of exogenous oil price shocks to output and inflation has greatly diminished since the nineties, thereby severely reducing their role as drivers of long-term inflation and economic crisis. Moreover, (Clark & Terry, 2010) and (van den Noord & André, 2007) have shown that the transmission of oil price shocks into core inflation has now basically ceased, thereby greatly differentiating the behavior of core and headline inflation. Yet, to the best of our knowledge, noresearch paper has focused precisely on the implications in terms of commodity allocation for inflation hedging portfolio management that this macroeconomic shift implies.
The question of the optimal allocation of commodities in an inflation hedging portfolio has been central to academic research since the end of the era of cheap oil in the seventies in the United States. The first article directly addressing this issue was (Bodie & Rosansky, 1980) which advocates the inclusion of commodities as natural inflation hedges. Commodities can be included in a standard portfolio optimization framework for two main reasons: firstly, commodities have offered potentially strong nominal returns and are a source of performance enhancement on a risk-adjusted basis as they are potentially decorrelated from other standard asset classes. Secondly, commodities seem to offer interesting inflation hedging properties. Yet, commodities are cyclical and can suffer from very sharp downturns, of magnitudes that greatly dwarf inflation variations, thus rendering their inclusion into inflation hedging portfolios non-trivial.
1.
Shifting paradigm, vanishing pass-through and allocation issues
1.1. The macroeconomic literature of the shifting paradigm
One of the great macroeconomic paradigms of the twentieth century was that exogenous oil shocks were harbingers of macroeconomic chaos in the form of surging inflation, restrictive monetary policies and severe drop in output. Collective memories of the two major oil shocks in the seventies largely fed into this. However, a recent stream of literature has challenged this assumption on the basis of new evidence pointing to a much reduced role for oil price shocks in terms of being a generator of macroeconomic volatility. The seminal article of (Blanchard & Gali, 2007) completes this literature by trying to measure and explain the diminishing macroeconomic impact of oil shocks since the eighties as compared to the seventies. Using a structural vector autoregressive (SVAR) model, they estimate impulse response functions (IRF) to exogenous oil price shocks. Their rolling timeframe estimation results point at a clear reduction in the impact of shocks since the mid-eighties. In a later paper, (Blanchard & Riggi, 2009) estimated a simpler new-Keynesian model derived from these observations aiming at explaining the causes of the shift. The authors evaluate and model three possible explanations found in the literature: a reduction in the energy intensity of output, a relaxation of the real wage rigidity or the effectiveness of new central bank monetary policies. These hypotheses can in turn be explained by their respective literature:
The decline in energy intensity of US output measured by (Wing, 2008) could be the result of both intra-industries’ energy efficiency improvement and inter-industries’ sectorial reorientation of productive capacities toward less energy intensive ones such as services.
The vanishing real wage rigidity is documented in (Card & Hyslop, 1997) which showed that between the seventies and the eighties, an increasing number of employees were not receiving inflation neutralizing raises, therefore upholding the belief that inflation “greases the wheels of the labor market” by eroding in time the downward nominal wage rigidity.
The increased effectiveness of central bank monetary policies has been largely attributed to the successes of inflation targeting monetary policies introduced in the early nineties. By also using an SVAR to calibrate a general equilibrium model, (Boivin & Giannoni, 2006) have shown that compared to the eighties, monetary policy exogenous shocks seem to have a much lesser impact in terms of volatility of inflation and output. Also, the reduced size and increased frequency of monetary shocks seem to point to a more proactive and efficient policy response. All of these elements tend to demonstrate an enhanced credibility of central banks at achieving price stability.
price shocks are passed on to the energy component of the CPI and, according to their estimate, account for up to sixty percent of its volatility. This brings us to our second point: the vanishing pass-through of energy price shocks from headline to core prices.
1.2. The vanishing pass-through
Exogenous oil shocks are, by conventional wisdom, the main drivers of CPI inflation: this passage of changes in the prices of energy to the general price level in the economy as measured by the CPI has been dubbed the inflation pass-through of energy prices. While it was indisputably fairly large until the late seventies, it is then quite amusing as (Hooker, 1999) noted that the very nature of this close relationship broke down at the very moment when (Hamilton, 1983) published his landmark paper on the link between oil prices and macroeconomic variables.
There is an extensive body of literature that delves into this vanishing pass-through and provides a variety of possible explanations and ways to measure it: (De Gregorio, Landerretche, & Neilson, 2007) extend the (Blanchard & Gali, 2007) paper by incorporating a much larger set of 34 countries, including emerging ones and estimate the pass-through using IRFs derived from an SVAR analysis and an enhanced Philips curve with oil parameters. They conclude that it has fallen significantly since the mid-seventies for all developed countries and, to a smaller extent, in emerging markets. This reduction has been the result of both a decline in the economic intensity of oil use and the impact of favorable exchange rates as the latest oil shock has been demand-driven (therefore resulting in an appreciation of exporting countries’ currencies). Both of these new arguments still fail to explain a significant part of the reduction of the pass-through as the authors conclude. Using an equivalent methodology, (Chen, 2009) points out the degree of trade openness as the only statistically significant additional explanatory variable included in his analysis, but still fails to explain a large part of the pass-through decline.
of energy price variations to core inflation in the US. They estimate that since approximately 1975, core CPI in the US had gradually become less responsive to changes in energy prices. By 1985, the pass-through had been reduced to nil.
1.3. The case for a commodity allocation in asset liability management
Commodities have been exchanged in spot and futures format since immemorial times and were most certainly the subject of the first derivative trades. Yet, they have only recently attracted the attention of portfolio managers as a strategic investment class. In fact, the first meaningful articles on the issue of incorporating commodities into an investment portfolio are contemporaneous with the first major oil shocks since the Second World War and the surging inflation that accompanied them. Back then, they had already been studied in conjunction with inflation: in the early eighties, (Greer, 1978), (Bodie & Rosansky, 1980) and (Bodie Z. , 1983) explore their inflation hedging potential. Since then, the number of articles exploring the potential of commodities as an alternative asset class both for performance enhancement and liability management is simply astonishing. Commodities’ impressively long bull run in the previous decade certainly helped as the contrarians showed (Daskalaki & Skiadopoulos, 2011) in their out of sample analysis.
The benefits of a commodity allocation are usually described as investing in an asset class with equity-like returns and low correlation with traditional equity-bond-cash portfolios (Conover M. C., Jensen, Johnson, & Mercer, 2010). The question of the correlation of this specific asset class to other more conventional ones has been studied in depth by (Chong & Miffre, 2010). However, it is regrettable that linkers were excluded from this analysis even though there is an obvious historical depth availability issue. More specifically, the potential of commodities to hedge against unexpected inflation has been explored in (Attié & Roache, 2009) even though (Erb & Harvey, 2006) note that a specific distinction should be made between commodities as a whole and commodity indices which experience a fairly different kind of return and correlation profile. After the energy component, the second most studied commodity sub-index has been precious metals which also exhibit interesting inflation hedging potential in times of severe downturn and “flight to safety” phenomenon (Conover C. M., Jensen, Johnson, & Mercer, 2009). Lastly, the tactical value of commodities in a general portfolio optimization framework was shown in (Fuertes, Miffre, & Rallis, 2010) to name just one of the many articles on this subject.
macroec of the co
To implicat inflation Roache, after wh through mention versus h
2.
2. A assessed headline used US [image:9.595.133.465.544.743.2]Saint L Consum with its Items” Return inflation hereafte Figure 1 conomic tac ommodity a
o the best o tions of th n hedged po
, 2009), com hich their he h of commo
ned academ headline inf
.
Finan
.1. Histor
A first impre d by calcul e inflation, S core infla
Louis Feder mers, All Ite
s headline (CPIAUCN
Commodity
n as the ben er are index
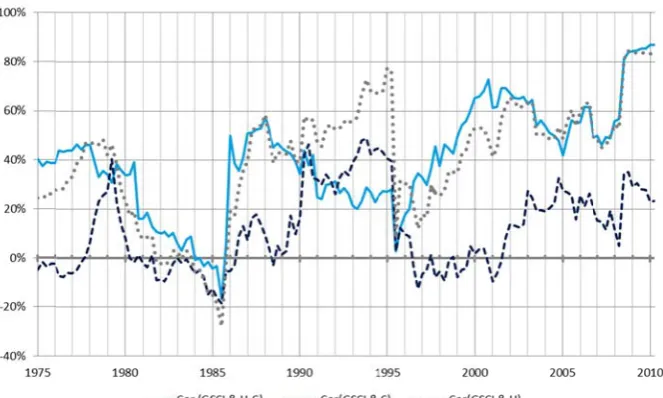
: Rolling time
ctical alloca allocation o
of our know e commodi ortfolios. Y mmodities d edging pote
dity price i mic research flation cycle
ncial asset
ric correlat
ession of th lating the c core inflati ation as me
ral Reserve ems Less F
counterpart NS). Investa
y Index (G nchmark m ed on unadj
e frame corre
ation can b f (Jensen, J
wledge, no ities-to-infla Yet, if we ar do offer a re ntial seems nflation to h into the p es as an indi
t conseque
tions and v
he impact o correlation
ion and the asured by t
e in the fo
Food & Ene
t, the “Con
able commo GSCI-TR). W made of US
justed CPI r
elation analy
e found for Johnson, &
research h ation pass-re to believ elatively go s to graduall core prices pass-through
icator for th
ences of t
volatility an
of the pass between a e difference
the Bureau
orm of the
ergy, Not S nsumer Pric
odities wer We chose
Treasury In
references.
sis between c
r example i Mercer, 200
has focused through pre ve (Brière & od inflation ly wane. Co ? Consideri h, could we he timing of
the shiftin
nalysis
-through in commodity e between th
of Labor S
“Consume Seasonally ce Index fo
e modeled to use sea
Inflation Pro
commodities a
n the long-02).
specificall eviously ex & Signori, 2 n hedge up t ould this be ing for exam e envisage l f the allocati
ng
macro-n terms of a y index on he two on t
Statistics an
r Price Ind Adjusted” (
or All Urba
by the Go
asonally un
otected Sec
and inflation
-short macr
ly on the al xposed in t 2010) and ( to a certain
a result of t mple the pr
looking at ion?
-structure
asset prices n the one h
the other h nd publishe
dex for Al
(CPILFENS
an Consum oldman Sac
nadjusted se
curities (TIP
n indices o-timing llocation terms of (Attié & horizon, the pass-reviously the core
e
s can be hand and and. We d by the
We plotted in Figure 1 those three measures for quarterly data over the 1975-2010 period using a 20-quarter rolling time frame and using the GSCI-TR. From this first rough insight, we can grasp that the correlation between the commodity index and core inflation (dark blue dashed line) is on average quite low and unstable through time. The correlation between headline inflation and the commodity index (grey pointed line) is also unstable but secularly increasing over times, even though it is subject to brutal regime changes in terms of correlation levels. We can speculate that they appear to be synchronous with severe macro or oil specific events (or both) such as the 1985-86 counter oil shock (Mabro, 1987) or the US 1992 recession (Hamilton, 2011). The correlation between the commodity index and the volatile fraction of the inflation index a.k.a. the headline vs. core spread (solid light blue line) has more or less been continuously rising since the mid-eighties and has risen above 80% in recent years. Its trend has been so closely linked to its headline counterpart that it has even gone up to the point of being indistinguishable from it in the last ten years.
Consistently with prior literature, our computation exhibits a new correlation regime that began in the nineties: core inflation appears weakly correlated with commodities but is somewhat upward trending. Headline inflation’s correlation with commodities appears very strong and its evolution has been matched by the correlation between the inflation spread and commodities. But how will it evolve going forward? Is it a transient state as a result of the current market turmoil or is it a stable long term-trend? The last subsections will delve into this issue with a co-integration analysis to try to answer this point. The previously exposed literature gave an economic explanation for the link between spot oil prices and headline inflation or for the absence of it when it comes to core inflation and our simple correlation analysis does seem to support an investment strategy. We will therefore explore the possibilities in terms of inflation hedging strategies that this new framework enables in the next subsection.
Table 1: CI vs. HI quarterly volatility reduction.
Consistently with, and in addition to, the previously exposed correlation arguments, we can measure a shift in terms of absolute volatility levels: while the ratio between the HI and the CI volatility used to be minimal at times when the headline-to-core inflation pass-through was high (-13%), it widened dramatically after the pass-through ceased to operate (-58%). Also, the average difference between both indices which used to be completely insignificant at 1 bp per annum increased to around 10 bp per annum, which is still fairly small.
Mean Std. HI CI
1970‐2010 0.02% 2.15% 3.40% 2.75% ‐19.15%
1970‐1990 0.01% 1.86% 3.22% 2.78% ‐13.49%
1990‐2010 0.03% 2.39% 2.91% 1.70% ‐41.82%
2000‐2010 0.10% 3.15% 3.79% 1.58% ‐58.25%
2.
[image:11.595.111.481.201.421.2]Bu headline a strateg try to ex
Figure 2 Sh would s initially between with the low. Th
Either t
therefor and eve the CI indicato commod commod would b Or the remains should scenario correlat .2. Pricing
uilding on t e-to-core in gic approac xplain our m
: Year on yea
hould an ex spike contem y remain sta
n the returns e commodit hen, after a c
the pass-th
re diminishi entually ove and the HI or for the al dities, whil dities in the be more pro
pass-throug
s muted. If t eventually o were true tion to com
g implicati
the macroec nflation pass
ch to our pr model by an
ar headline m
xogenous co mporaneous able, regard s on the CI ty index, w certain lag,
rough does
ing the hed ershoots it (F
I (both in l llocation: du
e we should e allocation one to hedgi
gh doesn’t
this were th mean reve , then the j mmodities) w
ions of the
conomic ar s-through sh roposed cor nalyzing the
minus core inf
ommodity p sly with the dless of the
and the HI while the co two scenari
s operate a ging potent Figure 2). I evel and in uring the fir d gradually should gra ng the CI as
operate an he case, the ert towards oint evoluti would also e pass-thro rguments pr hould serve re-driven co e forecasted
flation over f
price shock e commodit e current le
indices sho rrelation of ios are poss
and the gen tial of comm If this scena n correlatio
rst part of t short the p adually be s s it become
nd the CI CI would re
CI (Gelos ion between be a differ
ough
reviously ex as a guide ommodity a response to
forty years
k hit the eco ties index w evel of the ould therefor f the CI to
ible:
neral price modities as ario were tru on to comm
the cycle, w position tow substituted f s dominant
response to emain – cet
& Ustyugo n the CI an rent indicat
xposed, the to choose b allocation. T
o a commod
onomy, hea while core in
pass-throu re initially b the same in
level in th the CI catc ue, then the modities) sh
we should be wards the en
for other kin towards the
o the spikin teris paribus
ova, 2012). nd the HI (b tor for the
current sta between a ta This subsect dity price sh
adline inflat nflation (CI ugh. The di be highly co ndex should
he economy ches up wit e evolution hould be a
e relatively nd of the cy nds of asse e end of the
ng of comm s – flat whil
. If this alt both in leve allocation:
te of the actical or tion will hock. tion (HI) I) should ifference orrelated d remain y adapts, h the HI
between dynamic long on ycle. The ts which e cycle. modities le the HI ternative el and in
HI-minus-CI correlation with commodities should remain high and stable throughout the cycle. If our objective is primarily an inflation hedge, then we should calibrate a strategic commodity allocation to correspond to the forecasted residual spread between the CI and the HI.
Therefore, to make the better use of the informational content of our two inflation indices in order to enhance the commodity allocation of our inflation protected portfolio: if the pass-through does operate, we should adopt a tactical allocation technique, whereas if it doesn’t, we should use a strategic allocation approach. We shall evaluate those two options separately in the next sections.
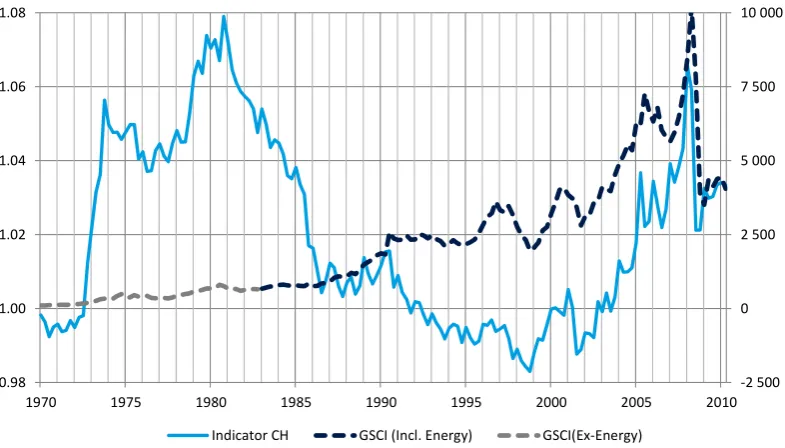
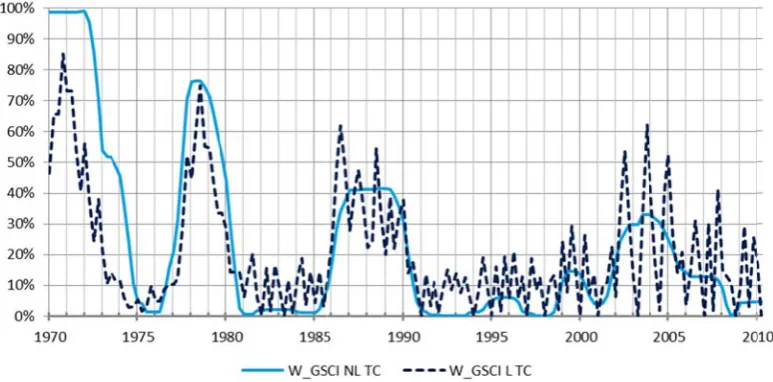
[image:12.595.102.495.347.571.2]In accordance with our prior hypothesis, we compute the CH indicator as the integrated difference between the quarterly spread between the CI and the HI. We obtain Figure 3 by superimposing with a different axis the contemporaneous evolution of the CH indicator (light blue continuous line) and the GSCI_TR index (dark blue dashed line). We also separately represented the GSCI_TR prior to the inclusion of energy commodities in December 1982 when their liquidity was deemed sufficient (light grey dashed line).
Figure 3: A Comparison of the GSCI TR index and the CH Indicator
As could have been expected from the correlation analysis, there seems to be no clear relation between those two time series up until the late nineties, when there are clear hints of co-movements, if not of an outright cointegration relationship. In fact, considering the methodology employed by the statistical body on the one hand, and the computation of the commodity index, it is not initially obvious that such a relationship could hold. We are de facto comparing a consumer price derived index to a financial market derivative transaction based index, both of which could easily answer to very different drivers: the GSCI_TR could be very sensitive to market manipulation or short-term adjustments, whereas the other index would not as a result of sticky prices in non-financial markets. This kind of argument could also offer a tentative alternative explanation for the weak relationship earlier on in the period: at this moment in time, commodities financial markets were much less developed, more
‐2 500 0 2 500 5 000 7 500 10 000
0.98 1.00 1.02 1.04 1.06 1.08
1970 1975 1980 1985 1990 1995 2000 2005 2010
illiquid and trading costs were extremely high. Such events would put a serious drag on the returns of the GSCI_TR during much of the seventies and eighties whereas the consumer price index obviously remained untouched by such market-trading considerations.
2.3. Cointegration analysis as a predictor of long-term trends
As any investor knows or should know, “past performance is no guarantee of future results”. And indeed, even though we have constructed an indicator designed to exhibit strong historic empirical correlation with commodities in the current macro-financial environment, we have not provided any indisputable proof that would ensure the persistence of the correlation through time. And there is clearly none because that would be equivalent to assuming that the headline-to-core inflation pass-through will remain muted forever. Still, we could partially reinforce our econometric assumptions by running a cointegration test to evaluate the potential for shifts in the current structure or its probable persistence, which a strong cointegration relation would favor. Moreover, it would be interesting to see how strongly commodities related to the indicator in the past, especially at times when the pass-through was significantly more active and how consistent we are with the macroeconomic literature. It would be especially important if we are to fruitfully exploit the current correlation structure while being prepared for a correlation-regime change.
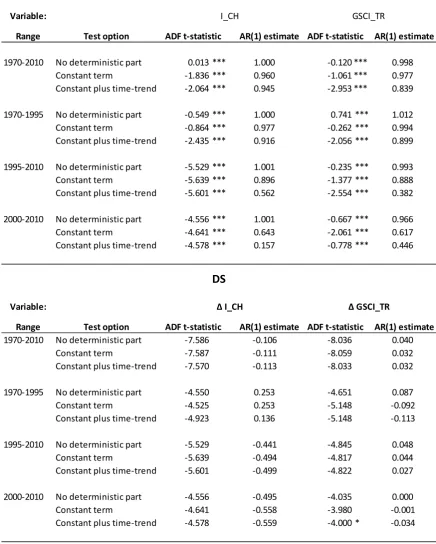
Using the cointegration framework developed by (Granger & Newbold, 1974), we explore the possibility of a spurious regression by testing for cointegration using the (Johansen, 1988) test after having performed an integration test using (Said & Dickey, 1984). Since there are multiple possible structural breakpoints in the correlation structure, we will perform the test using several timeframes as before. Firstly by testing over the entire sample, then on several sub-samples which represent our areas of interest. The choice of those breakpoints is derived from the pass-through literature, not by an endogenous selection like (Andrews, 1993). We thus broke-up the period in the following manner: A first sample-period comprising the seventies and the eighties which were characterized by a high pass-through regime. A second one ranging from the nineties to the present day representing the low pass-through era and a final sample-period including only the last decade which corresponds to the extreme correlation and high volatility period previously identified.
Table 2: ADF tests for unit root
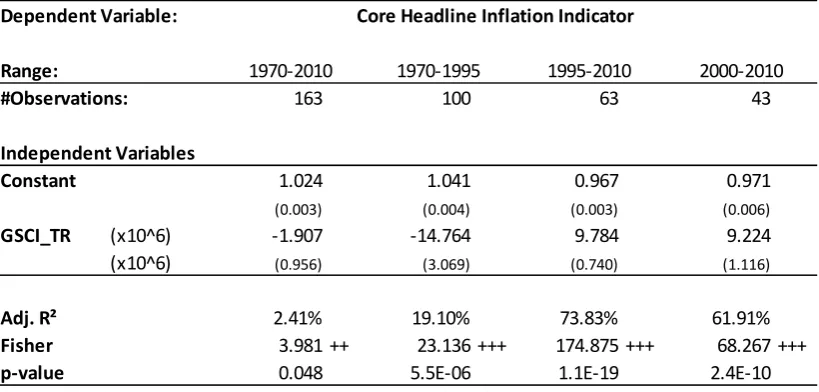
We can therefore perform the regression analysis and test for spurious regressions using the Johansen Test as is presented in Table 3. As expected, the regression analysis yields a low Adjusted R² for the overall period studied and for the 1970-1995 period. However, it gives a higher Adjusted R² for the 1995-2010 and the 2000-2010 period. The last of the two periods’
Range Test option AR(1) estimate AR(1) estimate
1970‐2010 No deterministic part 0.013 *** 1.000 ‐0.120 *** 0.998
Constant term ‐1.836 *** 0.960 ‐1.061 *** 0.977
Constant plus time‐trend ‐2.064 *** 0.945 ‐2.953 *** 0.839
1970‐1995 No deterministic part ‐0.549 *** 1.000 0.741 *** 1.012
Constant term ‐0.864 *** 0.977 ‐0.262 *** 0.994
Constant plus time‐trend ‐2.435 *** 0.916 ‐2.056 *** 0.899
1995‐2010 No deterministic part ‐5.529 *** 1.001 ‐0.235 *** 0.993
Constant term ‐5.639 *** 0.896 ‐1.377 *** 0.888
Constant plus time‐trend ‐5.601 *** 0.562 ‐2.554 *** 0.382
2000‐2010 No deterministic part ‐4.556 *** 1.001 ‐0.667 *** 0.966
Constant term ‐4.641 *** 0.643 ‐2.061 *** 0.617
Constant plus time‐trend ‐4.578 *** 0.157 ‐0.778 *** 0.446
Range Test option AR(1) estimate AR(1) estimate
1970‐2010 No deterministic part ‐7.586 ‐0.106 ‐8.036 0.040
Constant term ‐7.587 ‐0.111 ‐8.059 0.032
Constant plus time‐trend ‐7.570 ‐0.113 ‐8.033 0.032
1970‐1995 No deterministic part ‐4.550 0.253 ‐4.651 0.087
Constant term ‐4.525 0.253 ‐5.148 ‐0.092
Constant plus time‐trend ‐4.923 0.136 ‐5.148 ‐0.113
1995‐2010 No deterministic part ‐5.529 ‐0.441 ‐4.845 0.048
Constant term ‐5.639 ‐0.494 ‐4.817 0.044
Constant plus time‐trend ‐5.601 ‐0.499 ‐4.822 0.027
2000‐2010 No deterministic part ‐4.556 ‐0.495 ‐4.035 0.000
Constant term ‐4.641 ‐0.558 ‐3.980 ‐0.001
Constant plus time‐trend ‐4.578 ‐0.559 ‐4.000 * ‐0.034
Note : */**/*** denotes the significance at the 10%/5%/1% level TS
Variable: Δ I_CH Δ GSCI_TR
ADF t‐statistic ADF t‐statistic
DS
Variable:
ADF t‐statistic ADF t‐statistic
R² is slightly smaller (contrary to our correlation analysis) partly because of the adjustment of the R² to the sample size (which is smaller in the second case). All the regressions are significant to the 99% threshold except for the first one (over the entire 1970-2010 period).
Table 3: Long-run equilibrium and cointegration test results
As expected, the cointegration hypothesis is strongly upheld according to our Johansen Test for the 2000-2010 period while it is strongly rejected for the entire sample period. More precisely, we can reject the cointegration hypothesis for the 1970-2010 period at the 95% level, and we can uphold the hypothesis for the 2000-2010 period at the same level. For both the 1970-1995 and 1995-2010 period, we have weak evidence of cointegration (significant only at the 90% level). We can therefore conclude firstly that according to our study, the cointegration seems to have begun in the early 2000s and is still holding today and that secondly, we have experienced significant regime change over that forty year period. It is consistent with the literature on the macroeconomic model. We should therefore expect our strategic allocation strategy to perform better in a historic backtest for the 2000-2010 timeframe and less so before that. Inversely, we should expect our tactical allocation to outperform in the preceding period and underperform in the more recent period as we will see.
Dependent Variable:
Range:
#Observations: 163 100 63 43
Independent Variables
Constant 1.024 1.041 0.967 0.971
(0.003) (0.004) (0.003) (0.006)
GSCI_TR (x10^6) ‐1.907 ‐14.764 9.784 9.224 (x10^6) (0.956) (3.069) (0.740) (1.116)
Adj. R² 2.41% 19.10% 73.83% 61.91%
Fisher 3.981 ++ 23.136 +++ 174.875 +++ 68.267 +++
p‐value 0.048 5.5E‐06 1.1E‐19 2.4E‐10 Note : +/++/+++ denotes the significance at the 90%/95%/99% level
Johansen Test for constant plus time‐trend:
Statistic Null
Trace r< = 0 20.702 ** 8.863 10.494 10.908
r< = 1 2.645 3.460 * 3.458 * 5.218 **
Eigen r< = 0 18.057 ** 5.403 7.035 5.690
r< = 1 2.645 3.460 * 3.458 * 5.218 **
Core Headline Inflation Indicator
Note : */**/*** denotes the significance at the 90%/95%/99% level using critical values generated using MacKinnon (1994, 1996)
3.
Empirical estimations of allocation strategies
3.1. Strategically allocating commodities in inflation hedging portfolios
Building on the previously mentioned macroeconomic literature on the current absence of pass-through into core inflation of commodity price shocks and its asset pricing implications in terms of asset correlations we briefly explored in the previous section, we aim to formalize the following strategic allocation for commodities:
We have shown that the spread between HI and CI is highly correlated to commodities whereas their correlation to core inflation is negligible. The allocation of commodities in our inflation hedged portfolio should accordingly be targeted at hedging this fraction of the inflation risk. We therefore built a two fund portfolio with a first allocation intended to hedge core inflation, while the second one is aimed at hedging the residual inflation spread. If commodities proved to be a natural investment to hedge the inflation spread, finding a core inflation hedging asset will be more arduous for two reasons: firstly, there is no asset as of today with cash flows linked to core inflation and secondly, core inflation is an economic concept which is very poorly correlated to any tradable security. However, since core inflation displays very low volatility on short to medium horizons, we could envisage a partially unhedged strategy in which we would remain at risk on the core inflation part as forecasts should not be too far off the ex-post realized value because of the low volatility.
We then define the following long-only strategy in which we secure with a nominal bond investment the expected core-inflated value of our investment while remaining at risk on the unexpected core inflation –defined as the difference between ex-post realized and ex-ante forecast– and playing the natural cross-hedging of commodities with the inflation spread to hedge it. We should therefore achieve an extreme event hedging of headline inflation while benefiting from the real rate premium derived from the nominal bond investment.
To perform the backtesting of our proposed strategic allocation we used fixed-income and commodity data obtained from Bloomberg. Inflation data were retrieved from the FRED database. We use forecasted core inflation data either obtained from the Survey of Professional Forecasters (SPF) when it is available or computed using a very conservative hypothesis of stability in level and a term-structure shaped by the headline forward curve when it is not. We use only information available at the time of the investment to avoid “back-trading” or data mining biases. This dataset is available only from 1990 onward, thus impeding us from running a backtesting exercise on the previously identified high-pass-through era.
The zero coupon bond whose maturity matches our target investment one is allocated such that its terminal value equals the expected core-inflated value of our portfolio. Let CI be the forecasted core inflation and , be the zero coupon nominal rate, we can therefore write the fixed income allocation as:
, 11 ,
The residual part of our investment is allocated in commodities and we will assume its performance is equal to that of the GSCI_TR total return index.
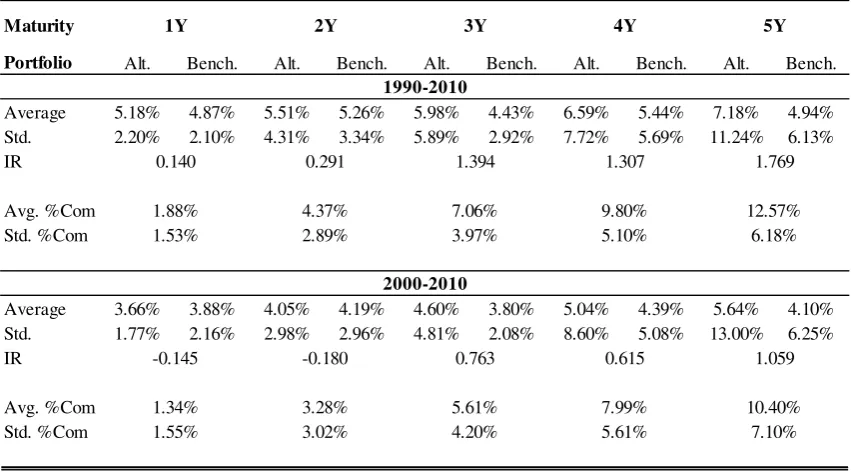
Table 4: A commodity enhanced bond portfolio vs. a linker benchmark:
We will define the benchmark against which we will test our strategy as a pure investment in linkers with a maturity matching that of the investment horizon. The return of the benchmark is therefore equal to the real rate defined at inception plus the accrued headline inflation over the life of the linker and floored at zero to respect TIPS characteristics. Real rates are defined as the difference between the US nominal zero coupon sovereign rate and the breakeven inflation of matching duration. The performance of the strategy compared to its benchmark is presented in Table 3. The Information Ratio (IR) is defined here as the mean of each of the excess returns of our alternative strategy compared to its benchmark divided by the tracking error at each starting point in the sample period. The performances for two target maturities are represented as an illustration in Figure 4. Points are dated at inception.
For maturities above three years, our alternative strategy consistently beats its benchmark in terms of IR and mean absolute return for both time periods studied here, albeit with higher volatility. The strategy’s performance increases with maturity except at the four year horizon, though the difference with the three year is clearly not statistically significant. The underperformance compared to the benchmark in the 2000-2010 period for the one and two year investment horizon is clearly a result of strongly depressed nominal rates: as real rates went negative at times during the height of the crisis it forced our allocation algorithm to select a cash-only portfolio, thereby obviously yielding negative real rates.
Also, contrary to our pass-through hypothesis, the strategy does perform better during the 1990-2000 period than in the 2000-2010 period. This slight underperformance in the last period is probably explained by several factors: Firstly, the severe underperformance of
Portfolio Alt. Bench. Alt. Bench. Alt. Bench. Alt. Bench. Alt. Bench.
Average 5.18% 4.87% 5.51% 5.26% 5.98% 4.43% 6.59% 5.44% 7.18% 4.94%
Std. 2.20% 2.10% 4.31% 3.34% 5.89% 2.92% 7.72% 5.69% 11.24% 6.13%
IR
Avg. %Com Std. %Com
Average 3.66% 3.88% 4.05% 4.19% 4.60% 3.80% 5.04% 4.39% 5.64% 4.10%
Std. 1.77% 2.16% 2.98% 2.96% 4.81% 2.08% 8.60% 5.08% 13.00% 6.25%
IR
Avg. %Com Std. %Com
5Y
Maturity 1Y 2Y 3Y 4Y
1990-2010
0.140 0.291 1.394 1.307 1.769
1.53% 2.89% 3.97% 5.10% 6.18%
1.88% 4.37% 7.06% 9.80% 12.57%
2000-2010
-0.145 -0.180 0.763 0.615 1.059
1.55% 3.02% 4.20% 5.61% 7.10%
nominal bonds contemporaneously with spiking inflation during the 2008-2009 US financial crisis as a result of flight to quality mechanically increased the cash-holding in our alternative portfolios as it was required to match a relatively stable core floor. Secondly, rising headline inflation boosted the returns on the benchmark portfolio which performed overall fairly well. And thirdly, the post-recession commodities forward prices being in strong contango generated high roll-yields which put a serious drag on the GSCI-TR’s post-crisis performances.
Figure 4: Out of sample evaluation of the strategic allocation vs. a benchmark linkers portfolio.
Were such a strategy to be implemented by an asset manager, several fixes could have been implemented: Firstly, a roll-cost enhanced index such as the roll-optimized Rogers RICI
could have been used in place of the GSCI. And secondly, as sovereign real rates went negative, relatively well rated corporates’ cash-securities still yielded positive real-rates and could have been a better choice for our strategy even if we should have adjusted ex-post the performance for the resulting added credit risk. We chose not to go down this path in our paper in order to be consistent with the paper on the index used: enhanced indexes are fairly recent and certainly don’t go as far back as the seventies like the GSCI does.
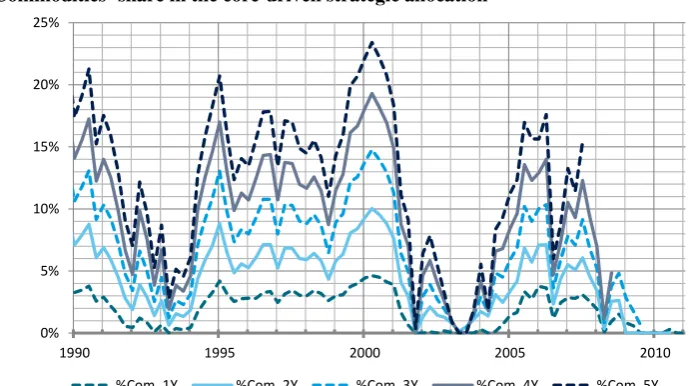
Figure 5: Commodities’ share in the core-driven strategic allocation
0% 2% 4% 6% 8% 10% 12%
1990 1995 2000 2005 2010
Ret 1Y Bench 1Y
0% 2% 4% 6% 8% 10% 12%
1990 1995 2000 2005
Ret 5Y Bench 5Y
0% 5% 10% 15% 20% 25%
1990 1995 2000 2005 2010
[image:18.595.116.461.561.754.2]Yet, overall, our strategic allocation for commodities derived from the pass-through hypothesis seems to be supported by this backtesting exercise though we must point out several important caveats: firstly, commodities have enjoyed an exceptional bull-run through much of the period studied and it certainly biased upward the returns of our strategy by generating abnormal real returns. Secondly, the heredity of the Great Moderation has resulted in decreasing inflation and inflation risk premium throughout the period studied, therefore making realized unexpected inflation negative on average, thus also boosting our strategy’s performance. And thirdly, the absence of available data prior to 1990 impedes the computation of the strategy’s performance during a period of higher pass-through which would have been interesting for comparison purposes. As the US economy recovers, we can expect our alternative strategy to strongly outperform again: there may even be signs of it in the very last points of our graphs which seem to show an upward move. Yet, an exceptionally strong recovery could also awaken the pass-through, with all the consequences that entails.
3.2. Tactically allocating commodities in inflation hedging portfolios
The second potential application for the pass-through literature in terms of portfolio management we would like to explore in this article is the market-timing power for commodities in inflation hedging portfolios of a pass-through indicator: considering our asset pricing hypothesis relative to the pass-through cycle, we could envisage using its estimation in order to time the cycle by going long on commodities when the gap between the HI and the CI widens (increase in the inflation spread) and reduce our exposure to commodities when the gap closes as either the pass-through operates or simply the HI is falling as it mean reverts towards the CI. We will be using low frequency data as there is too much noise below the quarterly frequency to monitor such a slowly evolving macroeconomic variable. The specificity of this tactical allocation approach is that we will try to time commodities’ contribution to inflation regardless of any maximization of their potential nominal or real return.
conside linear) a trading Si CI and allocatio differen otherwi The resu avoid s timing. Figure 6 C yields th in our contemp less clea 1990-20 which o allocatio observa indicato
rably highe allocation c costs curve
ince our wo HI inflatio on indicato nce of the se). We the
ult is presen horting com
: Optimal
ex-omparing o he followin simulated poraneously ar but still a 002 period. our indicato on point o ations are c or should b
er than wha curve obtain (dark blue
orking hypo on is related or (WI) as
HI and the en take the m
nted in Figu mmodities
-post commo
our optimal ng observati
portfolio y with a pea apparent for It then bec ors become of view as
consistent w e more effi
at current t ned (light b dashed line
othesis woul d to the opt follows: the e CI (if po min of WI a
0 ;
ure 7 (conti
when there
dity allocatio
ex-post co ions: the thr
in the ea aking follow
r the three l comes comp es much mo its exploit with our ta ficient at tim
trading cos
blue continu e) in Figure
ld suggest t timal comm e WI equa ositive and and 1 and th
inuous dark
e are due t
on using prop
ommodity a ree clear ep arly seventi wed by a sh
latter episod pletely unc ore volatile table signa actical allo mes when t
ts are on a
uous line) is e 6.
that the diff modity alloc
ls the yearl 0 otherwis he max of th
k blue line) to underper
portional and
allocation w pisodes of h ies, late s arp decreas des of highe
orrelated in e and thus al seems d cation hypo the pass-thr
average). Th s plotted al
ference betw cation, we ly average se) over the he previous
;
. We use th rform accor
non-linear fr
with the WI high allocati eventies an e of our ind er commodi n the 2002-2
becomes le rowned ou othesis wh rough does
he smoothe long with th
ween the ra built the fo of the rati e HI if pos
condition a
hose zero-bo rding to ou
frictions
indicators ion of comm and eighties
dicator. It is dity allocatio
2010 period ess useful ut by noise hich stated operate. S
ed (non-he linear
econom therefor less so a
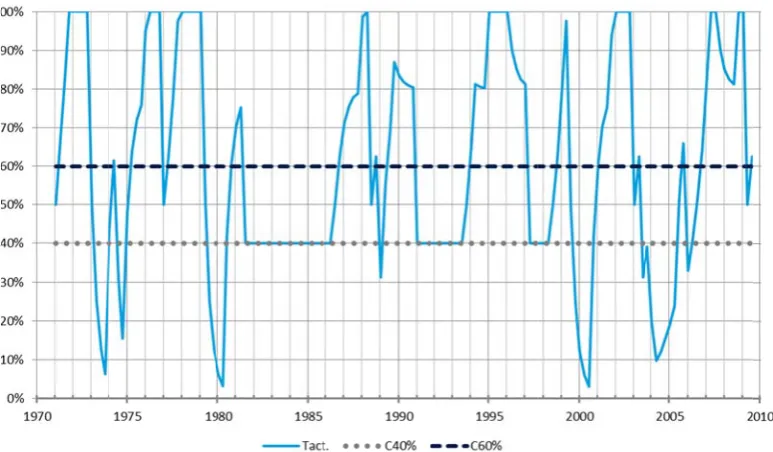
Figure 7 Th conduct rebalanc Figure 8 W input: if it by ha resulting
metric literat re logical th afterwards.
: Optimal
ex-he second t an out of ced portfoli
: Out-of-sam
We then dev f the indicat alf and if th
g tactical al
ture we pre hat the WI s
-post GSCI_T
logical step f sample ex io with a 40
ple quarterly
viate tactica tor goes up he indicato llocation is
eviously exp should be g
TR allocation
p to test the x-ante expl
% commod
y rebalanced
ally from th , we increas or is at zero plotted in F
posed dates good at timi
n using non-li
e efficiency loitation of dities and 60
tactical GSC
his strategic se the alloc o, we go b Figure 8 (li
s this cessat ing commod
inear friction
y of our pr f it. To do
0% cash stra
CI allocation u
allocation cation by 25 ack to the
ight blue co
tion to the dity downtu
ns
roposed ind so, we co ategic alloc
using the CH
according t 5%. If it goe 40% strate
ontinuous lin
early ninet urns before
dicator wou onstruct a q
ation.
H indicator
to the WI i es down, w egic allocati
ne). We ben
ties, it is that and
uld be to quarterly
[image:21.595.107.494.465.691.2]it against the 40%-60% commodities-cash allocation (gray dotted line). Since on average our tactical allocation is 60%-40% commodities-cash allocated, we also benchmark it on this alternative allocation (dark blue dashed line) to control for the extra commodity weight given in our tactical allocation. The results from these simulated portfolios are shown in Table 5.
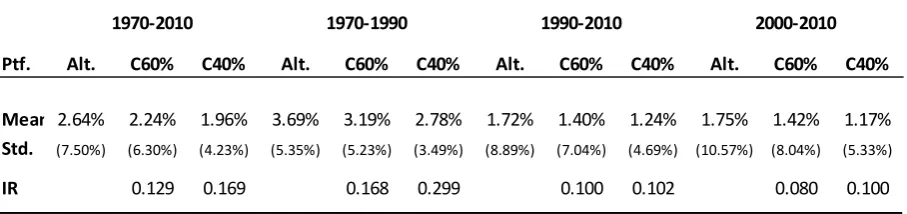
Table 5: Quarterly rebalanced out-of-sample tactical evaluation vs. constant weight benchmark portfolio
Whichever time period is considered, the tactically allocated portfolio consistently beats both benchmarks. The spread in performance as measured by the IR between our tactical allocation and its benchmarks is also greater for the 40% commodity allocation than it is for the 60% commodity allocation. The difference is especially large during the 1970-1990 timespan (78% larger) and small in the 2000-2010 period (25% larger) compared with an average of 31% on the entire sample.
Those out of sample simulation results seem to once again uphold our tactical pass-through allocation hypothesis in the sense that our alternative portfolio performs better when the pass-through is larger and less so when it is not. It is worth noting that in this last timing exercise, we did not account for realized trading costs which would inevitably drag down the performance of a tactical allocation compared to a strategic allocation which requires less frequent therefore less costly portfolio rebalancing. The outcome would most probably still be positive in the high pass-through period but the tactical allocation could backfire in the more recent period considering the relatively low IR. If the WI indicator does seem to add tactical value to a commodity strategy, it should nonetheless be used in conjunction with a battery of other indicators and not on a standalone basis to achieve the best possible allocation.
Ptf. Alt. C60% C40% Alt. C60% C40% Alt. C60% C40% Alt. C60% C40%
Mean 2.64% 2.24% 1.96% 3.69% 3.19% 2.78% 1.72% 1.40% 1.24% 1.75% 1.42% 1.17%
Std. (7.50%) (6.30%) (4.23%) (5.35%) (5.23%) (3.49%) (8.89%) (7.04%) (4.69%) (10.57%) (8.04%) (5.33%)
0.080 0.100
0.168 0.299 0.100 0.102
IR 0.129 0.169
Conclusion
The dramatic macroeconomic shift we have witnessed over the last decade has gradually reshaped our understanding of the relationship between macroeconomic variables and changes in commodity prices. The academic community has in particular delved into the disappearing pass-through of commodity price shocks into core inflation, and the far reaching consequences it has in terms of monetary policy conduct, especially so when it comes to dealing with surging crude oil prices and headline inflation. While macroeconomists and econometricians unraveled the breakdown in the pass-through, little concern was given about its consequences in terms of the allocation of commodities into inflation hedging portfolio management. This article endeavored to provide a first tentative answer to this question. The main take away from this paper can be summed-up in two arguments:
Firstly, we have established that in terms of asset pricing and as a consequence of the disappearance of the pass-through, relative variations in the core inflation index to the headline inflation index have been strongly cointegrated with financial commodity prices since the early 2000s and less-so before that. It thus opens the way for an alternative inflation hedging portfolio technique in which a natural strategic allocation for commodities could be defined as they truly are the perfect hedge for the spread between core and headline inflation variations. We propose to use forecasted core inflation data to determine ex-ante a strategic commodity allocation. Ultimately, the core inflation risk which has been proved to be minimal in the current macroeconomic environment should be left unhedged in our alternative strategy: as we secure only its expected value at inception with an adequately chosen nominal bond or cash allocation, it leave the difference between it ex-ante and ex-post values unhedged. Backtestings of this strategy, with all the previously mentioned caveats, have proved it to be quite successful. It has even managed to survive the challenges of the last crisis fairly well and could be expected to perform even better in an economic recovery scenario.
The principal issues this paper has either failed to resolve or ignored are the following:
Firstly, we must mention that as a caveat to this study, the various backtesting exercises we ran were significantly positively impacted by what is probably an exceptional coincidence of secularly decreasing inflation and inflation risk premium with a historic bull run for commodities. One might wonder if the “brave new world” we were ushered into thanks to unconventional monetary policies, rapidly growing emerging countries and peak-oil will long leave the macroeconomic status quo untouched with a muted pass-through.
Secondly, one might wonder if hedging this commodity induced spread between our inflation references is useful at all: core inflation is on average only marginally different from headline inflation for long-term investors, but has experienced significantly lower inflation in the macroeconomic environment of the last decade. This changing US macroeconomic landscape should theoretically push many long-term liability driven investors towards a swap of references from headline to core inflation. Yet, the drive to move liability indexation towards core inflation is currently curtailed by the lack of investable core-linked assets and therefore a lack of a market reference to enable marking-to-market of such Liability Driven Investments (LDIs). The strong potential demand for such securities drove Deutsche Bank to launch the first investable core proxy in September 2012 (Li & Zeng, 2012) in the form of a long-short linkers-energy commodities index which serves as a reference for trading fixed-for-float “core-proxy” inflation swaps. It is thus most probable that we will see CI-linked securities issued in the near future if the derivative market for core inflation takes off, as it did for HI-linked securities decades before. The relative cheapness of issuing CI-HI-linked securities could in particular attract cash-strapped sovereign issuers eager to attract new investors and reduce their financing cost volatility arising from the headline-indexation.
This evolution would pave the way for a natural extension of this paper into an arbitrage strategy involving long-short core versus headline securities and cross-replicating commodity portfolios. In the meantime, investors wishing to make-up for the lack of an investable core-linked security could either invest in a nominal bond portfolio and buy a fixed-for-float core swap overlay as in (Li & Zeng, 2012), or invest in a linkers portfolio and swap the headline inflation for the core inflation as in (Fulli-Lemaire & Palidda, 2012). Using our correlation analysis findings, we could hope to arbitrage those derivative trades by building a replicating commodity portfolio. It is a complex problem as pricing such instruments would require a mark-to-model approach to price any forward core inflation underlier into an incomplete market cross-hedging framework as it is currently unarbitrable.
References
Amenc, N., Martellini, L., & Ziemann, V. (2009). Inflation-Hedging Properties of Real Assets and Implications for Asset–Liability Management. Journal of Portfolio Mangement, Summer 2009, Vol. 35, No. 4: pp. 94-110.
Amihud, Y., & Mendelson, H. (1986, December). Asset pricing and the bid-ask spread. Journal of Financial Economics, 17(2), 223-249.
Andrews, D. (1993). Tests for parameter instability and structural change with unknown. Econometrica, 821-856.
Attié, A. P., & Roache, S. K. (2009, April). Inflation Hedging for Long-Term Investors. IMF Working Paper.
Blanchard, O. J., & Gali, J. (2007, September). The Macroeconomic Effects of Oil Shocks: Why are the 2000s So Different from the 1970s? NBER Working Paper(13368).
Blanchard, O. J., & Riggi, M. (2009, October). Why are the 2000s so different from the 1970s? A structural interpretation of changes in the macroeconomic effects of oil prices. NBER Working Paper(15467).
Bodie, Z. (1983, Spring). Commodity futures as a hedge against inflation. The Journal of Portfolio Management, pp. Vol. 9, No. 3: pp. 12-17.
Bodie, Z., & Rosansky, V. I. (1980, May/June). Futures., Risk and Return in Commodity. Financial Analysts Journal, 36(3), 27-39.
Boivin, J., & Giannoni, M. P. (2006, August). Has Monetary Policy Become More Effective? Review of Economics and Statistics, 88(3), 445-462.
Brière, M., & Signori, O. (2010). Inflation-hedging portfolios in Different Regimes. Working Paper.
Campbell, J., & Viceira, L. (2002). Strategic Asset Allocation: Portfolio Choice for Long Term Investors. Oxford: Oxford University Press.
Card, D., & Hyslop, D. (1997). Does Inflation "Grease the Wheels of the Labor Market"? In C. D. Romer, & D. H. Romer, Reducing inflation: Motivation and Strategy (pp. 71-122). Chicago: NBER.
Chen, S.-S. (2009, January). Oil price pass-through into inflation. Energy Economics, 31(1), 126-133.
Chong, J., & Miffre, J. (2010, Winter). Conditional Correlation and Volatility in Commodity Futures and Traditional Asset Markets. Journal of Alternative Investments, 12(3), 61-75.
Clark, T. E., & Terry, S. J. (2010, October). Time Variation in the Inflation Passthrough of energy prices. Journal of Money Credit and Banking, 42(7), 1419–1433.
Conover, M. C., Jensen, G. R., Johnson, R. R., & Mercer, J. M. (2010, Fall). Is Now the Time to Add Commodities to Your Portfolio? The Journal of Investing, 19(3), 10-19.
Daskalaki, C., & Skiadopoulos, G. (2011, October). Should investors include commodities in their portfolios after all? New evidence. Journal of Banking & Finance, 35(10), 2606-2626.
De Gregorio, J., Landerretche, O., & Neilson, C. (2007, Spring). Another Pass-Through Bites the Dust? Oil Prices and Inflation. Economia, 7(2), 155-196.
Erb, C. B., & Harvey, C. R. (2006, Mar/Apr). The Strategic and Tactical Value of Commodity Futures. Financial Analysts Journal, 62(2), 69-97.
Fuertes, A.-M., Miffre, J., & Rallis, G. (2010, Oct). Tactical allocation in commodity futures markets: Combining momentum and term structure signals. Journal of Banking & Finance, 34(10), 2530-2548.
Fulli-Lemaire, N., & Palidda, E. (2012, August). Swapping Headline for Core Inflation: An Asset Liability Management Approach. Retrieved from SSRN: http://ssrn.com/abstract=2125962
Gelos, G., & Ustyugova, Y. (2012, September). Inflation Responses to Commodity Price Shocks – How and Why Do Countries Differ? IMF Working Paper, 1-31.
Granger, C., & Newbold, P. (1974). Spurious regressions in econometrics. Journal of Econometrics, 111-120.
Greer, R. J. (1978, Summer). Conservative commodities: A key inflation hedge. Journal of Portfolio Management, 78(4), 26-79.
Hamilton, J. D. (1983, April). Oil and the Macroeconomy since World War II. Journal of Political Economy, 91(2), 228-248.
Hamilton, J. D. (2011, February). Historical Oil Shocks. NBER Working Paper(16790), 1-52.
Hoevenaars, R. P., Molenaarb, R. D., Schotman, P. C., & Steenkamp, T. B. (2008, September). Strategic asset allocation with liabilities: Beyond stocks and bonds. Journal of Economic Dynamics and Control, 32(9), 2939-2970.
Hooker, M. A. (1999). Oil and the Macroeconomy Revisited. Working Papers -- U.S. Federal Reserve Board's Finance & Economic Discussion Series, 1-24.
Jensen, G. R., Johnson, R. R., & Mercer, J. M. (2002, Summer). Tactical Asset Allocation and Commodity Futures. Journal of Portfolio Management, 28(4), 100-111.
Johansen. (1988). Statistical Analysis of Co-integration vectors. Journal of Economic Dynamics and Control, 12, 231-254.
Li, A., & Zeng, S. (2012, August 6). DB Core US CPI Index. (D. Bank, Ed.) DB Fixed Income Special Report, pp. 1-8.
Said, & Dickey. (1984). Testing for Unit Roots in Autoregressive Moving Average Models of Unknown Order. Biometrika, 71, 599-607.
van den Noord, P., & André, C. (2007). Why has Core Inflation Remained so Muted in the Face of the Oil Shock. OECD Papers, 7(4), 1-34.
Vayanos, D. (1998, Spring). Transaction Costs and Asset Prices: A Dynamic Equilibrium Model. The Review of Financial Studies, 11(1), 1-58.
Wing, I. S. (2008, January). Explaining the declining energy intensity of the U.S. economy. Resource and Energy Economics, 30(1), 21-49.
List of Figures
Figure 1: Rolling time frame correlation analysis between commodities and inflation indices... 8
Figure 2: Year on year headline minus core inflation over forty years ... 10
Figure 3: A Comparison of the GSCI TR index and the CH Indicator ... 11
Figure 4: Out of sample evaluation of the strategic allocation vs. a benchmark linkers portfolio. ... 17
Figure 5: Commodities’ share in the core-driven strategic allocation ... 17
Figure 6: Optimal ex-post commodity allocation using proportional and non-linear frictions ... 19
Figure 7: Optimal ex-post GSCI_TR allocation using non-linear frictions ... 20
Figure 8: Out-of-sample quarterly rebalanced tactical GSCI allocation using the CH indicator ... 20
List of Tables
Table 1: CI vs. HI quarterly volatility reduction. ... 9Table 2: ADF tests for unit root ... 13
Table 3: Long-run equilibrium and co-integration test results ... 14
Table 4: A commodity enhanced bond portfolio vs. a linker benchmark: ... 16