Munich Personal RePEc Archive
A review of the national and
international agro-food policies and
institutions in the Mediterranean Region.
GAUTHIER Fatima, EL HADAD and Etienne,
MONTAIGNE and Michel, PETIT and Hilel,
HAMADACHE and Soliman, Ibrahim and Mashhour,
Ahmed and Gaber, Mohamed and Ait El Mekki, Akka and
El Hindi, Atieh and Thabet, Haitham and Thabet, Boubaker
and Cagatay, Selim
CIHEAM-IAMM, CIHEAM-IAMM, CIHEAM-IAMM,
14 January 2011
Online at
https://mpra.ub.uni-muenchen.de/66801/
A review of the national and international
agro-food policies and institutions in the
Mediterranean Region.
Name (Contributed :) Organization E-mail
EL HADAD GAUTHIER Fatima CIHEAM-IAMM elhadad@iamm.fr
MONTAIGNE Etienne CIHEAM-IAMM montaigne@iamm.fr
PETIT Michel CIHEAM-IAMM petit@iamm.fr
HAMADACHE Hilel CIHEAM-IAMM hamadache@iamm.fr
Ibrahim Soliman Zagazig University, Egypt ibsolimen@hotmail.com
Ahmed Mashhour Zagazig University, Egypt
Mohamed Gaber Zagazig University, Egypt
Akka Ait El Mekki National School of Agriculture,Morocco amekki@enameknes.ac.ma
Atieh El Hindi National Agriculture Policy Center of Syrian
Arab Republic Atieh.elhindi@napcsyr.org
Haitham Al Ashkar National Agriculture Policy Center ofSyrian
Arab Republic Haitham.alashkar@napcsyr.org
Boubaker Thabet National Agronomic Institute of
Tunisia Boubaker_thabet@yahoo.com
Selim Cagatay Akdeniz University , Turkey selimcagatay@akdeniz.edu.tr
ABSTRACT
This synthesized report aims at providing a comparative view of agricultural sectors and policies in the MPC, based on the individual country reports and expanding the gathered information. It offers an overall depiction of the whole MPC region under investigation and a comparative perspective, along with a summary of the key country characteristics. More in-depth, country-specific information should be sought within the country reports.
In this sense, this report should be examined together with the individual country reports from which, country-related information have been extracted. References to the country reports are omitted for simplicity reasons, as it is defined that they constitute the basis of this report. In addition, and for the same reason, all references made within the country reports have been also omitted. Detailed reference sources can be found within the country reports. Any reference to additional sources, not referred to in the country reports, is explicitly mentioned.
-Mediterranean policy and other ongoing processes and their main impact on -Mediterranean
Partner Countries” is given, in which the relations between the EU and the MPC under the
Table of Contents
Table of Contents _________________________________________________________________ i
Preface ________________________________________________________________________ iii
1.Description of agro-food sector __________________________________________________ 1
1.1 Importance and role of agro-food sector _______________________________________________ 1
1.2.Main Agricultural Commodities ______________________________________________________ 5
1.2.1Crops 1.2.2Livestock
1.3Agricultural sector structure ________________________________________________________ 16
1.3.1Farm Structure 1.3.2Agricultural Labour 1.3.3Input Usage & Machinery
1.4Agro-food industry _______________________________________________________________ 29
1.4.1Description, importance 1.4.2Main products
1.4.3Structure and typology of the food industry 1.4.4.Investments
2.Current agricultural and food policies ____________________________________________ 38
2.1Short retrospective view of agricultural policies (historic overview) ________________________ 38
2.2Objectives of current agro-food policies and support to agriculture ________________________ 44
2.3Price and income support policies ___________________________________________________ 49
2.4Input use policies_________________________________________________________________ 53
2.5Rural development policies _________________________________________________________ 56
2.6Agro-environmental policies ________________________________________________________ 62
2.7Infrastructure policies _____________________________________________________________ 70
2.8Consumer policies ________________________________________________________________ 73
3.Trade policies ________________________________________________________________ 76
3.1General presentation of agro-food trade ______________________________________________ 76
3.2Trade agreements ________________________________________________________________ 82
3.2.1Intra MPC trade
3.2.2Trade agreements with the EU
3.2.3International trade agreements & globalization
3.3Tariff and non-tariff barriers _______________________________________________________ 100
4.Future prospects ____________________________________________________________ 106
4.1Agro-food sector outlook _________________________________________________________ 106
4.2Agro-food policies’ evolution outlook _______________________________________________ 112
5.Concluding remarks __________________________________________________________ 119
ANNEX I _____________________________________________________________________ 123
Tables ____________________________________________________________________________ 124
Figures ___________________________________________________________________________ 156
Preface
This report entitled “Review of the national and international agro-food policies and institutions in the Mediterranean Region” (WP2T2) is part of Deliverable D09 “Report on global and sectorial
policies in the MPCs and in the EU” for the SUSTAINMEDproject “Sustainable agri-food systems
and rural development in the Mediterranean Partner Countries” (KBBE-2009-1-4-05) funded by the European Commission under contract reference no. 245233.
Under WP2T2 involved partners prepared country analytical reports for each of the Mediterranean Partner Countries (MPC) included in the project. These reports, prepared by experts that have established experience in agricultural matters in the related countries, were produced following a predetermined set of common guidelines so as to maintain a uniform presentation that would facilitate comparative views. Still, due to different levels of access to data and detailed information in various countries, especially in those countries that were under considerable turmoil in the period of research, the uniformity of reports and information contained was not always possible to maintain.
This synthesised report aims at providing a comparative view of agricultural sectors and policies in the MPC, based on the individual country reports and expanding the gathered information. It offers an overall depiction of the whole MPC region under investigation and a comparative perspective, along with a summary of the key country characteristics. More in-depth, country-specific information should be sought within the country reports.
In this sense, this report should be examined together with the individual country reports from which, country-related information have been extracted. References to the country reports are omitted for simplicity reasons, as it is defined that they constitute the basis of this report. In addition, and for the same reason, all references made within the country reports have been also omitted. Detailed reference sources can be found within the country reports. Any reference to additional sources, not referred to in the country reports, is explicitly mentioned.
In Annex II, following the Mediterranean Partner Countries’ reports, a report entitled “Euro
The country reports and the corresponding authors are shown in the following table:
Country Authors Institution
Algeria Akka Ait El Mekki National School of Agriculture, Meknes, Morocco
Egypt Ibrahim Soliman, Ahmed Mashhour and Faculty of Agriculture
Mohamed Gaber
Zagazig University, Zagazig, Egypt
Jordan Ibrahim Soliman Faculty of Agriculture
Zagazig University, Zagazig, Egypt
Lebanon Atieh El Hindi, Haitham Al Ashkar National Agriculture Policy Center of Syrian
Arab Republic
Libya Boubaker Thabet National Agronomic Institutre of Tunisia
Morocco Akka Ait El Mekki National School of Agriculture, Meknes, Morocco
Syria Atieh El Hindi, Haitham Al Ashkar National Agriculture Policy Center of Syrian
Arab Republic
Tunisia Boubaker Thabet National Agronomic Institutre of Tunisia
Turkey Akdeniz University Centre for Economic
Research on Mediterranean Countries
1. Description of agro-food sector
1.1 Importance and role of agro-food sector
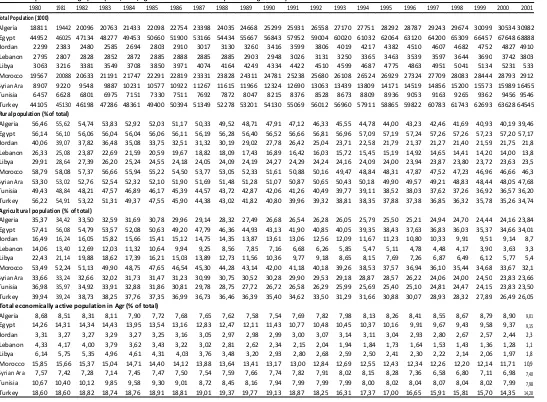
Agriculture is a significant contributor to the national economies of Mediterranean Partner Countries (MPC). In particular regarding the employment rates, agriculture constitutes the main force for absorbing considerable amounts of workforce in these countries. Given the high rate of rural population in these countries, the generally low economic development and the low incomes, agriculture is a significant contributor also to social cohesion. One should also bear in mind that almost all MPC are net food importers and that the global food prices crisis in 2007/2008 that resulted in escalating food prices, gave also rise to social unrest, riots and in some cases, rebellions (e.g. Tunisia, Egypt, Libya, Syria).
The value-added contribution of agriculture to GDP ranges from around 15-20% for Syria and Morocco to a low of less than 3% for Jordan and Libya (Table 1.1). Morocco, Egypt and Algeria exhibit figures well-above 10%, while all countries, with the exception of Algeria, Morocco and Syria have experienced a considerable downsizing of their agricultural sectors’ contribution to the GDP since the 1960s and 1980s so that today agriculture’s contribution is about 50% less than two decades ago.
unemployment rates in 2008 followed by Jordan and Algeria. Noticeably, of all the studied MPC, only Lebanon and Syria have unemployment rates below 10%1.
The agricultural sector is the major source of employment for most MPC countries; on average, 23% of total employment is in the agricultural sector regarding all MPC countries (Table 1.3). Out of the studied countries, Morocco exhibits the highest figure: more than 40% of the labour workforce is employed in agriculture, followed by Egypt and Turkey with over 30% and 20%, respectively. Only in Jordan are agricultural employment levels around 3%.
Rural population is high in almost all MPC countries, predominantly Egypt where it accounts for more than 55% of the total population (Table 1.4). For the rest MENA countries it ranges from around 30% (Turkey) to 44% (Syria). The countries with the lowest rural population are Lebanon (12%), Jordan and Libya (both at around 22%). Consequently, Egypt also exhibits the highest percentage of agricultural population (27%) while in Lebanon and Libya it is less than 3%. When it comes to the economically active population in agriculture, Turkey exhibits the highest rate (10.8%), with no other country over 10%. Morocco has 9.2, followed by Algeria and Egypt (8-9%), whereas in Lebanon, Libya and Jordan the economically active population in agriculture accounts for less than 2% of the total population.
The relatively limited contribution of agriculture to national GDPs, despite both the significant percentage of employment as well as the high levels of agricultural protection2, could be attributed - at least to a certain extent - to the low productivity of the sector. Low productivity in agriculture results also to a relatively large share of poverty in rural areas (IFAD 2003). This in turn, has an adverse impact on the countries’ ability to modernise their agricultural sectors and boost the sector’s ability to provide employment opportunities (that are needed in countries with low
Data for Libya are not available.
per capita incomes and scarce job opportunities) and reduce imports of agricultural products (that do not only pose a severe fiscal budget, but expose MPC countries in price fluctuations similar to the food price crisis in 2007/08).
One key reason for MPC’s low productivity is the fact that they are faced with adverse climatic and soil conditions (low and highly variable annual rainfall patterns, severe limitations in water resources, as well as soil erosion, desertification etc) (Minot et al. 2010).
The MENA (Middle East & North Africa) region (in which all studied MPC belong) is the most food import–dependent region in the world, as food imports accounted for 25–50% of national consumption and they are projected to rise even further in the future, primarily because of the exponential population growth in the region on the one hand and the limited potential for land expansion and scarce availability of valuable resources such as water and land on the other (Breisiger et al. 2010). In this sense, food security is matter of great concern in the MENA region; the escalating food prices worldwide and they worrying FAO projections for the next decades, further stress the importance of agricultural and food production in the region.
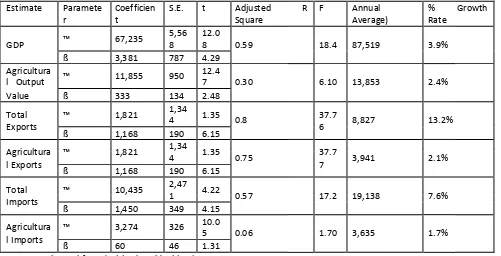
Agricultural sector is a major sector in Egypt's national economy. It is responsible for achieving food security, by using human and natural resources with technology and capital in intensive way. The annual average of the period (1995-2007) showed that agricultural sector provided about 31% employment opportunities of the total workforce, contributed approximately by 16% of GDP, and by nearly 9% of total exports. The agricultural sector has achieved a steady increase in the volume of investments directed to such sector. Agricultural investments reached about 1.13 billion US$ in 2005/2006 and rose to approximately 1.5 billion US$ in 2006/2007 even though it had not passed 6.3% of total public investment. While 35% of the economically active population was employed in agriculture in 1995, the agricultural share in total Egyptian GDP was only 17%, the same year.
In other words, there was a low growth rate of the Egyptian agricultural production, over the last decade, associated with imbalance between a low share of this sector in GDP and relatively higher share in total employment. Such imbalance implied lower productivity, in terms of average value of agricultural output per agricultural worker, compared with the national level, where the agricultural labour productivity reached only 50% of the national one. Egypt has remained a net importer of agricultural products, although its agricultural trade deficit has decreased in recent years.
Agriculture in Jordan contributed substantially to the economy at the time of Jordan's independence, but it subsequently suffered a decades-long steady decline. In the early 1950s, agriculture constituted almost 40 percent of GNP; on the eve of the June 1967 War, it was 17 percent. By the mid-1980s, agriculture's share of GNP in Jordan was only about 6 percent. Several factors contributed to this downward trend. With the Israeli occupation of the West Bank, Jordan lost prime farmland. Starting in the mid-1970s, Jordanian labour emigration also hastened the decline of agriculture. Many Jordanian peasants abandoned farming to seek for lucrative jobs abroad. Others migrated to cities where labour shortages had led to higher wages for manual workers. Deserted farms were built over as urban areas expanded. Agriculture’s direct contribution to GDP has been around 5 percent since 1995, about 2-3 points less than its contribution in 1992. It is estimated, however, that 25-30 percent of economic activity depends on agriculture.
allocated to agricultural sector) such as poor agricultural research and extension, and unclear agricultural policies. Agriculture is in many ways at a crossroads in Lebanon, seemingly able to gradually extinguish itself or instead, revive and take shape as a vibrant sector of the economy, providing economic opportunities and contributing to food security.
Agriculture in Lebanon is characterized by the prevalence of traditional cropping. Urbanization is rapidly encroaching on rural areas including fertile land, even though substantial areas are unused or abandoned. Although the role of agriculture in the country’s economy is declining, it still occupies an important place, generating 6.7% of Lebanon’s Gross Domestic Product in 2004 and employing roughly 9% of the labour force in 2003. Agriculture plays a significant role in Lebanon’s national economy, since agricultural products provide a good deal of the raw materials for the industrial sector. Agriculture contributes about 12 per cent of the GDP and employs 9 per cent of the total workforce. Nevertheless, and despite the importance of the agricultural sector, Lebanon has a widening agricultural deficit and growing food dependence.
Libya is the fourth largest country in Africa by area. Typically, agricultural activities are limited to the northern strip bordering the coast, plus a number of cultivated spots in hilly areas and oases. Libyan agriculture is confronted with a highly variable rainfall, which is very concentrated in the winter season, thus constituting a severely limiting factor on the growth of plants and therefore on agricultural production. Libya is considered a quite arid country as most parts of the country are either semi-arid or arid. Only about two percent of the country’s arable lands; i.e., 36000 Km2 (or 3.6 million hectares), receive enough rain to envisage cultivation.
Libya has sought to expand its agriculture since the early 1970s; following the 1969 revolution. Its success in this regard has rather been limited despite the heavy public investments that equalled 30 percent of government expenditures in the 1970’s. For example, production of cereals in 1998 (207,000 metric tons) met only 15% of the country's needs. Therefore, Libya has been all along dependent on large food imports, estimated at about 75 percent or more of its annual needs.
The fate of Libya's agricultural economy has been inversely related to the discovery, extraction, and exportation of petroleum. After the discovery of oil in the late nineteen fifties, agricultural production declined sharply as migration into cities began in earnest. In 1958, just before the beginning of the oil wealth, agriculture contributed over 26 percent of the GDP and Libya actually exported food. This amount tumbled to just 2% by 1978, and fluctuated since to remain presently at about 5%. Libyan agriculture is a small contributor to GDP. The primary reason is the predominance of increasing oil revenues. In addition to that, major barriers limit its growth. The very limiting nature of arable land (2% of Libya's area), the scarcity of water resources, the over-use of arable and grazing land and fertilizers, along with the shortage of labour are among the typical explanatory variables for the sluggish agricultural growth in Libya.
Despite these limitations the current value of agriculture output has grown over the years, as did the general GDP of Libya. This growth has been accompanied though by a continuous depreciation of the currency of the country (dinar) along with a moderate rate of controlled inflation. In constant monetary and/or real terms, however, the registered nominal growth would be obviously much less impressive.
Arable land in Syria represents 32% of the total area, non-arable land 20%, meadows and pastures 44.5%, and forests 3%. In 2009, the total actual cultivated land was about 4.34 million hectares, 70% of which is rain-fed and 30% irrigated. The percentages of urban and of rural population are 53% and 47%, respectively. Agro-food is a leading economic sector of the Syrian economy, its contribution to employment and income generation ranges between 20-25 percent depending on the rainfalls. Agro-food sector plays crucial functions in raising food security, enhancing inflows of hard currency through export, stimulating economic activities in marketing, transport, and processing as it supply agro-food industry with raw materials. In addition, it plays an important role in protecting environment, reducing pollution, and enhancing the beauty of the nature.
Generally, the contribution of agriculture sector ranges between 20% and 25% of the total GDP depending on rainfall rates in different years. The agro-food sector offers employment for roughly 20% of the workforce. However, the draught swept the region forced many farmers mainly in the northeast Syria to abandon farming to work in other governorates. It is estimated that the total workforce in 2009 (more than 15 year-old) amounted about 5 million, of which agricultural sector employed 758,286 worker representing 15% of the total work force (31% in 2000 and 26% in 2003), and ranking fifth in its contribution to employment.
In Tunisia, agriculture provides a minimum of 16% of the employment, which is also a major decline from the sixties when major employment (about 30%) used to be generated by rural activities and the agricultural sector in particular. While this is an indication that other sectors of the economy have been contributing more and more to employment, and to general economic growth for that matter, agriculture is still contributing adequately as (1) its share in total investment does not exceed 10% and (2) its economic growth is lagging behind that of the overall economy. This suggests that on a 1% basis of investment, agriculture is still contributing to employment than other sectors.
1.2. Main Agricultural Commodities
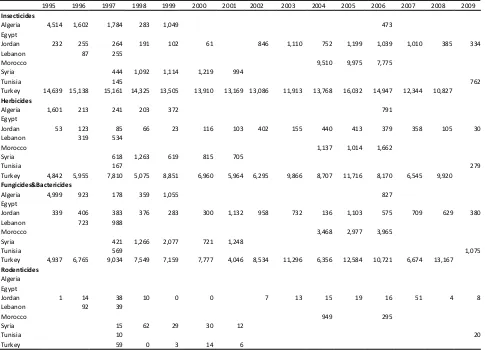
The main agricultural commodities in all the studied MPC are fruit and vegetables and meat products. Citrus fruit, melons, dates, grapes, olives and apples are the most important fruits and potatoes, tomatoes and onions regarding vegetables. Cereals (predominantly wheat as well as rice in Egypt), sugar crops (sugarcane in Egypt, sugarbeets in Morocco and Syria) and cotton (in Egypt, Syria and Turkey) are the most important other crops. Olive oil is also produced in most MENA countries but its production is mainly concentrated in Tunisia, Syria, Turkey and Morocco. Regarding livestock production, milk and chicken/turkey production are the main products in most MPC (see alsoFigures 1-9).
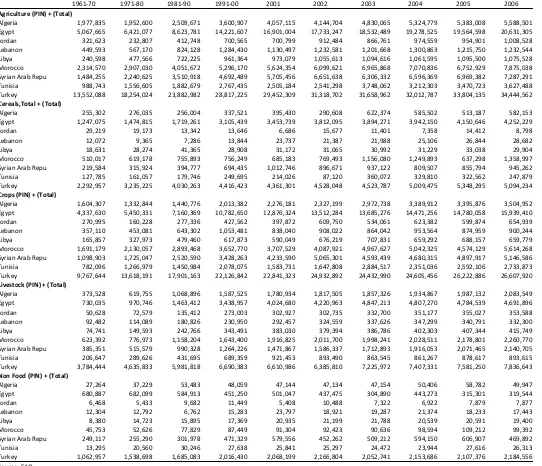
The countries with the largest agricultural sectors in terms of value of agricultural production are by far Turkey and Egypt, with 35 and 23 billion int. $ respectively; their sectors are around three to four times larger than the following country, namely Morocco (Table 1.5a). No other country has a value of agricultural production greater than 6.5 billion int $, while for Jordan, Lebanon and Libya it is below 2 billion. Algeria, Jordan and Morocco have increased their value of agriculturaloutput by over 50% in the period 2001-2009, followed by Tunisia and Egypt (30-40%). The remaining countries exhibit a much less lower growth pattern that ranges from 15-20%.
It is worth noting that for all countries but Algeria, Jordan and Libya, the value of non-food products has dropped in the last decade; in Egypt it fell by more than 65%, in Turkey, Syria and Lebanon by around 20%, while in Libya and Tunisia it fell by merely 2-3%.
The rather uniform structure of the agricultural sectors of the MPC under study is further evidenced in Table 1.5b. Crop production constitutes by far the most important element of agriculture, accounting from 60% (Libya) to 76% (Egypt) of the value of agricultural production. Livestock production on the other hand, represents the remaining, lesser portion. Still, the share of livestock production has been steadily rising in all MPC countries, excluding Turkey which the only country where the share of livestock production in 2009 is lower than in the 1960s.
Cereals are a major product for the majority of the MPC countries; in fact a clear cluster formation can be observed: One cluster includes Egypt, Turkey and Morocco accounting for a 14-19% of the total value of agricultural production, another Algeria, Syria, Tunisia (around 10%) and the final one includes the remaining countries (Lebanon, Libya, Jordan) where cereal production constitutes a lesser part of the total value (0.6-2.6%). Interestingly, the share of cereals in the period 1961-2009 shows a slow downward trend in all countries, with the exception of Jordan, where the drop has been more dramatic: cereals in the 1960s accounted for a little less than 10%, only to drop to less than 1% in 2009.
Finally, regarding non-food products, for all countries this category represents a little less or a little more of 1% of the total value of agricultural production. The exceptions are Syria and Turkey where the corresponding figures are higher: 6.9% and 4.6% respectively. In Egypt the steady and rapid decline of the share of non-food products is impressive after the 1960s and the 1970s; it has fallen from more than 13% to around 0.7%.
1.2.1 Crops
Agricultural land comprises a large part of the country’s area in Syria (75%) as well as Lebanon, Morocco and Tunisia (60-65%). In Turkey it is around 50%, while in the remaining countries Algeria 17%, Jordan 11%, Libya 8%, Egypt 3.6%.
Organic agricultural areas are very scarce in all MPC countries: In Tunisia organic agriculture covers around 1.8% of the total agricultural area, while in all the rest it is well below 1%.
Algeria and Turkey have the largest agricultural areas, while Jordan and Lebanon the smallest (Table 1.6). Nevertheless, in Algeria the highest percentage of the area is actually permanent meadows and pastures (around 80%). Similar is the case in Libya, Jordan and Morocco. Excluding Egypt that has no pastures, Turkey is the only other country where pastures represent less than 50% of the total agricultural area.
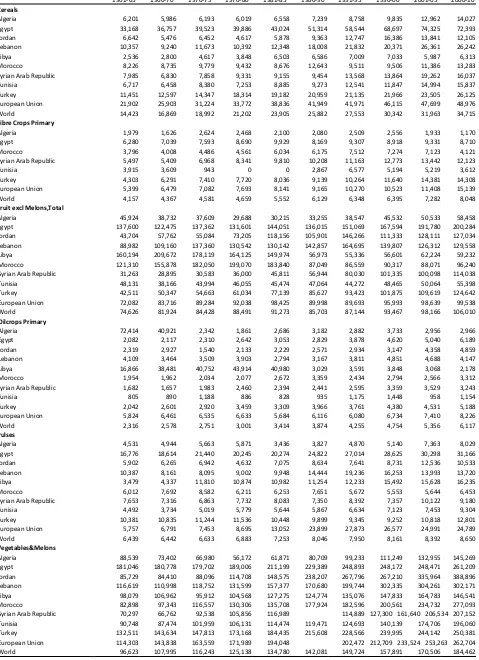
The most important crop commodities in each country in terms of harvested areas, production volumes and value of production are depicted in Tables 1.7-1.9. Average yield in cereals and oilcrops is below the world’s average in all MPC countries, but Egypt (Table 1.10). Regarding fibre crops, only Syria, Turkey and Egypt surpass the world’s average, but on the other hand the majority of the MPC exhibit a much higher productivity rate in fruits and vegetables. The value of agricultural production per agricultural worker reveals that the overall productivity of the agricultural sectors in the MPC is higher than the world average, but it is still Algeria is the only country that has a ratio lower than the world’s average quite low when compared to the European average (Table 1.11). Algeria appears to have the lowest output per worker, followed by Morocco and Egypt. All countries exhibit a productivity ratio 3-4 times lower than the European average, excluding Jordan (2 times), Libya and Lebanon which is the only MPC with a higher ratio. In fact, Lebanon is the country that exhibits an impressive increase of the productivity per worker ratio in the period 1980-2009 (more than 5 times). Egypt, Jordan, Libya and Morocco also appear to have a significant increase as well, whereas Tunisia and Turkey exhibit a more modest increase (60-80%). On the other hand, Algeria’s productivity increase is below the world average (33%) and Syria exhibits a significantly low increase of productivity which barely exceeds 10%, although it had in the 1980s the second highest output value per worker among the MPC.
The total agricultural area in Egypt was around 3,689 million hectares in 2009. The major component of the agricultural land is the Nile delta and its valley until the Sothern border of Egypt, which is called the old land. It represents 70% of the total. The rest is reclaimed desert land called new land. Most of agricultural land (97.6%) is surface irrigated by Nile water. The rest is 2% underground water and 0.4% rain fed, concentrated at the north west of Mediterranean shore. More than 80% of water resources in Egypt are utilized for agriculture. The permanent crops share was 22% of the agricultural area.
Fruits are not only the main permanent crop, but they have also a significant share in Egyptian agricultural exports, 583 thousand tons of fruits, i.e. 6% of production, were exported in 2009. Citrus (Lemon, Limes, Mandarin and Oranges) are the main producing fruits in Egypt. Citrus, also, represent one-half of the exported quantity of fruits in the same year, where the bulk was oranges. Citrus represent one third of fruits consumption. However, the share of fruits in daily calories intake is around 5% and 2% of protein intake. Date palm as the second category among permanent crops in Egypt, occupying 20% of the permanent crops area, provides about 1.3 million tons of production. However, dates almost recognize self-sufficiency in Egypt. Only 5,000 tons are exported and one ton of special quality is imported from Saudi Arabia. Dates yield per hectare in Egypt is one of the highest levels in the world, around 15 tons per hectare, while the world average is around 5.75 tons per hectare.
occupies around 26% of winter area. Since the last decade, within the economic reform era, the government has provided a guarantee wheat price higher than the international price of wheat. This policy instrument encouraged farmers to deliver their wheat for being processed as subsidized common bread and to raise the wheat self-sufficiency as basic strategic crop. Such incentive p has lead to decrease the Berseem area, as competitive crop, from one third to less than one-fifth of agricultural area in Egypt. The area taken from under berseem allocated mainly for wheat and opened, relatively, a place for sugar beat area to expand. The changes in price policies would explain to some extent such changes in cropping pattern.
Wheat production reached about 7.4 million tons in 2009. Even though, it hardly covered 56% of consumption in that year. Egypt is the first importer of wheat in the world market, where. Wheat imports surpassed 5.9 million tons in 2009. The shortage of wheat production to cover consumption is not due to low productivity, as the Egyptian wheat yield reached 2.2 folds the world average in 2009, which put Egypt at the top of the world's countries in wheat productivity. However, as Egyptian Agriculture is fully surface irrigated with suitable weather and intensive fertilization the potential wheat productivity is at least 50% higher than the existing level. It seems that, limits of available agricultural land in winter are the constraint, which is also associated with water limitation.
The summer season crops are numerous but, the two most important ones are maize and rice, which represent about 40% and 32% of the aggregate total summer cropped area, respectively. They are concentrated in old land. In general, the summer crops are concentrated in old land region, because in summer, weather is hot and new land usually is much poorer land, close to sandy. Therefore, cultivating such crops in new land consumes more water and more fertilizers. Water charge is more costly in new land; due to not only more quantity, but also it is of the higher cost of irrigation network, using electricity power, sprinkle, and/or drip irrigation.
Egyptian rice is a main exportable agro-food commodity. The exported quantity surpassed 27% of production in 2009. The average yield per hectare of maize and rice was in 2009 more than two times higher than the world average. Even though there is a probability to expand area and production of both crops, the limited water resource in Egypt is a constraint to expand rice area. Rice and maize are the second important food items in the Egyptian diet after wheat. Together they provide 28% of calories and 23% of protein in the daily food intake.
Egyptian cotton, historically, was the main crop in the cropping pattern. However, empirically, cotton now is occupying not more than 6.5% of summer-cropped area. Dramatic changes of Egyptian economy and contradicted Policies as well as lack of proper management of related institutional framework in Egyptian economy has lead to rapid deterioration in the area, yield, and associated domestic industry of cotton. Even though, cotton is still occupying almost, value-wise, the front of agro-food exports bill. The Egyptian cotton still has a higher yield per hectare than the world average, and has unique quality of extra-long staple at the highest price in the international market.
The most important vegetable crops are Tomatoes, Potatoes, Onion, and Green beans, in winter season. They occupy 32%, 19%15% and 8% of winter vegetable cropped area, respectively. Water melon for seeds, Strawberry, Tomatoes and Potatoes,, occupy 19%, 19%13% and 11% of summer vegetable cropped area, respectively. During Nili Season Tomatoes, Potatoes, Egg plant and Green pepper occupy 29%, 26%, 8% and 7% of vegetable cropped area, respectively.
irrigated area has increased annually, at approximately, 4.3%, while the rain-fed fruits area decreased faster at 4.6% a year along the last decade. In contrast, vegetable area had increased from 344 thousand hectares in 2003 to more about 481 thousand hectares in 2010, where most of it was irrigated, i.e. around 95%. The expansion in vegetables area included both irrigated and rain-fed at an average annual growth rate of 4.7% and 6.5%, respectively. The Seasonal field crops have shown high rate of expansion of about 11.6% a year, in the area under irrigated system, which doubled the share of irrigated field crops in the total area of such set of crops from only 5% in 2003 to 10% in the year 2010.
The major vegetable crops in Jordan are Tomatoes, Potatoes, and Watermelon. There was an apparent expansion in tomatoes area after 2005 which made such crop occupied more than 100 thousands hectare in recent years, associated with a similar increase in production of tomatoes from 324 thousand hectares in 1999 to almost 610 thousand tons in 2009. Potatoes area had moved over cycle alike. It decreased from 40 thousand tons in 1999 to a minimum of 35 thousand hectares in 2004, and then started an increase up to 53 thousand hectares in 2009. Production of potatoes has passed a similar trend over the period 1999-2009. Potatoes produce was about 95 thousand tons in 19999 raised to 172 thousand tons in 2007 and then dropped to 99 thousand tons in 2009.
The three major fruit trees in Jordan are oranges (citrus), olive, and apple. While olive reached around 6.8 million trees, the citrus trees reached about 1.9 million trees and the apple trees number was about 1.5 million trees, in 2009. Production of the three major fruit trees fluctuated almost at the same pattern of the area along the period 1999-2009. The production of Jordan reached around 125 thousand tons, 90 thousand tons and 31 thousand tons, of olives, citrus and apples, respectively, in the year 2009.
The total cultivated area in Lebanon in 2006 was about 279 thousand hectare. Many crops are grown in Lebanon; they can be classified to the following categories: Cereals, Legumes, vegetables, industrial crops, fruitful trees, and other trees. Lebanon is seeking to diversify and produce more unusual fruit varieties, such as kiwi fruit, pomegranate, custard apple and even truffles. But it largely produces standard crops like apples, pears, potatoes, onions, grapes and citrus fruit. The olive oil industry is ancient and produces extremely high quality oil, some of which is sold by specialist distributors in the UK. Another major growth sector is the wine industry which is now well represented in Europe and wins many awards. The banana industry is also expanding fast, with a 100% increase in exports in 2006 compared to 2003. All of these exports have the potential to do better in the EU as tariffs disappear over the next few years. Tastes in dairy products are also changing, with consumption of fresh milk and cheese increasing at a rapid pace as more dairy farming is introduced. Standards though will remain a problem for the foreseeable future.
In Libya, typically, agricultural activities are limited to the northern strip bordering the coast, plus a number of cultivated spots in hilly areas and oases. Based on soil and climate, one can distinguish four major agro-ecological regions in Libya:
The costal belt, a narrow plain along the Mediterranean coast with a width of 5-25 Km, extending to about 100 Km on the western side at the Jefara plain, and with an average annual rainfall of up to 200-250 mm,
Hilly areas, flanking the coastal belt from the south and cover the Jabal Al Gharbi (western mountain) to the west and the Jabal Al Akhdhar (green mountain) to the East, with an average yearly rainfall of 200-300 mm and 250-600, respectively,
Desert areas, except for the scattered oases, they are barren desert lands with no potential for agricultural activity with no irrigation
The climatic conditions limit Libya's grain production to two main cereal crops: wheat and barley. Furthermore these crops are restricted to just a narrow, rain-brushed ribbon of land (and its adjacent highlands) along the coast, and a few irrigated areas in isolated oases. Cultivation of autumn-sown wheat and barley is made possible because there are two main water sources. First, there are important reserves of shallow groundwater in Tripolitana, along Libya's northwest coast. This source permits significant irrigation. Second, the scant coastal precipitation that does occur fortuitously falls during the winter grain growing season (November through April). While wheat is the generally preferred food grain by farmers as it is typically grown on better quality land and produces typically about 125,000 tons per year, whereas barley yields just 80,000 tons barley is grown increasingly on larger areas as it is more adaptable to the marginal climate and soils, so it is a popular choice for the Libyan farmer located in the drier agro-climatic zones. The country's cereal yields are generally paltry due to moisture scarcity and marginal soils. Wheat averages just 0.8 tons per hectare and barley averages around 0.5 tons per hectare. Other grains produced include less than 10,000 tons of millet yearly, and 2,000 tons of irrigated corn.
Other crops are also grown in Libya mainly potatoes (210,000 MT), watermelons, (210,000), olives (190,000), onions (180,000), tomatoes (158,000), dates (130,000). These crops make up about 80% of annual Libyan agricultural production.
In Morocco, the most important areas of rainfed agriculture represented by the plains of Sais, Chaouia, Haouz, Doukkala and Tadla. Cereals are the major crops of the production system in the country. They annually cover nearly 60% of the total acreage, an area of about 5 million hectares. Barley remains the most widely grown cereal with nearly 42% of cereal area, followed by soft wheat (38%) and durum wheat (18%). The level of grain production is strongly linked to the climatic conditions, especially rainfall. Yields per hectare are relatively low with an average of 15 quintals for soft wheat, 13 quintals for durum wheat and 10 quintals for barley. For the agricultural campaign of 2008-09, which has been marked by optimal rainfall, the production of the three cereal species reached 4.5 million tons, 2 million tons and 3.7 million quintals respectively.
As for pulses, their acreage has reached 380,100 hectares in 2008-09. The bean is ranked first with 46% followed by chickpea (20.2%), lentils (13.5%) and peas (9.6%). Total production is estimated at 310,000 tons. It should be noted that the production of pulses has remained relatively stable over the past 10 years around 250,000 T but with higher levels during the years of good rainfall.
For sugar crops, the cultivation of sugar beet covers around 60,000 ha in the last ten years. In 2008-09, the area was relatively limited and the main reason was the bad weather that occurred early in the season. Indeed, the abundance of rain that fell in planting season especially in the Gharb region was reflected in a negative way about the possibilities of access to land. Unlike the fall of the area (55,000 ha), yields have increased by almost 8% to 55 T/ha. With this performance, total production reached 2.8 million tons against almost 3 million tons in 2007-08, down by nearly 7.7%. As for sugar cane, its total area averaged 18,000 hectares annually. But, it fell 7% to 15,700 ha in 2009. The average yield amounted to 69.5 t/ha that allowed to harvest close to 920,000 T.
purchase price. Production is estimated at 850,000 t which allowed processing nearly 85,000 t of olive oil and 100,000 t of preserved olives.
On the other hand, the achievement of sunflower area record depends on the weather and especially the spring rainfall. During the past decade, it peaked at 118,000 ha in 1997 allowing the collection of 85,000 T. In 2008-09, the weather conditions for the installation of fall crops (cereals in particular) early in the season contributed greatly to the increase in area of spring crops including sunflower which registered 63,750 ha acreage. Average yields are generally low and rarely exceed 1.5 tons/ ha. In 2008-09, yields were 1.33 T/ha and lead to harvest nearly 60,400 tons.
The average area reserved to vegetable crops is nearly 250,000 ha in the last ten years. It reached 267,000 ha in 2008-09, representing an increase of 5% compared to 2007-08. The potato, onion and tomato are the main species with respectively about 60,000 ha, 30,000 ha and 17,000 ha. Total vegetable production, taking advantage of good rainfall year, reached nearly 7.3 million tons in 2009, an increase of 6% over the previous year. Nearly 76.5% of this production corresponds to the season crops while the rest is for early crops (20%) and for agro-industry crops (3.5%).
Season crops have covered almost 229,000 ha against 217,200 ha the year before. They concern a wide range of vegetable species dominated by potatoes with 25.7% of total production followed by melon and watermelon (23.5%), onions (15.5%), carrot and turnip (7.7%), tomato (6%) and green beans (5%).
Early crops are mainly represented by the tomato with 20% of the total area and 48% of the harvested production. Area and production of other export-oriented crops are increasing, namely the green beans, peppers and zucchini. Agro-industry crops are dominated by tomato and sweet pepper (Niora) with a production share of 88% and 11.7% respectively.
The tree crops area covers nearly 1.1 million hectares or just over 11% of the total UAA. It has increased in average by nearly 20,000 ha each year between 1995 and 2009. The olive tree is by far the most dominant species as it covers almost 65% of the area tree (680,000 ha). The area occupied by the almond tree is second with 146,000 ha followed by that of citrus with nearly 92,000 ha. The viticulture sector covers nearly 50,000 hectares while the area occupied by the Rosaceae crops (other than the almond) and seed amounts to 60,000 ha.
With regard to vine, the harvested tonnage amounted to 288,000 t of which 73% of table grapes and 27% of wine grapes. While weather conditions have contributed to the increase in production recorded over the past years (2004-08), we note also the improvement of the production process adopted by growers. Indeed, most of the growers have made great efforts in conducting this crop using drip irrigation and proper reasoning fertilization and phytosanitary treatments.
Syria is characterized by high diversity of agricultural production, including large variety of fruits, vegetables, and grains, in addition to livestock products such as dairy products, meat, fish, eggs, leather, honey, etc. Since the beginning of nineties, the agricultural production, plant and livestock, has witnessed considerable development. This can be explained by the expansion in the cultivated area mainly under irrigation, improved seeds, fertilization, and applying modern agricultural techniques. The livestock sector has also achieved remarkable development due to the supportive governmental policies such as providing feed and other inputs at subsidized price, and veterinary medicines free of charge, and the adoption of high productivity spices.
is cotton and sugar beet, tobacco; main vegetables tomato and potato, and main fruit tree Crops are olives, citrus, and apples.
The major crops grown in Tunisia are cereals, food legumes, cash crops, forages and tree crops. Cereals are made up of durum, soft wheat, and barley and with an increasing share of triticale. Food legumes include beans (mainly of the type faba) and chick beans. Cash crops are much diversified and are usually grown on irrigated lands which amount to about 460000 Ha; i.e. about 8% of total arable land. Tree crops constitute a large component of the agricultural activity of farmers as they cover over 2 million Ha, with the dominating activity being olive production.
Turkey is ranked among the largest countries in the world in terms of the covered agricultural land area. In 2009, the utilized agricultural area was 38 935 000 hectare but since 1998 this land has decreased by around 3 million hectares (an annual average rate of 0.3%). According to the 2006 Agricultural Holdings Structure Survey results, 6%6 of the land is operated by holdings engaged in both crop production and animal husbandry; the share of land operated by holdings engaged only in crop production and animal husbandry is 34% and 0.5% respectively.
In world markets Turkey has a significant place with respect to production of several commodities. For example Turkey is ranked as the biggest in hazelnuts, apricots and cherries production; as the second-largest producer of cucumber, pistachios, watermelons, figs, lentils and chestnuts; and the third most important producer of chickpeas, onions, apples, walnuts, olives. Fruit and vegetable production together accounted for 55% of total production value in 2009 and it is mainly composed of apples, tomatoes, grapes, watermelon, citrus, apricots, cherries, hazelnuts, chestnuts, figs, pistachios and cucumbers. Wheat is followed by barley and than by industrial crops and oilseeds. In terms of production value, wheat constitutes the largest share in cereals (%63), followed by barley and maize (18% and 12% respectively). While sugar beet, cotton and tobacco constitute almost all the produced value of industrial crops (49%, 35%, 17% respectively), chickpeas, dry-beans and lentils are the important pulses, while sunflower and potato are the two important oil and tuber crops, respectively.
1.2.2 Livestock
Livestock production is an important element of the agricultural sectors of the MPC; livestock products constitute a significant part of the traditional diets in these countries and livestock breeding has a long standing tradition that dates back to the ancient times. Turkey and Egypt are the countries with the highest value of livestock production (Table 1.12). Morocco, Syria and Algeria that follow, produce only half the value of Egypt. The value of livestock production in the remaining countries is much lower, with the smallest figures exhibited by Jordan and Lebanon.
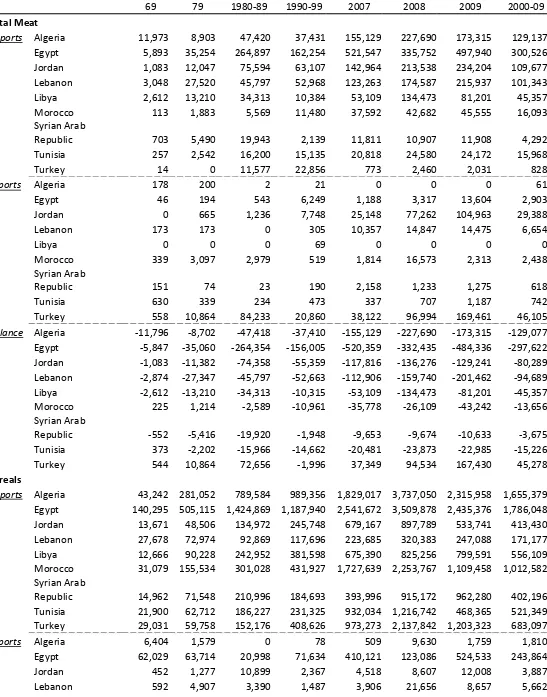
For all countries but Syria, poultry meat is the most important meat product produced in terms of output volumes (Table 1.13). The share of poultry meat ranges from 41% in Syria to as much as 81% in Jordan. Beef & buffalo and sheep & goat meat are the other two major meat products and in all countries their share are rather similar. The only exceptions are Syria, where beef meat production is quite low and Egypt and Lebanon where sheep and goat production represents only a small fraction of total meat production.
Milk production is by far the highest in Turkey and Egypt, whereas Jordan, Lebanon and Libya have quite low production volumes. Egypt produces almost 70% of the total cheese production in the MPC included in the study, while roughly similar is the situation regarding egg production and milk production: Turkey produces around 55% and 62% of the total output volumes, respectively.
animals. Traditional mixed farms produce crops and livestock for both home consumption and sales. Livestock, under this system, is relatively intensive and concentrated on smaller, subsistence-oriented farms in the irrigated cropping region. This intensive village-based system predominates for cattle, buffalo, and small ruminants and produce 80 % of all beef, 90% of all milk and dairy products, and 70% of all mutton. Then, the success or failure of Egypt’s livestock development program depends upon their ability to influence traditional smaller farmer’s decisions on investment in livestock. The traditional system still accounts for an estimated 75 percent of total milk production.
The other principal production system is the commercial buffalo dairy herd. These units, up to mid of eighties were known commonly as “Zaraba herds” or “flying herds”. They are located on the outskirts of major urban centers, such as Cairo and Alexandria. Normally, there is no breeding or production of replacement animals from within these herds themselves. Rather, lactating buffalo cows are purchased from outlying rural villages, and these animals are sold for slaughter once they have completed lactation.
Recently, another transaction system has been raised. The dairy buffalo operator replaces his buffalo cow during the year, through agents, in order to keep his milk supply stable over the entire year. The culled buffalo usually returns to traditional herd, where the breeding system is found. This system composes of, relatively, small commercial dairy herds. Herds of 15 to 30 animals are common, while somewhat larger herds also exist. Most feeds are purchased and consist of clover, crop residues from nearby farms as will as food processing wastes and feed concentrates purchased through private and government channels. These herds account for an estimated 11 percent of milk animals and 13 percent of milk production.
The extensive Bedouin system provides 30% of all mutton, which is destined primarily for export. The intensive commercial dairy system operates large and medium scale farms that, with 30,000 to 40,000 Holstein cattle in production, contribute 10% of all milk and dairy products.
Livestock production in Jordan was limited in the late 1980s. Jordan had about 35,000 head of cattle but more than 1 million sheep and 500,000 goats, and the government planned to increase their numbers. The annual production of red meat ranged between 10,000 and 15,000 metric tons, which covered less than 33 percent of domestic consumption. A major impediment to increase livestock production was the high cost of imported feed. Jordan imported cereals at high cost for human consumption, but imported animal feed was a much lower priority. Likewise, the arid, rain-fed land that could have been used for grazing or for fodder production was set aside for wheat production. Jordan was self-sufficient, however, in poultry meat production (about 35,000 metric tons) and egg production (about 400,000 eggs), and exported these products to neighbouring countries, up to late 1980's.
off-take rate may surpass 70% in sheep herds. Goats are more resistant to drought conditions. Therefore, the off-take rate would stay within norms, i.e. up to 45%.
Broiler production and commercial laying hens performance in Jordan is another livestock activity in Jordan. There was a trend of declining in both broiler and table eggs productivity over the last decade, which made the dressing weight per broiler around 1 Kg, while this industry standard surpassed 1.5 kg. In addition, table eggs yield per hen decreases from 245 pieces to around 190, while the modern industry performs an average of 250 per laying hen.
Libya's animal husbandry which includes mainly sheep and goats and to a smaller degree cattle and camels, has suffered from the international sanctions that were imposed on the past Libyan Government during the nineties, thus limiting imports of animal feed on which local livestock activities depend heavily. For example, the production of beef and veal dropped from 22,100 metric tons in 1994 to 2,100 metric tons in 1998. Apart from these imports, the main source of feed is rangeland which amounts to two and a half times the arable land (5%) but provide a quite variable supply of feedstuffs.
Concerning sea food production, one notices the low annual catch (34,500 metric tons in 1997) despite the richness of its waters in exportable fish (e.g., tuna and sardines). For comparison purposes, neighbouring Tunisia which has a Mediterranean coast of a similar length produces about 3 times more sea food commodities. Low investments in fishing boats, ports, and processing facilities are major obstacles to the growth of sea food production. The country has 1 major fishing port (Zlitan), 1 tuna plant, and 2 sardine factories with small processing capacities (1,000 metric tons per year each).
To some extent, these trends of low agricultural performance in Libya are not surprising. The advent of oil wealth provided many Libyan peasants with opportunities to engage in less exacting and more remunerative work in the urban areas, resulting in a huge rural migration to the cities. The large number of people that used to be engaged in agriculture prior to 1960 reflected, therefore, not a thriving agricultural economy but merely the absence of attractive alternatives, particularly in comparison with the oil sector.
In Morocco, in 2009, the red meat production totalled 425,000, thus registering an increase of 6% over 2008. This increase is due to livestock restocking following good weather conditions that prevailed during 2008-09 campaign and that would have led many breeders to limit their sales. For the period 2005-09, beef takes an average of 44% against 30% and 5% respectively for sheep and goat meat. The rest is compound of offal and camel and equine meat.
Poultry meat production registered a steady increase since the early 1990s because of the rapid development of the poultry industry. In 2009, production increased to 490,000 T or 363% and 136% over 1985 and 2005 yield respectively. Poultry farming has also produced nearly 3.9 billion eggs. This quantity is relatively stagnant since 2007, probably because of saturation of the market demand.
Livestock and animal production in Syria, make up a very important component of the agricultural output. It offers a vital nutritional source, employment opportunities, and contributes as well to improving farming efficiency when optimal integration between plant and animal production is achieved. Furthermore, livestock represents a form of saving for rural households. Sheep breeding plays a central role in the subsistence and social organization of the Bedouin population.
The Syrian main livestock is represented by sheep, goats, cattle and poultry. The numbers of livestock grew positively between 1999 and 2008. The average annual growth rate for cattle, sheep, goat, and poultry were respectively 4%, 9.8%, 8.2%, and 4.7%.
In 2007, the value of animal production in Lebanon represented 27% of the total agricultural production; plant and animal. In 2007, animal production witnessed remarkable increase amounting LL789 billion, increasing from LL608 billion in 2006.
Animal production consists of red meat of different kinds, poultry, fish, milk and dairy products, eggs, and honey. Local production of animal products satisfies only a fraction of domestic consumption, which is covered by imports. Furthermore, domestic animal production faces fierce competition from imported products.
Broad categories of livestock activities are quite universal in Tunisia. The structure of the activities and herds are however specific. One notices, for example, the almost even breakdown in terms of cattle stocks between pure breeds and cross breeds, in spite of the limited adaptation of imported pure breeds to most of the production zones of the country which are typically characterized by weak and variable feedstuff supplies. Past policies consisting of subsidizing feed inputs explain the relative overdevelopment of livestock production based on imported certain pure breeds with limited adaption to the conditions of the country. One also notices the development of the white meat industry which took place over recent decades, thus splitting the present meat supply mix for the Tunisians between 40% red and 60% white. Just like cereals crops, livestock activities exhibit low physical productivities, both in terms of meat and milk, to withstand increasing international competition.
Animal husbandry has a significant role in Turkey’s agricultural sector. The country provides larger areas for grazing animals. The number of cattle totals approximately 11 million; sheep around 24 million; and goats about 6 million. However, due to small herd sizes and unfavourable domestic agricultural policies, animal numbers went down over time. In addition, foot and mouth disease, socio-economic factors, such as the rapid migration of young farmers to cities and the increasing age of livestock farmers played an important role in the decrease as well however an improvement in animal numbers has been experienced since 2002. Poultry and beef is the most important meat product in Turkey in terms of production quantity and value. With the surge in domestic demand for poultry meat at the beginning of the 1990s, Turky has now become the world’s 11th largest poultry producer. Over the same period egg production reached about 60 million. This expansion was related both to the shortfall in red meat supplies and to a rising population with increasing incomes coupled with the affordability of poultry meat. The great bulk of the poultry output is (95%) is chicken meat and the rest is turkey meat. Sheep and goat meat is less important, though sheep and goat production is important on subsistence and semi-subsistence farms as well.
1.3 Agricultural sector structure
A study by FAO3 identified eight major farming systems in the MENA region as depicted in the following map:
Source: FAO (http://www.fao.org/DOCREP/003/Y1860E/y1860e05.htm#P3_31)
Irrigated Farming System
The system contains both large and small-scale irrigation schemes. The large-scale subsystem contains a total population of 80m and an agricultural population of 16m. It encompasses 8.1m ha of cultivated land that is almost totally irrigated and schemes are found across all zones. They include high-value cash and export cropping and intensive vegetable and fruit cropping. The small-scale irrigation subsystem also occurs widely across the region and although not as important in terms of population, it is a significant element in the survival of many people in arid and remote mountain areas. Owner-occupiers or tenants typically farm very small units – from 0.02 to 1ha – often within an area of larger, rainfed systems. Major crops are mixed cereals, fodder and vegetables. The prevalence of poverty within both subsystems is moderate.
Highland Mixed Farming System
This system is the most important in the region in terms of population – with 27m engaged in agriculture – but contains only 7 percent of the land area. Out of a total area of 74m ha, cultivated area covers 22m ha, with nearly 5m ha irrigated. There are two subsystems; one dominated by rainfed cereal and legumes plus tree crops (fruits and olives) on terraces, while the second is based on livestock (mostly sheep) on communally managed lands. Poverty is extensive, as markets are often distant, infrastructure is poorly developed and the degradation of natural resources is a serious problem.
Dixon et al. (2001).Farming Systems and Poverty. Improving Farmers’ Livelihoods In a Changing World,
Rainfed Mixed Farming System
The system has an agricultural population of 16m, but occupies only two percent of the regional land area, resulting in high population densities. Cultivated area is 14m ha, including tree crops and vines, with 8m cattle. Supplementary winter irrigation is now used on 0.6m ha of wheat and on summer cash crops. More humid areas are characterized by tree crops (olives and fruit), melons and grapes. There is some dry-season grazing of sheep migrating from the steppe areas. Poverty is moderate, but would be higher without extensive off-farm income from seasonal labour migration.
Dryland Mixed Farming System
The system is found in dry sub-humid areas and contains an agricultural population of 13m people with 17m ha of cultivated land. Population density tends to be lower than in the other main cultivated systems and average farm sizes are larger. The main rainfed cereals are barley and wheat, grown in a rotation involving an annual or two-year fallow. The risk of drought is high and considerable food insecurity exists. Livestock, including 6m cattle and a greater number of small ruminants, interact strongly with the cropping and fodder system. Poverty is extensive among small farmers
Pastoral Farming System
The Pastoral Farming System, mainly involving sheep and goats but also with some cattle and camels, is found across almost a quarter of the land area of the region - equivalent to around 250 million ha. It includes large areas of semiarid steppe lands, and is characterised by low population densities, with more densely populated areas around irrigated settlements. There are some 2.9 million ha of irrigated cropland scattered throughout the system, thus boosting the agricultural population - which is around eight million people - and helping to support a cattle population of 2.5 million. Strong linkages exist to other farming systems through the movement of stock, both through seasonal grazing of herds in more humid areas and through the sale of animals to large feedlots located in urban areas. Seasonal migration, which is particularly important as a risk minimisation measure, depends on the availability of grass, water and crop residues in neighbouring arable systems. Nowadays, pastoral herds are often partially controlled and financed by urban capital. Where water is available, small areas of crop production have been developed to supplement the diets and income of pastoral families. However, such sites are few and poverty within the system is extensive.
Sparse (Arid) Farming System
The Sparse (Arid) Farming System covers more than 60 percent of the region and includes vast desert zones. Approximately four million people (about five percent of the region's agricultural population) live within the system, and are concentrated in oases and a number of irrigation schemes (notably in Tunisia, Algeria, Morocco and Libya). About 1.2 million ha of irrigated cropland are utilised for the production of dates, other palms, fodder and vegetables. In addition, an estimated 2.7 million cattle, pastoralists within this system also raise camels, sheep and goats. The system provides opportunistic grazing for the herds of pastoralists, following scattered storms and in good seasons. The boundary between pastoral grazing and sparse agriculture systems is indistinct and depends on climatic conditions. Poverty within this system is generally low as population pressure is limited.
Coastal Artisanal Fishing System
technology and capital have been injected into the offshore fishing industry, the artisanal fishing system has contracted.
Urban Based Farming System
Throughout the region a small population of urban residents, estimated to be less than 6 million people, engage in small-scale production of horticultural and livestock products - notably fruit, vegetables and poultry. The contribution of this system to GADP is small at present, but the growth in livestock feedlots, fruit, and intensive vegetable production in urban areas may become increasingly important in the coming decades. This system sometimes has important linkages with peri-urban and rural production systems.
(Extracted from CEDARE 2009 and Dixon et al. 2001).
1.3.1 Farm Structure
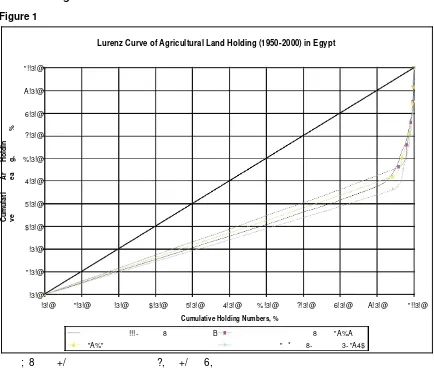
In general, the Egyptian farming system has two major features. It is so intensive in production and too fragmented in farm size pattern. The first Egyptian law of land reform was released in September 1953. It limited the land holding by 84 hectares for a family (parents and children less than 21 years old) and by 41 hectares for a single person. The second law was in 1969, which reallocated the land holding size to be one-half of the first law limits, i.e. 4o hectares per family holder and 20 hectares per a single holder. Between the two law eras there were other presidential decrees package named nationalization decrees in 1961 that put all companies and firms under the state management including the agricultural sector. The land market was completely liberalized in 1997 when the land reform law was cancelled, which had dramatic impacts on the land holding pattern.
In 1983, the average farm size in Jordan was 6.3 hectares; Data from the 1997 Agriculture Census suggests that the average size has fallen to 4.2 hectares. Jordan’s farm sector is composed primarily of farms of less than 30 dunum (3 hectares). The smallest farms are often found in the highlands where inheritance customs result in smaller and smaller holdings. Larger farms are located in the dry plains bordering the desert that occupies the eastern two-thirds of the country. Neither of these farms—the very smallest or the larger farms—are likely to be highly profitable unless water is available from ground or other sources
Cash crop farms dominate in the valleys along the western border. These farms produce vegetables, citrus fruits, or bananas under irrigation and sell the bulk of their products. They tend to be the more profitable than farms in other areas of the country and therefore they also tend to be early adopters in terms of technological advances. In irrigated areas of the highlands, farmers typically produce vegetables, fruits, and olives while some farmers are experimenting with cut flowers and other non-traditional agricultural products. Farmers in the irrigated highlands also sell the bulk of their output. In rainfed areas of the highlands (the area between the Jordan Valley and the plains bordering the desert), farmers typically produce cereals, olives, tobacco, grapes, apples, and nuts. Subsistence farms are usually the smallest holdings and are located in rain fed areas with few alternative employment opportunities. Most subsistence farmers produce both livestock and crops but primarily for family consumption