Munich Personal RePEc Archive
Price Discovery and Volatility Spillovers
in Indian Spot-Futures Commodity
Market
P., Srinivasan
Faculty of Economics, Christ University, Bangalore, India
17 May 2011
Online at
https://mpra.ub.uni-muenchen.de/47412/
Price Discovery and Volatility Spillovers in Indian
Spot-Futures Commodity Market
P Srinivasan*
The present paper examines the price discovery process and volatility spillovers in Indian spot-futures commodity markets through Johansen cointegration, Vector Error Correction Model (VECM) and the bivariate EGARCH model. The study uses four futures and spot indices of the Multi Commodity Exchange of India (MCX), representing relevant sectors like agriculture (MCXAGRI), energy (MCXENERGY), metal (MCXMETAL), and the composite index of metals, energy and agro-commodities (MCXCOMDEX). Johansen cointegration test confirms the presence of long-term equilibrium relationships between the futures price and its underlying spot price of the commodity markets. The VECM shows that commodity spot markets of MCXCOMDEX, MCXAGRI, MCXENERGY and MCXMETAL play a dominant role and serve as effective price discovery vehicle, implying that there is a flow of information from spot to futures commodity markets. Besides, the bivariate EGARCH model indicates that although bidirectional volatility spillover persists, the volatility spillovers from spot to the futures market are dominant in case of all MCX commodity markets.
* Assistant Professor, Department of Economics, Christ University, Hosur Road, Bangalore 560029, Karnataka, India. E-mail: Srinivasan.palamalai@christuniversity.in
Introduction
The evolution of the organized commodity futures market in India commenced in 1875 with the setting up of the Bombay Cotton Trade Association Ltd. Following widespread discontent among leading cotton mill owners and merchants over the functioning of the Bombay Cotton Trade Association, a separate association, Bombay Cotton Exchange Ltd., was constituted in 1983. Futures trading in oilseeds originated with the setting up of the Gujarati Vyapari Mandali in 1900, which carried out futures trading in groundnuts, castor seeds and cotton. The Calcutta Hessian Exchange Ltd. and the East India Jute Association Ltd. were set up in 1919 and 1927 respectively for futures trade in raw jute. In 1921, futures in cotton were organized in Mumbai under the auspices of East India Cotton Association (EICA). Before the Second World War broke out in 1939, several futures markets in oilseeds were functioning in the states of Gujarat and Punjab. Futures markets in Bullion began in Mumbai in 1920, and later, similar markets were established in Rajkot, Jaipur, Jamnagar, Kanpur, Delhi and Kolkata. In due course, several other exchanges were established in the country, facilitating trade in diverse commodities such as pepper, turmeric, potato, sugar and jaggery.
A D Shroff and also selected committees of two successive parliaments, and finally, in December 1952, the Forward Contracts (Regulation) Act was enacted. The Forward Contracts (Regulation) rules were notified by the central government in 1954. The futures trade in spices was first organized by the India Pepper and Spices Trade Association (IPSTA) in Cochin in 1957. However, in order to monitor the price movements of several agricultural and essential commodities, futures trade was completely banned by the government in 1966. Subsequent to the ban of futures trade, many traders resorted to unofficial and informal trade in futures. However, in India’s liberalization epoch as per the June 1980 Khusro Committee’s recommendations, the government re-introduced futures on selected commodities, including cotton, jute, potatoes, etc.
Following the introduction of economic reforms in 1991, the Government of India appointed an expert committee on forward markets under the chairmanship of K N Kabra in June 1993. The committee submitted its report in September 1994, championing the re-introduction of futures, which were banned in 1966, and expanding its coverage to agricultural commodities, along with silver. In order to boost the agricultural sector, the National Agricultural Policy 2000 envisaged external and domestic market reforms and dismantling of all controls and regulations in the agricultural commodity markets. It also proposed an expansion of the coverage of futures markets to minimize the wide fluctuations in commodity prices and for hedging the risk arising from extreme price volatilities. An efficient and well-organized commodities futures market is generally acknowledged to be helpful in price discovery for traded commodities.
The primary objectives of any futures exchange are authentic price discovery and an efficient price risk management. The beneficiaries include those who trade in the commodities being offered in the exchange as well as those who have nothing to do with futures trading. It is because of price discovery and risk management through the existence of futures exchanges that a lot of businesses and services are able to function smoothly. Based on inputs regarding specific market information, the demand and supply equilibrium, weather forecasts, expert views and comments, inflation rates, government policies, market dynamics, hopes and fears, buyers and sellers conduct trading at futures exchanges. This transforms into continuous price discovery mechanism. The execution of trade between buyers and sellers leads to assessment of fair value of a particular commodity that is immediately disseminated on the trading terminal.
The purpose of the present study is to examine the price discovery process and volatility spillover between the commodity spot and futures markets in India. The essence of spot and futures market volatility in price discovery functions hinges on whether new information is first reflected in futures market or in spot markets. It has been argued, that the lead-lag relationship between spot and futures prices series can be attributed to one or more market imperfections like differences in transaction cost, liquidity differences between the two market, short-selling restriction, dividend uncertainties, non-stochastic interest rate, different taxation regimes and differences in margin requirements. The price discovery and volatility spillovers between spot and futures prices series exist either in unidirectional way or in both directions, depending on the market under investigation. The present study assumes significance in the sense that it enables to determine which market is more efficient in processing and reflecting of new information. The study will throw light on the possibility of acting spot or future prices as an efficient price discovery vehicle, and this will be immensely useful for the traders to hedge their market risk. Besides, the study provides vital clues to the arbitrageurs, who are formulating their trading strategies based on market imperfections. Further, most of the studies have been carried out in developed markets and supported the view that futures market plays a leading role in price discovery and volatility spillover process by reflecting new information faster than the spot market. This study is very useful for the investors and portfolio managers who are interested in developing effective trading and hedging strategies in developing commodity markets like India. Besides, the findings will be useful to the regulators to formulate policy and implement control measures to enhance the integrity and stability of the Indian commodity markets.
Against this background, the present paper examines the price discovery process and volatility spillovers in Indian spot-futures commodity markets through Johansen cointegration, Vector Error Correction Model (VECM) and the bivariate EGARCH model. This study considers the four futures and spot indices of Multi-Commodity Exchange of India (MCX) representing relevant sectors, like agriculture (MCXAGRI), energy (MCXENERGY), metal (MCXMETAL), and the composite index of metal, energy and agro-commodities (MCXCOMDEX). The remainder of the paper is organized as follows: it provides a review of the related literature, followed by a description of the methodology and data used for empirical analysis. Subsequently, it discusses the empirical results, and offers the conclusion.
Review of Literature
equilibrium. Theodossiou and Lee (1993) observed statistically significant mean and volatility spillovers between some of the markets in the US, UK, Canada, Germany and Japan. Koutmos and Booth (1995) studied the linkages between the developed markets and concluded that the volatility transmission process was asymmetric. Booth et al. (1997) examined the price and volatility spillovers in Scandinavian stock markets, viz., Danish, Norwegian, Swedish, and Finnish stock markets for the period May 2, 1988 to June 30, 1994 by employing the multivariate EGARCH model. They found that volatility transmission was asymmetric; significant price and volatility spillovers exist among the markets but they are few in number. Kanas (2000) studied the spillover effect between stock returns and exchange rate for six countries and indicated that the strength of the volatility spillovers appear to have increased since the October 1987 crash. Thomas and Karande (2001) analyzed price discovery in India’s castor seed market in Ahmedabad and Mumbai, by using daily closing data on futures and spot prices, which span from May 1985 to December 1999. They found that out of four, three seasonal contracts in Mumbai futures prices lead the Ahmedabad futures prices, while the March contract in Ahmedabad futures prices lead the former one. Assoe (2001) investigated the linkage between stock and foreign exchange markets and found negative mean spillover with the absolute value being very small relative to the influence of exchange rate fluctuations on the stock market. Moosa (2002) re-examined the price discovery function and risk transfer in crude oil market by using Garbade and Silber’s (1983) model. The study used the daily data of spot and one-month futures prices of West Texas Intermediate (WTI) crude oil covering the period from January 2, 1985 to July 1996. He found that price discovery function was performed in futures market. Kumar and Sunil (2004) investigated the price discovery in six Indian commodity exchanges for five commodities. They found inability on part of the futures market to fully incorporate information and confirmed inefficiency of futures market.
showed that the Nifty futures had no influence on the spot Nifty. Besides, the casual relationship test in the commodity market showed that gold futures price influenced the spot gold price, but the opposite was not true. Srinivasan (2009) examined the price discovery mechanism in the NSE spot and futures market. The empirical analysis was conducted for the daily data series from June 12, 2000 to September 12, 2008. The results reveal that there exists a long-run relationship between Nifty spot and Nifty futures prices. Further, the results confirmed the presence of a bidirectional relationship between the Nifty spot and Nifty futures market prices in India. It can, therefore, be concluded that both the spot and futures markets play the leading role through price discovery process in India and are said to be informationally efficient and react more quickly to each other. Iyer and Pillai (2010) had examined whether futures market plays a dominant role in the price discovery process. The rate of convergence of information from one market to another is analyzed to infer the efficiency of futures as an effective hedging tool. They used a two-regime Threshold Vector Autoregression (TVAR) model for six commodities. They found that price discovery process occurs in the futures market in five out of six commodities. However, the rate of convergence of information is slow, particularly in the non-expiration weeks. For copper, gold and silver, the rate of convergence is almost instantaneous during the expiration week of the futures contract affirming the utility of futures contracts as an effective hedging tool. In case of chickpeas, nickel and rubber the convergence worsens during the expiration week indicating the non-usability of these futures contracts for hedging. Shihabudheen and Padhi (2010) examined the price discovery mechanism and volatility spillover effect for six Indian commodity markets, namely, gold, silver, crude oil, castor seed, jeera and sugar. The study results supported that futures price acts as an efficient price discovery vehicle, except in the case of sugar. In case of sugar, volatility spillover exists from spot to futures.
From the existing literature, it appears that even though spot and futures markets react to the same information, the major question is which market reacts first. Considerable volume of research has been conducted on the subject, but still there exist conflicting evidences in the literature regarding the price discovery mechanism and volatility spillover effects. Besides, the literature pertaining to spillover effect at international level is quite unlimited. But, as far as India is concerned only a few notable studies have made an attempt on the Indian commodity market. Thus, the present paper attempts to examine the price discovery mechanism and volatility spillover effects in Indian spot-futures commodity markets.
Methodology and Data
verify the stationarity of the data series. Further, the necessary lag length of the data series is selected on the basis of Akaike’s Information Criteria (AIC) and Schwarz Information Criteria (SIC). Once the data series are found to be integrated in an identical order, the study employs Johansen’s (1988) cointegration test to examine the long-run equilibrium relationship among the variables.
If spot and futures prices are cointegrated, then causality must exist at least in one direction (Granger, 1986). Besides, Ghosh (1993), Lien and Luo (1994) and Lien (1996) argued that if the two price series are found to be cointegrated, then there exist valid error correction representations of the price series that includes short-term dynamics and long-run information. For this purpose, the causality between spot and futures prices is estimated by using the following VECM:
1 1 1 i i st t s i t si i t si st S F Z
S
...(1)
n i n i ft t f i t fi i t fi ft S F Z
F 1 1 1 ...(2)
where s and f are intercepts and stand ftare white-noise disturbance terms. s, f,s,
f,s and f are parameters. Zt–1 is the Error-Correction Term (ECT), which measures how the dependent variable adjusts to the previous period’s deviation from long-run equilibrium:
1 1
1
t t
t S F
Z ...(3)
where is the cointegration vector and is the intercept. The two-variable error correction model expressed in Equations (1) and (2) is a bivariate VAR(n) model in first difference augmented by the error-correction terms, sZt–1 and fZt–1. The coefficients s and
f are interpreted as the speed of adjustment parameters. The larger the s, the greater the response of St to the previous period’s deviation from long-run equilibrium.
The VECM [Equations (1) and (2)] provides a framework for valid inference in the presence of I(1) variable. Moreover, the Johansen (1988) procedure provides more efficient estimates of the cointegrating relationship than the Engle and Granger (1987) estimator (Gonzalo, 1994). Also Johansen (1988) tests are shown to be fairly robust to presence of non-normality (Cheung and Lai, 1993) and heteroscedasticity disturbances (Lee and Tse, 1996). Besides, the present study uses the bivariate EGARCH(1, 1) model to examine the volatility spillover mechanism. Although the GARCH-type models are popular in modeling the volatility process in financial series, the empirical results investigated provide evidence that the EGARCH model can more accurately explain the volatility dynamics (Ramaprasad, 2001; and Clinton and Michael, 2002). Thus, the present study proposes the following bivariate EGARCH(1, 1) model to examine the volatility spillover mechanism:
t
ij it jt
tt s
t f
t 1 N , ,
, , , , 0 ~
…(4)
21 , 2 1 , 2 1 1 1 ,
2 2 ln ln
ln
s t s ft
t t s t l t s s t
s
…(5)
21 , 2 , 2 1 1 1 ,
2 2 ln ln
ln
f t l f st
t t f t l t f f t
f
…(6)
The unautocorrelated residuals, f,t and s,t in Equation (4) are obtained from the VECM [Equations (1) and (2)], and t–1is the information set at t–1. Equations (4) to (6) are then simultaneously estimated by maximizing the log-likelihood function:
T
t t t t tL
1
1 ,
ln
…(7)
where is the 13x1 parameter vector of the model.
This two-step approach (the first step for the VECM and the second step for the bivariate EGARCH model) is asymptotically equivalent to a joint estimation of the VECM and EGARCH model (Greene, 1997). In practical sense, a large number of parameters should be involved in estimating VECM and EGARCH model simultaneously in one step and it will be an intricate task. Moreover, for estimating the volatility spillover the residuals of ECT should be included in the conditional variance equation. Otherwise, the model will be misspecified and the residuals obtained in VECM will be biased.
Empirical Results and Discussion
Unit Root and Cointegration Tests
Augmented Dickey-Fuller test was employed to test the stationarity of the spot and futures price series of commodity markets, viz., MCXCOMDEX, MCXAGRI, MCXENERGY and MCXMETAL, and the results are presented in Table 1. The results reveal that the data series of selected commodity markets are stationary at the first order level, and hence they are integrated in the order I(1). This finding is in line with many earlier studies on time series properties of price series.
Name of the MCX Variables Levels First Difference Inference on
Commodity Indices Integration
MCXAGRI AGRISPOT –0.834 –36.676*
I(1)
AGRIFUTURES –1.012 –20.974*
MCXCOMDEX COMDEXSPOT –2.054 –38.307*
I(1)
COMDEXFUTURES –2.129 –50.726*
MCXENERGY ENERGYSPOT –2.179 –35.090*
I(1)
ENERGYFUTURES –2.126 –35.410*
MCXMETAL METALSPOT –2.097 –17.159*
I(1)
METALFUTURES –2.204 –17.073*
[image:9.595.106.491.253.435.2]Note: * indicates significance at 1% level. Optimal lag length is determined by SIC for the Augmented Dickey-Fuller test.
Table 1: Results of Augmented Dickey-Fuller Test for Unit Root
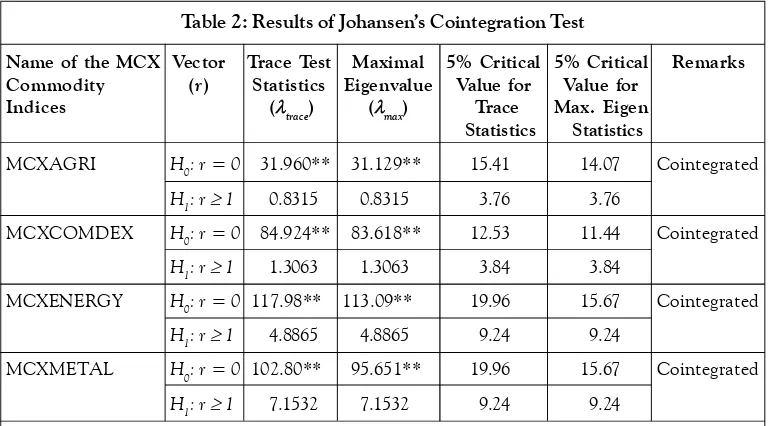
Johansen’s cointegration test was performed to examine the long-run relationship between the MCX spot and futures commodity market prices and the results are presented in Table 2. The results of Johansen’s maximum eigen (max) and trace statistics (trace) indicate the presence of one cointegrating vector between the MCX spot and futures commodity market prices at 5% level respectively.
Taking into account the results of both the tests, we can reject the null hypothesis of presence of no cointegrating vector and accept the alternative hypothesis of presence of at least one cointegrating vector. Since there are two variables, we can conclude that only one cointegration relationship exists between spot and futures prices of the respective MCX commodity markets. We can, therefore, proceed with the estimation of a VECM. It can be concluded that the spot and futures prices of respective MCX commodity markets lead in the long run.
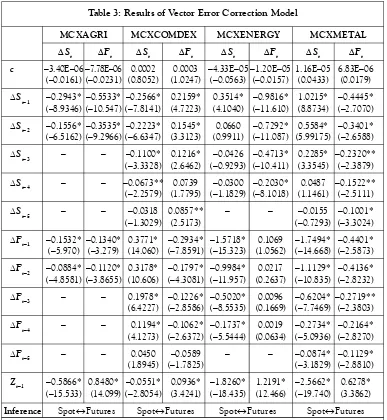
Vector Error Correction Model
provide some insight into the adjustment process of spot and futures prices towards equilibrium in all types of contracts. The results show that coefficients of the ECTs in the spot equations (s) of all respective commodity markets are statistically significant and negative, and also the coefficients of the ECTs in the futures equations (f) are statistically significant, suggesting a bidirectional error correction. However, the ECT in the futures equation is greater in magnitude than that of the spot equation. This implies that when the cost-of-carry relationship is perturbed, it is the futures price that makes the greater adjustment in order to re-establish the equilibrium. In other words, the spot price leads the futures price in price discovery in case of all MCX commodity markets considered in this study, i.e., the ECT represents a mean-reverting price process.
The empirical findings reveal that the spot commodity markets of MCXCOMDEX, MCXAGRI, MCXENERGY and MCXMETAL play a dominant role and serve as an effective price discovery vehicle. This may be due to the fact that MCX commodity markets, that represent relevant sectors are more innovative and this enables them to expose all the available new information with respect to the price of the commodities and investors’ behavior in the market. This implies all the investors are able to realize their expected future price of the spot price due to efficiency of the commodity markets. This shows that spot markets have the capability to expose all the new information through the channel of its innovation. The spillovers of certain information take place from spot market to futures market in case of all the commodity indices in MCX. The study results suggest that the spot markets serve as a focal point of information assimilation for large number of buyers and sellers. Market agents may depend on price changes in the spot
Name of the MCX Vector Trace Test Maximal 5% Critical 5% Critical Remarks
Commodity (r) Statistics Eigenvalue Value for Value for
Indices (trace) (max) Trace Max. Eigen
Statistics Statistics
MCXAGRI H0: r = 0 31.960** 31.129** 15.41 14.07 Cointegrated
H
1: r 1 0.8315 0.8315 3.76 3.76
MCXCOMDEX H0: r = 0 84.924** 83.618** 12.53 11.44 Cointegrated
H1: r 1 1.3063 1.3063 3.84 3.84
MCXENERGY H0: r = 0 117.98** 113.09** 19.96 15.67 Cointegrated
H1: r 1 4.8865 4.8865 9.24 9.24
MCXMETAL H0: r = 0 102.80** 95.651** 19.96 15.67 Cointegrated
H1: r 1 7.1532 7.1532 9.24 9.24
[image:10.595.106.492.123.336.2]Note:** indicates significance at 5% level; the significance of the statistics is based on 5% critical values obtained from Johansen and Juselius (1990); r is the number of cointegrating vectors; H0 represents the null hypothesis of presence of no cointegrating vector; and H1 represents the alternative hypothesis of presence of cointegrating vector.
market when making their own trading decisions. These findings are in accordance with previous studies on futures markets. Chan et al. (1991), Chan (1992), and Wahab and Lashgari (1993), amongst others, suggest that there is a bidirectional relationship between derivatives and spot returns.
Bivariate EGARCH Model and Volatility Spillover
A bivariate EGARCH(1, 1) model was employed to investigate, how news from one market affects the volatility behavior of another market. Before estimating the EGARCH model, it is necessary to check the model adequacy by performing the diagnostic tests.
St Ft St Ft St Ft St Ft
c –3.40E–06 –7.78E–06 0.0002 0.0003 –4.33E–05 –1.20E–05 1.16E–05 6.83E–06 (–0.0161) (–0.0231) (0.8052) (1.0247) (–0.0563) (–0.0157) (0.0433) (0.0179) St–1 –0.2943* –0.5533* –0.2566* 0.2159* 0.3514* –0.9816* 1.0215* –0.4445*
(–8.9346) (–10.547) (–7.8141) (4.7223) (4.1040) (–11.610) (8.8734) (–2.7070) St–2 –0.1556* –0.3535* –0.2223* 0.1545* 0.0660 –0.7292* 0.5584* –0.3401* (–6.5162) (–9.2966) (–6.6347) (3.3123) (0.9911) (–11.087) (5.99175) (–2.6588) St–3 – – –0.1100* 0.1216* –0.0426 –0.4713* 0.2285* –0.2320** (–3.3328) (2.6462) (–0.9293) (–10.411) (3.3545) (–2.3879) St–4 – – –0.0673** 0.0739 –0.0300 –0.2030* 0.0487 –0.1522**
(–2.2579) (1.7795) (–1.1829) (–8.1018) (1.1461) (–2.5111) St–5 – – –0.0318 0.0857** – – –0.0155 –0.1001* (–1.3029) (2.5173) (–0.7293) (–3.3024) Ft–1 –0.1532* –0.1340* 0.3771* –0.2934* –1.5718* 0.1069 –1.7494* –0.4401* (–5.970) (–3.279) (14.060) (–7.8591) (–15.323) (1.0562) (–14.668) (–2.5873) Ft–2 –0.0884* –0.1120* 0.3178* –0.1797* –0.9984* 0.0217 –1.1129* –0.4136* (–4.8581) (–3.8655) (10.606) (–4.3081) (–11.957) (0.2637) (–10.835) (–2.8232) Ft–3 – – 0.1978* –0.1226* –0.5020* 0.0096 –0.6204* –0.2719**
(6.4227) (–2.8586) (–8.5535) (0.1669) (–7.7469) (–2.3803) Ft–4 – – 0.1194* –0.1062* –0.1737* 0.0019 –0.2734* –0.2164* (4.1273) (–2.6372) (–5.5444) (0.0634) (–5.0936) (–2.8270) Ft–5 – – 0.0450 –0.0589 – – –0.0874* –0.1129* (1.8945) (–1.7825) (–3.1829) (–2.8810)
Zt–1 –0.5866* 0.8480* –0.0551* 0.0936* –1.8260* 1.2191* –2.5662* 0.6278* (–15.533) (14.099) (–2.8054) (3.4241) (–18.435) (12.466) (–19.740) (3.3862)
Inference SpotFutures SpotFutures SpotFutures SpotFutures
[image:11.595.105.492.122.542.2]Note: Optimal lag length is determined by SIC; Ft and St are the futures and spot market prices respectively; * and ** denote the significance at 1% and 5% level, respectively; and parentheses show t-statistics.
Table 3: Results of Vector Error Correction Model
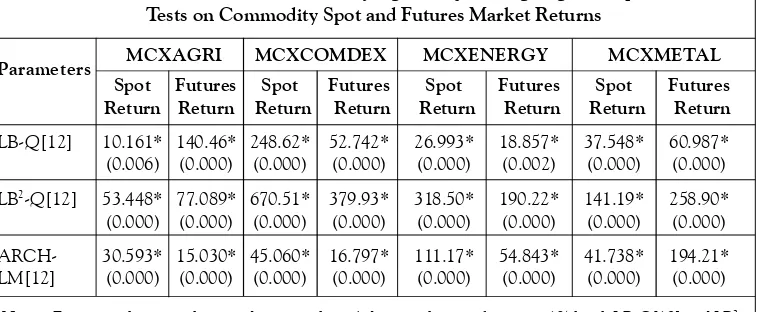
Table 4 reports the Q-statistics of Ljung-Box (LB) test for the standardized residuals and squared standardized residuals conducted up to 12 lags. According to McLeod and Li (1983), a causal examination of the sample autocorrelation functions of the mean equation squared residuals for a significant Q-statistic at a given lag can be used to infer the presence of ARCH effects. The LB Q-statistics at a given lag k is a test statistic for the null hypothesis that there is no autocorrelation up to order k. It is common to test serial correlation within squared values of a distribution as it can be indicative of the presence of conditional heteroscedasticity (Bollerslev, 1986). Also, examining absolute returns can be of assistance for the same reason (Ding et al., 1993). The tests results suggest that the standardized residuals and squared standardized residuals are autocorrelated in case of all MCX spot and futures commodity market returns series, thus confirming the presence of autocorrelation and ARCH effects in the time series analyzed.
Furthermore, the Engle (1982) ARCH-LM test was conducted in order to test the null hypothesis of no ARCH effects and its results are reported in Table 4. The test statistics are highly significant at 1% level for 12 lags, confirming the existence of significant ARCH effects on the spot and futures return data series of MCX commodity markets. Hence, the bivariate EGARCH model capable of Generalized Error Distribution (GED) is deemed fit for modeling the spot and futures return volatility of the commodity markets. Further, the bivariate EGARCH model is capable of capturing, at least partially, the leptokurtosis of a non-conditional return distribution of an economic element as well as the valuable information about the dependence among the squared values of return (Engle and Ng, 1993). The bivariate EGARCH model was considered to be the most parsimonious and appropriate representation of the conditional variance of returns in line with many previous studies. Table 5 shows the estimates of bivariate EGARCH model
Spot Futures Spot Futures Spot Futures Spot Futures
Return Return Return Return Return Return Return Return
LB-Q[12] 10.161* 140.46* 248.62* 52.742* 26.993* 18.857* 37.548* 60.987* (0.006) (0.000) (0.000) (0.000) (0.000) (0.002) (0.000) (0.000)
LB2-Q[12] 53.448* 77.089* 670.51* 379.93* 318.50* 190.22* 141.19* 258.90*
(0.000) (0.000) (0.000) (0.000) (0.000) (0.000) (0.000) (0.000)
ARCH- 30.593* 15.030* 45.060* 16.797* 111.17* 54.843* 41.738* 194.21* LM[12] (0.000) (0.000) (0.000) (0.000) (0.000) (0.000) (0.000) (0.000)
Note: Figures in the parentheses indicate p-values; * denotes the significance at 1% level. LB-Q[12] and LB2
[image:12.595.111.492.313.469.2]-Q[12] represent Portmanteau Ljung and Box (1978) Q-statistics for the return and squared return series respectively. They test for existence of autocorrelation in return and squared return series for 12 lags respectively. L-Jung Box test statistic tests the null hypothesis of absence of autocorrelation. ARCH-LM[12] is a lagrange multiplier test for ARCH effects up to order 12 in the residuals.
Table 4: Results of Portmanteau Ljung-Box-Q and Lagrange Multiplier Tests on Commodity Spot and Futures Market Returns
MCXAGRI MCXCOMDEX MCXENERGY MCXMETAL
determining the volatility spillover mechanism that takes place between spot and futures commodity markets.
The coefficients of importance in the bivariate EGARCH(1, 1) model are s and f. The coefficient s (f) describes the volatility spillover from the futures (spot) to spot (futures) market. In Table 5, the corresponding volatility spillover coefficients are all significant at 1% level. However, the coefficients s is larger than the f in all the commodity markets, indicating that the spillovers from spot to futures are more significant than the ones in the opposite direction. Moreover, the spot markets play more important price discovery roles. These results are consistent with the price discovery results. Thus, all results indicate that spot contracts are more informationally efficient than the futures market in all commodity markets including relevant sectors like agriculture, energy, and metal.
To check the robustness of bivariate EGARCH(1, 1) model, the Ljung and Box (1978) test was conducted on the squared standardized residuals1. Further, the ARCH-LM
1 If the GARCH(1, 1) models are correctly specified and able to fit the sample data, the standardized residuals and
the squared standardized residuals should be iid normal. The Ljung-Box portmanteau test is used to test whether the GARCH model removes serial correlation from the original data (Bollerslev, 1986).
Spot Futures Spot Futures Spot Futures Spot Futures
i –16.260* –1.2377* –1.2181* –1.5691* –5.2679* –0.9219* –0.2439* –0.5010* (–54.893) (–12.759) (–10.578) (–10.481) (–22.782) (–17.825) (–5.7198) (–8.2686) i –0.0001 0.2080* 0.3949* 0.3922* 0.8148* 0.5088* 0.1495* 0.1472*
(–0.0102) (16.240) (14.784) (15.552) (22.278) (21.747) (12.395) (7.7102) i 0.1505* –0.1600 0.0014 –0.0071 0.3699* 0.0358 0.0170* 0.0104
(7.8976) (0.0153) (0.0645) (–0.3519) (12.654) (1.5648) (2.5633) (1.1664) i –0.6261* 0.8778* 0.8960* 0.8853* 0.3668* 0.9194* 0.9845* 0.9555* (–21.685) (87.149) (72.051) (68.487) (11.937) (125.64) (229.18) (173.73) i 8.9644* 12.576* 7.0284* 22.674* 4.0188* 13.788* 5.0599* 15.743* (10.109) (26.175) (20.583) (47.874) (11.475) (36.002) (7.9593) (13.460)
Residual Diagnostics
Q2[12] 0.2446 8.8181 9.2911 15.379 19.771 0.1198 13.830 1.0095
(0.939) (0.117) (0.678) (0.221) (0.101) (0.729) (0.312) (0.315)
ARCH- 0.0432 0.0225 1.5659 0.3313 0.0101 0.1193 1.9033 0.0737 LM[12] (0.8353) (0.8807) (0.1809) (0.5650) (0.9199) (0.7297) (0.1494) (0.7859)
Notes:Figures in parentheses are Z-statistics; * denotes significance at 1% level; Q(12) and Q2(12) represent
[image:13.595.106.490.342.610.2]the Ljung-Box Q-statistics for the model’s standardized and squared standardized residuals using 12 lags, respectively; and ARCH-LM[12] is a lagrange multiplier test for ARCH effects up to order 12 in the residuals.
Table 5: Empirical Results of Volatility Spillover
(Engle, 1982) test was employed to test the absence of any further ARCH effects. The LB
Q-statistics should not be statistically significant if the mean and variance equations are appropriately defined. Moreover, there should be no ARCH effect left in the normalized residuals. As can be seen from Table 5, the LB Q2(12) statistics at 12 lags indicate no
evidence of autocorrelation in the squared normalized residuals. Besides, the ARCH-LM tests indicate that no serial dependence persists in the squared residuals. Hence, the results suggest that bivariate EGARCH model is reasonably well specified and the most appropriate model to capture the ARCH (time-varying volatility) effects in the time series analyzed.
Conclusion
The present paper examined the price discovery process and volatility spillovers in Indian spot-futures commodity markets through Johansen cointegration, VECM and the bivariate EGARCH model. It used four futures and spot indices of MCX—MCXAGRI, MCXENERGY, MCXMETAL, and MCXCOMDEX. Johansen cointegration test confirms the presence of long-term equilibrium relationship between the futures price and its underlying spot price of the commodity markets. The VECM shows that commodity spot markets of MCXCOMDEX, MCXAGRI, MCXENERGY and MCXMETAL play a dominant role and serve as effective price discovery vehicle, implying that there is a flow of information from spot to futures commodity markets. Besides the bivariate EGARCH model indicates that, although bidirectional volatility spillover persists, the volatility spillovers from spot to the futures market are dominant in case of all MCX commodity markets.
The findings of this study have important implications to investors and portfolio managers who are interested in developing effective trading and hedging strategies between the MCX spot and futures markets. Besides, the findings are useful to regulators to formulate policy and implement control measures to enhance the integrity and stability of the MCX. In the present study, bidirectional volatility spillover is observed with stronger spillover from spot to futures. Whenever there is high volatility in stock market it will affect the futures market. An investor who is trading in commodity futures market should always watch out for volatility in the commodity spot market. From regulators’ point of view, whenever there is unexpected volatility in spot market, he should take necessary steps to curb the volatility. Otherwise the excess volatility in the spot market will spill over to futures market, thereby making the futures market unstable.❁
References
1. Assoe K (2001), “Volatility Spillovers Between Foreign Exchange and Emerging Stock Markets”, Cahier de Recherche 2001-04, CETAI, HEC-Montreal.
2. Bollerslev T (1986), “Generalized Autoregressive Conditional Heteroscedasticity”,
3. Booth G G, Martikainen T and Tse Y (1997), “Price and Volatility Spillovers in Scandinavian Markets”, Journal of Banking and Finance, Vol. 21, No. 6, pp. 811-823. 4. Chan K (1992), “A Further Analysis of the Lead-Lag Relationship Between the Cash Market and Stock Index Futures Market”, Review of Financial Studies, Vol. 5, No. 1, pp. 123-152.
5. Chan K, Chan K C and Karolyi A G (1991), “Intraday Volatility in the Stock Index and Stock Index Futures Markets”, Review of Financial Studies, Vol. 4, No. 4, pp. 657-684.
6. Cheung Y and Lai K (1993), “Finite Sample Sizes of Johansen’s Likelihood Ratio Tests for Cointegration”, Oxford Bulletin of Economics and Statistics, Vol. 55, No. 3, pp. 313-328.
7. Clinton W and Michael M (2002), “Cointegration Analysis of Metals Futures”,
Mathematics and Computers in Simulation, Vol. 59, Nos. 1-3, pp. 207-221.
8. Dickey D A and Fuller W A (1979), “Distribution of the Estimations for Autoregressive Time Series with a Unit Root”, Journal of the American Statistical Association, Vol. 47, No. 366, pp. 427-431.
9. Ding Z, Granger C W J and Engle R F (1993), “A Long Memory Property of Stock Market Returns and a New Model”, Journal of Empirical Finance, Vol. 1, No. 1, pp. 83-106.
10. Engle R F (1982), “Autoregressive Conditional Heteroscedasticity with Estimates of the Variance of United Kingdom Inflation”, Econometrica, Vol. 50, No. 4, pp. 987-1008.
11. Engel R F and Granger C W J (1987), “Cointegration and Error Correction Representation, Estimation and Testing”, Econometrica, Vol. 55, No. 2, pp. 251-276. 12. Engle R F and Ng V K (1993), “Measuring and Testing the Impact of News on
Volatility”, Journal of Finance, Vol. 48, No. 5, pp. 1749-1801.
13. Fu L Q and Qing Z J (2006), “Price Discovery and Volatility Spillovers: Evidence from Chinese Spot-Futures Markets”, China & World Economy, Vol. 14, No. 2, pp. 79-92.
14. Garbade K D and Silber W L (1983), “Dominant Satellite Relationship Between Live Cattle Cash and Futures Markets”, The Journal of Futures Markets, Vol. 10, No. 2, pp. 123-136.
15. Ghosh A (1993), “Hedging with Stock Index Futures: Estimation and Forecasting with Error Correction Model”, Journal of Futures Market, Vol. 13, No. 7, pp. 743-752. 16. Gonzalo J (1994), “Five Alternative Methods of Estimating Long-Run Equilibrium
17. Granger C (1986), “Developments in the Study of Cointegrated Variables”, Oxford Bulletin of Economics and Statistics, Vol. 48, No. 3, pp. 213-227.
18. Greene W H (1997), Econometric Analysis, 3rd Edition, Engelwood Cliffs, Prentice
Hall, NJ.
19. Hamao Y, Masulis R and Ng V (1990), “Correlations in Price Changes and Volatility Across International Stock Markets”, Review of Financial Studies, Vol. 3, No. 2, pp. 281-307.
20. Iyer V and Pillai A (2010), “Price Discovery and Convergence in the Indian Commodities Market”, Indian Growth and Development Review, Vol. 3, No. 1, pp. 53-61.
21. Johansen S (1988), “Statistical Analysis and Cointegrating Vectors”, Journal of Economic Dynamics and Control, Vol. 12, Nos. 2 & 3, pp. 231-254.
22. Johansen S and Juselius K (1990), “Maximum Likelihood Estimation and Inference on Cointegration: With Applications to the Demand for Money”, Oxford Bulletin of Economics and Statistics, Vol. 52, No. 2, pp. 169-210.
23. Kanas A (2000), “Volatility Spillovers Between Stock Returns and Exchange Rate Changes: International Evidence”, Journal of Business Finance and Accounting, Vol. 27, Nos. 3 & 4, pp. 447-467
24. Karolyi G A (1995), “A Multivariate GARCH Model of International Transmission of Stock Returns and Volatility: The Case of the United States and Canada”, Journal of Business & Economic Statistics, Vol. 13, No. 1, pp. 11-25.
25. Koutmos G and Booth G G (1995), “Asymmetric Volatility Transmission in International Stock Markets”, Journal of International Money and Finance, Vol. 14, No. 5, pp. 747-762.
26. Kumar S and Sunil B (2004), “Price Discovery and Market Efficiency: Evidence from Agricultural Future Commodities”, South Asian Journal of Management, Vol. 11, No. 2, pp. 27-49.
27. Lee T and Tse Y (1996), “Cointegration Tests with Conditional Heteroscedasticity”,
Journal of Econometrics, Vol. 73, No. 2, pp. 401-410.
28. Lien D (1996), “The Effect of the Cointegrating Relationship on Futures Hedging: A Note”, Journal of Futures Markets, Vol. 16, No. 7, pp. 773-780.
29. Lien D and Luo X (1994), “Multi-Period Hedging in the Presence of Conditional Heteroskedasticity”, The Journal of Futures Market, Vol. 14, No. 8, pp. 927-956. 30. Ljung G M and Box G E P (1978), “On a Measure of a Lack of Fit in Time Series
31. McLeod A I and Li W K (1983), “Diagnostic Checking ARMA Time Series Models Using Squared-Residual Autocorrelation”, Journal of Time Series Analysis, Vol. 4, No. 4, pp. 269-273.
32. Moosa I A (2002), “Price Discovery and Risk Transfer in the Crude Oil Futures Market: Some Structural Time Series Evidence”, Economic Notes, Vol. 31, No. 1, pp. 155-165.
33. Praveen D G and Sudhakar A (2006), “Price Discovery and Causality in the Indian Derivatives Market”, The IUP Journal of Derivatives Markets, Vol. 3, No. 1, pp. 22-29. 34. Ramaprasad B (2001), “Return and Volatility Dynamics in the Spot and Futures Markets in Australia: An Intervention Analysis in a Bivariate EGARCH-X Framework”, Journal of Futures Markets, Vol. 21, No. 9, pp. 833-850.
35. Shihabudheen M T and Padhi P (2010), “Price Discovery and Volatility Spillover Effect in Indian Commodity Market”, Indian Journal of Agricultural Economics, Vol. 65, No. 1, pp. 101-117.
36. Srinivasan P (2009), “An Empirical Analysis of Price Discovery in the NSE Spot and Future Markets of India”, The IUP Journal of Applied Finance, Vol. 15, No. 11, pp. 24-36.
37. Susmel R and Engle R F (1994), “Hourly Volatility Spillovers Between International Equity Markets”, Journal of International Money and Finance, Vol. 13, No. 1, pp. 3-25. 38. Theodossiou P and Lee U (1993), “Mean and Volatility Spillovers Across Major National Stock Markets: Further Empirical Evidence”, Journal of Financial Research, Vol. 16, No. 4, pp. 337-350
39. Thomas S and Karande K (2001), “Price Discovery Across Multiple Spot and Futures Markets”, IGIDR Working Paper, Mumbai, India, available at http//www.igidr.ac.in 40. Wahab M and Lashgari M (1993), “Price Dynamics and Error Correction in Stock
Index and Stock Index Futures Markets: A Cointegration Approach”, Journal of Futures Markets, Vol. 13, No. 7, pp. 711-742.
41. Zapata H, Fortenbery T R and Armstrong D (2005), “Price Discovery in the World Sugar Futures and Cash Markets: Implications for the Dominican Republic”, Staff Paper No. 469, Department of Agricultural and Applied Economics, University of Wisconsin-Madison.
42. Zhong M, Darrat A F and Otero R (2004), “Price Discovery and Volatility Spillovers in Index Futures Markets: Some Evidence from Mexico”, Journal of Banking and Finance, Vol. 28, No. 12, pp. 3037-3054.