ISSN Online: 2327-4344 ISSN Print: 2327-4336
Assessing the Impacts of Sea Level Rise Using
Existing Data
Frederick Bloetscher, Michael Wood
Department of Civil, Environmental and Geomatics Engineering, Florida Atlantic University, Boca Raton, FL, USA
Abstract
Local communities want to know the cost of improvements needed to their drainage system based on projected sea level rise. Prior research demonstrates that in coastal areas, groundwater will rise with sea level. As a result the combination of groundwa-ter levels and tidal data must be used to predict local impacts of sea level rise on the drainage system. However, it would appear to complicate the situation if the amount of data available for making sea level rise projections with groundwater is limited. The objectives of this task were to identify available data in a data limited communi-ty, compare the available data, assess the impact of sea level rise on the communicommuni-ty, and its impact on the stormwater system, identify vulnerable areas in the City, pro-vide an estimate of long-term costs for improvements, and propro-vide a toolbox of strategies to employ at the appropriate time. The project was conducted using Arc-GIS tools to import tidal, groundwater, topographic LiDAR and infrastructure im-provements into GIS software and performing analysis based on current data. The cost of improvements was based on applying actual 2015 construction costs in the subject comments across a larger vulnerable area. It was found that the data sources provided similar results, despite different timelines and dates so did not interfere with the subsequent analysis. The data revealed that over $400 million in current dollars might be needed to address stormwater issues arising from sea level rise be-fore 2100.
Keywords
Sea Level Rise, Groundwater, LiDAR, GIS, Stormwater, Infrastructure
1. Introduction
Sea level rise (SLR) is an ongoing climatic phenomenon caused by increased rates of How to cite this paper: Bloetscher, F. and
Wood, M. (2016) Assessing the Impacts of Sea Level Rise Using Existing Data. Journal of Geoscience and Environment Protection,
4, 159-183
http://dx.doi.org/10.4236/gep.2016.49012
Received: July 25, 2016 Accepted: September 27, 2016 Published: September 30, 2016
Copyright © 2016 by authors and Scientific Research Publishing Inc. This work is licensed under the Creative Commons Attribution International License (CC BY 4.0).
thermal expansion, glacier mass loss, groundwater pumping and ice discharge from both ice-sheets [1]-[3] that continues to put coastal populations at risk for increased flooding after storms and during king tide events. This is of critical concern since near-ly half the US population lives within 50 miles of the coast, involving most major com-mercial, leisure and import/export enterprises; hence much of the economic activity of the nation is tied to coastal communities. Coastal communities in the rest of the world have similar populations at risk.
Gregory et al. [3] note that within the last two decades, the global rate of sea-level rise has been larger than the 20th-century time-mean. Various researchers have already noted impacts on coastal and island environments [1][4]-[13], and most coastal com-munities are cognizant of the ongoing discussion about SLR, the associated loss of soil storage capacity and more intense storms overwhelming the current stormwater [12] [14]-[18]. Prior studies have shown that SLR impacts will be felt globally, but the Southeast Florida region, with its low-lying coasts, subtropical climate, porous sub-surface formations, and hydrology, is one of the world’s most vulnerable areas [18]- [20].
In southeast Florida, sea level rise (SLR) threatens both the 6.6 million people living and working in the built environment as well as the natural system that recharges the aquifer and drives much of the climate [12][18][21]. The region constitutes one-third of the state’s total population, which makes it essential to continue improving flood management strategies [8][13][22]-[24]. The region has the highest rates of projected population growth [21], which creates the potential to place important infrastructure that we rely on every day at risk. SLR is expected to rise up to three feet by 2100 [18] [25]-[29]. Fortunately, SLR is a slow, steady creep, allowing communities to take the appropriate time to evaluate and plan for SLR to insure that stranded infrastructure and failure to construct projects are exceptions to the norm [30].
re-quires making long-term decisions because infrastructure and development is not temporal—it is expected to last 50 years or more. Hence it is in the community’s inter-ests to develop a stormwater planning framework to adapt to SLR and protect vulnera-ble infrastructure through a long-term plan. While uncertainties in the scale, timing and location of climate change impacts can make decision-making difficult, response strategies can be effective if planning is initiated early.
Prior work by the authors in Broward and Miami-Dade Counties indicated signifi-cant risk to existing and future populations due to the low lying land (50% of the urban area is under 5 ft. NAVD88-see [19][30][33]-[35]). Palm Beach County is located just north of Broward and Miami-Dade Counties. While portions of Palm Beach County is coastal, the perception is that since it is north of the more seriously impacted areas of Miami and Fort Lauderdale and at higher elevations (15 ft. vs 5 ft.), there is less risk to the community, yet flooding remains an ongoing problem that appears to be increasing in frequency.
The City of West Palm Beach is a city of over 100,000 people in central Palm Beach County, Florida. The City is a major economic engine for the County, and hosts both governmental as well as commercial activities. The downtown area is located on the Intracoastal Waterway, separated from the Atlantic Ocean by the Town of Palm Beach. The City has experienced flooding in a number of neighborhoods, which appears to be increasing in frequency with time. As a result the City is in the process of developing a stormwater master plan (SWMP) that includes a component to evaluate and include the potential impacts of sea level rise (SLR) on long-term stormwater management in the City, something not previously done. The objectives of the SWMP were to develop a method for planning for SLR, and providing a means to prioritize improvements at the appropriate time. In addition, the goals were to provide guidance in developing a means to prioritize infrastructure to maximize benefit to the community.
However unlike Broward and Miami-Dade Counties, Palm Beach County was found to have far fewer monitoring wells, and generally less long-term data collection. Since long-term monitoring and monitoring well density are thought to be critical to devel-oping mapping for analysis of sea level rise, the paucity of monitoring wells created a confounding issue at the start. To accomplish this task, the City, through its consul-tants, engaged the investigators to perform a Sea Level Rise Vulnerability Assessment using available groundwater and tidal data in ArcGIS with the following elements:
1) Establish baseline sea level and groundwater elevations and develop maps based on the best available information.
2) Develop topographic maps specific to climate change analysis. 3) Identify vulnerable areas.
4) Develop costs for stormwater infrastructure to address the impact of sea level rise. 5) Develop a toolbox of infrastructure mitigation and policy solutions.
2. Methodology
coastal communities. The LiDAR data format used was the American Standard Code for Information Interchange (ASCII). This data format is easily handled by ArcGIS software. The ASCII format is comprised of the raw LAS LiDAR data type format, translated into a geographically referenced X, Y, Z global coordinate plane system [36]. Of the different topographical data repository sources the NOAA offered the data na-tively in ASCII format.
Prior work by Weiss [17] used a bathtub model for inundation. This leads to the needs to define the critical or “acceptable” level of service (frequency of flooding). The bathtub approach assumes that groundwater levels will be flat, and match the elevation of the ocean (typically the average) to determine vulnerability. This method is used by many governmental organizations due to the ease of data acquisition and model crea-tion. The main disadvantages of this type of model is that is does not consider urban water control infrastructure such as dikes and canals that lead to overestimation of in-undation [37], nor the fact that groundwater levels cannot be “flat”, and generally cor-relate with high tide, not mean tide. The results can lead to underestimation of inunda-tion because they do not identify low-lying inland areas that might flood at an earlier time than areas along the coast as a result of higher groundwater tables.
A modified bathtub model is a model that considers more than just static elevation to determine SLR vulnerability. The modified bathtub approach assumes that groundwa-ter levels increase as one moves away from the coast, an assumption that is easily justi-fied with groundwater monitoring data in many communities. The importance of the groundwater table in the model is that it is responsible for determining the soil storage capacity [38]. This method was previously explained in [18] [22] [31] [33]-[35] [39] [40], among others. In these cases, the difference between the topographic surface and the groundwater surface was used to determine the potential vulnerability of infra-structure and land areas due to sea level rise in Miami-Dade and Broward Counties due to their high level of preconceived vulnerability due to having a low elevation ground surface. Projecting groundwater levels indicated a greater risk for flooding, and more rapid failure of roadway bases and buried infrastructure. As a result, water, sewer, stormwater and transportation infrastructure in low-lying areas may be compromised. Once vulnerable areas are identified, solutions and costs can be identified.
Developing the results for measuring vulnerability in the City required a series of tasks. The first was to create a topographic surface layer. The second task was an ac-ceptable groundwater layer needed to be developed. In prior efforts, the number of monitoring wells was significant, but this was not the case for the City of West Palm Beach. The third was to find the difference between these layers in as Geographic In-formation System (GIS) called ARCMAP10.2 to define vulnerability. Finally sea level rise vulnerability under different scenarios could be created.
2.1. Surface Topography
coastal vulnerability, and thus, up-to-date, high-resolution, high-accuracy elevation data are required to model the coastal environment. Previous approaches to modeling inundation from simulated sea-level rise have been limited by coarse-resolution eleva-tion datasets (surveys, field spot elevaeleva-tions, USGS maps) versus electronic imagery [11] [16] [41]-[44]. However communicating the importance of sea level rise to local entities requires better data [10] [45] [46]. Low resolution LiDAR is available in many areas, but the coarse vertical definition (±2 feet) is not useful for coastal areas where inches matter.
Duke et al. [44] and Romah [31] showed that while higher-resolution elevation data represent a significant advance for modeling sea-level rise impacts, there can be a large variability in inundation estimates depending on the horizontal fit of the raster data [10]. High-resolution elevation data resolves the topographic complexity on landscape processes, including drainage canals [13] [44] [47]. For this project, elevation data beyond the City limits is required for the analysis. The remaining LiDAR elevation out-side of the City limits was obtained from the high resolution dataset shot by the City of Wellington (in 2015) and NOAA (in 2007), but calibrated by FAU (see Romah [31]). An issue arises in LiDAR elevation data for the western portions of Palm Beach County since NOAA did not shoot high resolution LiDAR west of the Turnpike due to lesser population densities. The lower resolution LiDAR (±2 feet) data set was used and kriged to the high resolution set. The new Wellington high resolution LiDAR elevation data was incorporated into FAU’s database in January 2015.
2.2. Groundwater Data
After downloading and developing the LiDAR maps of the land surface into GIS layers, the second step for creating the model was incorporating a groundwater surface eleva-tion. A series of data sources had to be mined and related to past events. These include data derived from the South Florida Water Management District’s data storage and re-trieval system called DBHYDRO. The database includes historical information for monitoring wells, canal stages and permit data for modeling water supply wells. Priori-ty was placed on monitoring locations with 15 or more years of data, and in particular, more recent data since tidal information indicates that king tides have been increasing over the last 15 years. The goal was to find common dates for high groundwater levels, defined as occurring in the upper 2 percent of all observations. These were compared to tidal data.
to determine common dates within the 98-100th percentile of highest elevations. Since 99% reliability is the level of service (LOS) discussed by the City (4 days/yr), four dates occurred regularly, but September 22, 2012 was the one common to the most data sets and that date was used to create wells (note it also occurs in the top 2% of tidal data).
A second dataset involved the City’s wellfield. In the late 1990’s the City had their wellfield modeled for water use permitting purposes by JLA Geosciences. This model was developed for a dry season-drought condition that matched a time period from 1996-1997, although the month was not given. Because there are a series of wellfields in and around the City, a static groundwater table cannot be created to properly mimic current conditions without taking into account these stressors. These drawdown areas were not picked up in the limited monitoring well data. As a result it was assumed that if the month of the modeled contours could be learned, this map might improve the krig (it was a different season and set of conditions-drought-than the 2012 data). As a result, the 1996-97 contours were used as a means to create a series of faux monitoring well levels using an ARCMAP10.2 as a means to develop a kriged groundwater surface along with assumed average tidal data. The intent of this map was to derive an overall surface for groundwater given pumping and other conditions. However there was un-certainty in using a model that was 20 years old, and lacking the background informa-tion on timing, calibrainforma-tion and tides for the period in quesinforma-tion, while keeping in mind that the model was run for groundwater withdrawal purposes during extreme dry events when the aquifer was low.
In a fortunate circumstance, the South Florida Water Management District had a third set of data-MODFLOW files for a JLA model run for permitting purposes. The groundwater model was re-run by the authors and the output layers for each month were created. Because there are a series of wellfields in and around the City, the end of cycle results for the first layer was calibrated to December 1997. The actual tidal eleva-tion for December 1997 was used as the eastern boundary layer for the map which is a kriged (smoothed) version of the output files.
Several issues arose at this point-3 different data sources, different datums, and dif-ferent tidal conditions, and difdif-ferent seasons. The datums were all translated to NAVD88 using an algorithm developed by the South Florida Water Management Dis-trict and made publically available. Then water level data for the common date was compared to the well levels measured in December 1997 and September 2012, and dif-ferences between the layers were developed. Consistently, groundwater elevations were higher along the coastal ridge (FEC railroad) and east, while remaining much the same on the west when compared. This is due to the water management within the Grassy Waters Preserve at basically the same elevation year-round. The result allowed for the development of a “kriged” wedge that reflects the difference in elevation between the December 1997 modeled water levels calibrated to 1997 groundwater levels and the groundwater levels measured on September 22, 2012.
2.3. Tidal Elevations
infra-structure and property due to the increase in sea level by predicting how areas with low elevations may be affected by inundation from the ocean directly, from rising ground-water levels, and inundation from the inability of inland areas to drain. The Lake Worth pier data, corrected to the NAVD88 datum, was used for this data. The tide fluctuates during the year; during the spring months, the mean high tide is less than 1 foot nearly all of the time and periodically below 0.0. In the fall, mean high tide can be as high as 2 feet. If the current condition is developed as a baseline, the reference eleva-tion needs to be defined as mean high tide or a higher percentile. It was determined that the 95 - 100 percentile tides occurred primarily in the September and October timeframe (by listing all tides in ascending order), which comports with the September 22 date for highest groundwater.
2.4. Comparing Topography with Groundwater for Measuring Vulnerability
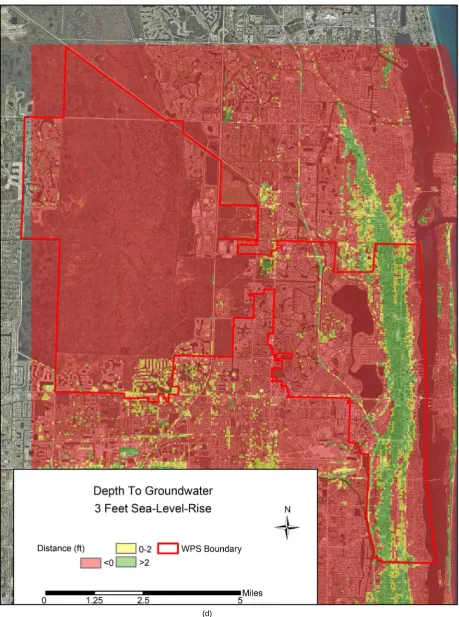
Groundwater and surface topography are used collectively to help quantify soil storage capacities. Topography identifies vulnerable land, but soil storage capacity is what real-ly identifies flooding potential. The difference between the land surface and the groundwater level is the soil storage amount. The US Army Corps of Engineers’ vulne-rability definitions were used based on the difference between ground surface elevation and groundwater level elevation to define vulnerable areas with a difference of 0 or less, potentially vulnerable areas with a difference of 0 - 2 ft, and not vulnerable area with a difference greater than 2 feet. The term “potentially vulnerable” is used for areas that need further investigation to deal with the uncertainty of timing, surface improve-ments, etc. that might affect the situation. For ease of understanding, the protocol es-tablished by Romah [31] for SLR vulnerability was used: vulnerable areas are red, po-tentially vulnerable areas are yellow, and non-vulnerable areas are green. Results were developed for the current SLR scenarios of, 1 feet (0.3 m), 2 feet (0.6 m), and 3 feet (0.9 m).
2.5. Solutions
The final piece of the project was to identify costs and types of project to correct short and long-term deficiencies. This was accomplished by determining where current in-frastructure might be lacking, identifying potential solutions for stormwater problems and assessing costs for same. The latter, due to the size of the City and lack of detailed stormwater modeling, were magnitude of scale estimates in 2015 dollars, based on bids reviewed or received by the investigators in southeast Florida.
3. Results
(c)
Figure 2. Comparison of the kirged water levels for the 2012 groundwater levels, map from permit files and groundwater
commercial area, the lack of data collection points would create an unrealistic (lower risk) view of the groundwater levels in these areas. They are higher than initially esti-mated. Figure 2(c) is the results for the MODLFOW model which extend the results of Figure 2(b) further. Figure 3 shows the delta surface between the September 2012 krig and the May 1996-97 krig which illustrates the change between the drought season and the wet season with the wells. Without the groundwater modeling data, the large drawdown areas would not be seen. These artificially keep the groundwater table down, and reduce potential flooding in these areas. This information is needed to compare the differences in the elevations between methods and identify how far off the krig might be with limited data as in the case of the 14 wells. Table 1 demonstrates that both the monitoring well and published data have nearly 2/3 of points within ±1 ft. of the actual model results despite noting that the wellfield drawdown points are underestimated in the 2012 monitoring well krig. Overall, while more data is probably better on a small scale, for this model the two data sets were not dramatically different in accuracy. As a result using the modeled results, increased to match the actual data in 2012, Figures 4(a)-(d) show the vulnerable areas of the City under the current sea level rise scenarios at the 99th percentile, 1ft. SLR, 2 ft. SLR and 3 ft. SLR.
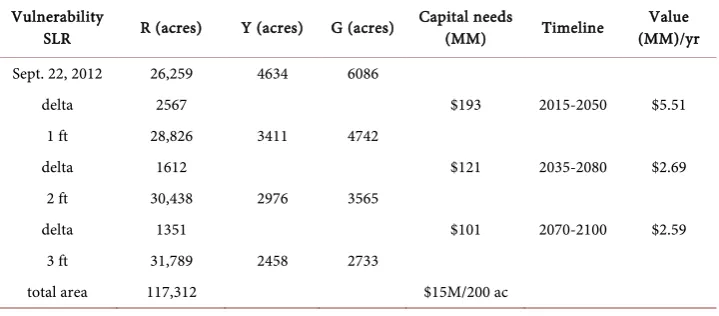
[image:12.595.200.553.374.515.2]Based on Figure 4, Table 2 outlines the area within the City subject to vulnerability
Table 1. Modflow vs kriged output from 14 monitoring wells or 1997 map.
Elevation difference Compare model to MW (% of total acreage)
Compare model to 1997 map (% of total acreage)
>−4 5.73 0
from −4 to −2 5.21 1.72
from −2 to −1 12.66 4.87
from −1 to +1 64.99 62.24
from +1 to +2 8.58 13.94
From +2 to +4 5.28 10.69
[image:12.595.194.554.548.706.2]>+4 0 6.53
Table 2. Summary of areas at risk and estimated capital needs.
Vulnerability
SLR R (acres) Y (acres) G (acres)
Capital needs
(MM) Timeline
Value (MM)/yr Sept. 22, 2012 26,259 4634 6086
delta 2567 $193 2015-2050 $5.51
1 ft 28,826 3411 4742
delta 1612 $121 2035-2080 $2.69
2 ft 30,438 2976 3565
delta 1351 $101 2070-2100 $2.59
3 ft 31,789 2458 2733
(d)
(red) and potential vulnerability (yellow) in the City. Note that the total area remains the same, but the red area increases as sea level rises. Based on current construction projects and their costs, an estimate of $15 million/200 acres was used to predict likely costs and timeframes (construction data reviewed by the authors). A much finer evalu-ation of neighborhoods is needed to determine if a given level of service is met or there are local circumstances that increase vulnerability.
The next step is to analyze vulnerability spatially, by overlaying development priori-ties with expected climate change on GIS maps to identify hotspots where adaptation activities should be focused. This effort includes identification of the critical data gaps which, when filled, will enable more precise identification of at-risk infrastructure and predictions of impacts on physical infrastructure and on communities. Based on find-ings of the vulnerable areas, the next step was the development of scenarios whereby toolbox options are utilized to address flooding in the community and where they might be applicable (see Table 3 and Table 4). The goal is identifying successful flood mitigation strategies used by other cities facing similar drainage and construction problems. Not all strategies are hard infrastructure (Table 3 only). Which strategies to pursue are locally driven in consultation with staff, based on identified vulnerabilities and cost effectiveness. These two issues are then combined to develop a framework to evaluate the impacts of climate change on infrastructure and economic development (as they are intrinsically intertwined).
The strengths of this framework are the initial focus on location-specific science, the use of both economic and social evaluation criteria, and the notion that the plan is not a fixed document, but rather a process that evolves in harmony with a changing envi-ronment. The final two steps occur at regular intervals by the community with asso-ciated adjustments made.
Whatever projection is placed on sea level rise dates, they need to consider uncer-tainty in the rate of warming, deglaciation, and other factors. When planning 50 - 100 years out, other factors can come into play as well. As a result, from the perspective of the authors, to allow flexibility in the analysis due to the range of increases within the different time periods, an approach that uses incremental increases of 1, 2, and 3 feet of SLR was considered for the scenarios.
4. Conclusions
The purpose of SLR vulnerability modeling is to explore future vulnerabilities of infra-structure, buildings and facilities on public and private property due to the increase in sea level by predicting how areas with low ground surface elevations may be affected by inundation from the rising ocean directly, from rising groundwater levels, and inunda-tion from the inability of inland areas to drain.
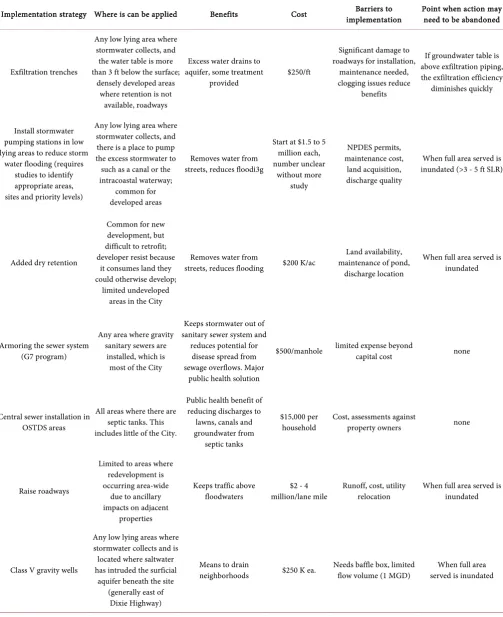
Table 3. Hard infrastructure improvements.
Implementation strategy Where is can be applied Benefits Cost implementation Barriers to Point when action may need to be abandoned
Exfiltration trenches
Any low lying area where stormwater collects, and
the water table is more than 3 ft below the surface;
densely developed areas where retention is not
available, roadways
Excess water drains to aquifer, some treatment
provided
$250/ft
Significant damage to roadways for installation,
maintenance needed, clogging issues reduce
benefits
If groundwater table is above exfiltration piping, the exfiltration efficiency
diminishes quickly
Install stormwater pumping stations in low lying areas to reduce storm
water flooding (requires studies to identify appropriate areas, sites and priority levels)
Any low lying area where stormwater collects, and there is a place to pump the excess stormwater to
such as a canal or the intracoastal waterway;
common for developed areas
Removes water from streets, reduces floodi3g
Start at $1.5 to 5 million each, number unclear without more study NPDES permits, maintenance cost, land acquisition, discharge quality
When full area served is inundated (>3 - 5 ft SLR)
Added dry retention
Common for new development, but difficult to retrofit; developer resist because
it consumes land they could otherwise develop;
limited undeveloped areas in the City
Removes water from
streets, reduces flooding $200 K/ac
Land availability, maintenance of pond,
discharge location
When full area served is inundated
Armoring the sewer system (G7 program)
Any area where gravity sanitary sewers are
installed, which is most of the City
Keeps stormwater out of sanitary sewer system and
reduces potential for disease spread from sewage overflows. Major
public health solution
$500/manhole limited expense beyond capital cost none
Central sewer installation in OSTDS areas
All areas where there are septic tanks. This includes little of the City.
Public health benefit of reducing discharges to
lawns, canals and groundwater from
septic tanks
$15,000 per household
Cost, assessments against
property owners none
Raise roadways
Limited to areas where redevelopment is occurring area-wide
due to ancillary impacts on adjacent
properties
Keeps traffic above
floodwaters million/lane mile $2 - 4 Runoff, cost, utility relocation When full area served is inundated
Class V gravity wells
Any low lying areas where stormwater collects and is located where saltwater has intruded the surficial
aquifer beneath the site (generally east of
Dixie Highway)
Means to drain
Continued
Class I injection wells
Any low lying area where stormwater collects, and there is sufficient land to permit, install and operate
a Class I well-limited
Means to drain neighborhoods,
15 MGD capacity $6 million Needs baffle box
When full area served is inundated
Infiltration trenches
[image:21.595.47.549.93.470.2]Low lying areas that collect stormwater, but the water
table is just below the surface meaning that retention and exfiltration
trenches will not work properly
Excess water gathered from soil and drained to
pump stations, creating storage capacity of soil to
store runoff, soil treatment
$250/ft. plus pump statin
Significant damage to roadways for installation,
maintenance needed, clogging issues, costs
for pump station
Complete inundation means pumps run constantly and may
pump same water over and over
Canals
limited-canals mostly controlled by others
and are losing capacity with SLR
Means to drain neighborhoods, provides
treatment of water
$0.5 million/mi land area, flow volume, maintenance When full area served is inundated
Salinity/lock structures SFWMD Responsibility Keeps sea out, reduces saltwater intrusion
Up to $10 million, may require
ancillary stormwater pumping stations at $2 - 5
million each
SFWMD, western residents, private property rights
arguments
n/a-solution to retard sea encroachment and saltwater intrusion
Regional relocation of locks
to pump stations SFWMD Responsibility
Creates regional system to use coastal ridge to protect inland property, keeps
saltwater out
$200 million ea.
SFWMD, western residents, private property rights
arguments
n/a-solution to retard sea encroachment and protect
property which can exist at levels below sea level
Raise sea walls Islands and downtown Protects property $0.1 - 1 million/lot Private property rights, neighbors n/a
develop a toolbox of infrastructure mitigation and policy solutions. The results for the models that incorporate the loss of soil storage capacity created by rising groundwater levels indicate that the persistent flooding of roadways will start in the western portion of the study region farthest from the coast.
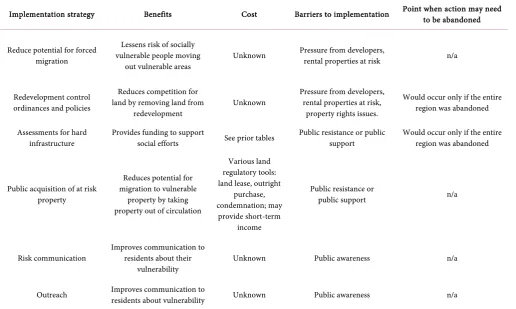
Table 4. Soft infrastructure improvements.
Implementation strategy Benefits Cost Barriers to implementation Point when action may need to be abandoned
Reduce potential for forced migration
Lessens risk of socially vulnerable people moving
out vulnerable areas Unknown
Pressure from developers,
rental properties at risk n/a
Redevelopment control ordinances and policies
Reduces competition for land by removing land from
redevelopment
Unknown Pressure from developers, rental properties at risk, property rights issues.
Would occur only if the entire region was abandoned
Assessments for hard
infrastructure Provides funding to support social efforts See prior tables Public resistance or public support Would occur only if the entire region was abandoned
Public acquisition of at risk property
Reduces potential for migration to vulnerable property by taking property out of circulation
Various land regulatory tools: land lease, outright
purchase, condemnation; may
provide short-term income
Public resistance or
public support n/a
Risk communication Improves communication to residents about their vulnerability
Unknown Public awareness n/a
Outreach Improves communication to
residents about vulnerability Unknown Public awareness n/a
perception that they were less vulnerable was found to be incorrect given that the coastal ridge appears to control groundwater levels in the City. The data revealed that over $400 million in current dollars might be needed to address stormwater issues aris-ing from sea level rise before 2100.
References
[1] Church, J.A. and White, N.J. (2011) Sea-Level Rise from the Late 19th to the Early 21st Century. Surveys in Geophysics, 32, 585-602. http://dx.doi.org/10.1007/s10712-011-9119-1
[2] Konikow, L.F. (2011) Contribution of Global Groundwater Depletion since 1900 to Sea- Level Rise. Geophysical Research Letters, 38,Article ID: L17401.
http://dx.doi.org/10.1029/2011gl048604
[3] Gregory, J.M., Browne, O.J.H., Payne, A.J., Ridley, J.K. and Rutt, I.C. (2012) Modelling Large-Scale Ice-Sheet—Climate Interactions Following Glacial Inception. Climate of the Past, 8, 1565-1580. http://dx.doi.org/10.5194/cp-8-1565-2012
[4] Coombes, E.G. and Jones, A.P. (2010) Assessing the Impact of Climate Change on Visitor Behaviour and Habitat Use at the Coast: A UK Case Study. Global Environmental Change, 20, 303-313. http://dx.doi.org/10.1016/j.gloenvcha.2009.12.004
[5] Frazier, T.G., Wood, N., Yarnal, B. and Bauer, D.H. (2010) Influence of Potential Sea Level Rise on Societal Vulnerability to Hurricane Storm-Surge Hazards, Sarasota County, Florida.
Applied Geography, 30, 490-505. http://dx.doi.org/10.1016/j.apgeog.2010.05.005
Framework for Adaptation to Climate Change. Florida Atlantic University, Boca Raton.
http://www.ces.fau.edu/files/projects/climate_change/Fl_ResilientCoast.pdf
[7] Nicholls, R.J. and Cazenave, A. (2010) Sea-Level Rise and Its Impact on Coastal Zones.
Science, 328, 1517-1520. http://dx.doi.org/10.1126/science.1185782
[8] NFIP (2011) National Flood Insurance Program. Loss Statistics from 1 January 1978, through Report as of 07/31/2011. http://bsa.nfipstat.com/reports/1040.html
[9] Noss, R.F. (2011) Between the Devil and the Deep Blue Sea: Florida’s Unenviable Position with Respect to Sea Level Rise. Climatic Change, 107, 1-16.
http://dx.doi.org/10.1007/s10584-011-0109-6
[10] Poulter, B. and Halpin, P.N. (2008) Raster Modeling of Coastal Flooding from Sea Level Rise. International Journal of Geographical Information Sciences, 22, 167-182.
http://dx.doi.org/10.1080/13658810701371858
[11] Nichols, R.J. (2004) Coastal Flooding and Wetland Loss in the 21st Century: Changes under the SRES Climate and Socio-Economic Scenarios. Global Environmental Change, 14, 69-86.
http://dx.doi.org/10.1016/j.gloenvcha.2003.10.007
[12] Southeast Florida Regional Climate Change Compact Technical Ad Hoc Work Group (2011) A Unified Sea Level Rise Projection for Southeast Florida. A Document Prepared for the Southeast Florida Regional Climate Change Compact Steering Committee.
https://www.broward.org/NaturalResources/ClimateChange/Documents/SE%20FL%20Sea %20Level%20Rise%20White%20Paper%20April%202011%20ADA%20FINAL.pdf
[13] Zhang, K. (2011) Analysis of Non-Linear Inundation from Sea-Level Rise Using LIDAR Data: A Case Study for South Florida. Climatic Change, 106, 537-565.
http://dx.doi.org/10.1007/s10584-010-9987-2
[14] Hanson, S., Nicholls, R., Ranger, N., Hallegatte, S., Corfee-Morlot, J., Herweijer, C. and Chateau, J. (2011) A Global Ranking of Port Cities with High Exposure to Climate Ex-tremes. Climate Change, 104, 89-111. http://dx.doi.org/10.1007/s10584-010-9977-4
[15] Tebaldi, C., Strauss, B.H. and Zervas, C.E. (2012) Modelling Sea Level Rise Impacts on Storm Surges along US Coasts. Environmental Research Letters, 7, Article ID: 014032.
http://dx.doi.org/10.1088/1748-9326/7/1/014032
[16] Titus, J.G. and Richman, C. (2001) Maps of Lands Vulnerable to Sea Level Rise: Modeled Elevations along the US Atlantic and Gulf Coasts. Climate Research, 18, 205-228.
http://dx.doi.org/10.3354/cr018205
[17] Weiss, J.L., Overpeck, J.T. and Strauss, B. (2011) Implications of Recent Sea Level Rise Science for Low-Elevation Areas in Coastal Cities of the Conterminous USA. Climatic Change, 105, 635-645.http://dx.doi.org/10.1007/s10584-011-0024-x
[18] Heimlich, B.N., Bloetscher, F., Meeroff, D.E. and Murley, J. (2009) Southeast Florida’s Resi-lient Water Resources: Adaptation to Sea Level Rise and Other Impacts of Climate Change. Center for Urban and Environmental Solutions, Department of Civil Engineering, Envi-ronmental, and Geomatics Engineering, Florida Atlantic University, Boca Raton.
http://www.ces.fau.edu/files/projects/climate_change/SE_Florida_Resilient_Water_Resourc es.pdf
[19] Bloetscher, F., Romah, T., Berry, L., Hernandez Hammer, N. and Cahill, M.A. (2012) Iden-tification of Physical Transportation Infrastructure Vulnerable to Sea Level Rise. Journal of Sustainability, 5, 40-51.
Switzerland, 104 p.
[21] United States Census Bureau (2012) State and County Quickfacts: Florida.
http://quickfacts.census.gov/qfd/states/12000.html
[22] Parkinson, R.W. (2010) Municipal Adaptation to Sea-Level Rise: City of Satellite Beach. RW Parkinson Consulting Inc., Melbourne.
[23] Schmidt, K.A., Hadley, B.C. and Wijekoon, M. (2011) Vertical Accuracy and Use of Topo-graphic LIDAR Data in Coastal Marshes. Journal of Coastal Research, 27, 116-132.
http://dx.doi.org/10.2112/JCOASTRES-D-10-00188.1
[24] Warner, N.N. and Tissot, P.E. (2012) Storm Flooding Sensitivity to Sea Level Rise for Gal-veston Bay, Texas. Ocean Engineering, 44, 23-32.
http://dx.doi.org/10.1016/j.oceaneng.2012.01.011
[25] Domingues, C.M., Church, J.A., White, N.J., Gleckler, P.J., Wiffels, S.E., Barker, P.M. and Dunn, J.R. (2008) Improved Estimates of Upper-Ocean Warming and Multi-Decadal Sea- Level Rise. Nature, 453, 1090-1093. http://dx.doi.org/10.1038/nature07080
[26] Edwards, R. (2007) Sea Levels: Resolution and Uncertainty. Progress in Physical Geogra-phy, 31, 621-632. http://dx.doi.org/10.1177/0309133307087086
[27] Gregory, J.M. (2008) Sea Level Rise: What Makes Prediction So Difficult? Planet Earth, 2008, 24-27.
[28] Jevrejeva, S., Moore, J.C. and Grinsted, A. (2010) How Will Sea Level Respond to Changes in Natural and Anthropogenic Forcings by 2100? Geophysical Research Letters, 37, Article ID: L07703. http://dx.doi.org/10.1029/2010GL042947
[29] Vermeer, M. and Rahmstorf, S. (2009) Global Sea Level Linked to Global Temperature.
Proceedings of the National Academy of Sciences of the United States of America, 106, 21527-21532. http://dx.doi.org/10.1073/pnas.0907765106
[30] Bloetscher, F. and Romah, T. (2015) Tools for Assessing Sea Level Rise Vulnerability. Jour-nal of Water and Climate Change, 6, 181-190. http://dx.doi.org/10.2166/wcc.2014.045
[31] Romah T. (2012) Advanced Methods in Sea Level Rise Vulnerability Assessment. Master Thesis, Florida Atlantic University, Boca Raton.
[32] Chang, S.W., Clement, T.P., Simpson, M.J. and Lee, K.K. (2011) Does Sea-Level Rise Have an Impact on Saltwater Intrusion? Advances in Water Resources, 34, 1283-1291.
http://dx.doi.org/10.1016/j.advwatres.2011.06.006
[33] Bloetscher, F., Hammer, N.H., Berry, L., Locke, N. and van Allen, T. (2015) Methodology for Predicting Local Impacts of Sea Level Rise. British Journal of Applied Science & Tech-nology, 7,84-96. http://dx.doi.org/10.9734/BJAST/2015/14046
[34] Bloetscher, F., Meeroff, D.E. and Heimlich, B.N. (2009) Improving the Resilience of a Mu-nicipal Water Utility against the Likely Impacts of Climate Change. A Case Study: City of Pompano Beach Water Utility. Florida Atlantic University, Boca Raton.
http://www.ces.fau.edu/files/projects/climate_change/PompanoBeachWater_CaseStudy.pdf
[35] Bloetscher, F., Meeroff, D.M., Heimlich, B.N., Brown, A.R., Bayler, D. and Loucraft, M. (2010) Improving the Resilience of a Municipal Water Utility against the Likely Impacts of Climate Change. Journal American Water Works Association, 102, 36-46.
http://www.academia.edu/27010051/Improving_resilience_against_the_effects_of_climate_ change
[36] FDOT (2012) BDK79 977-01 Development of a Methodology for the Assessment of Sea Level Rise Impacts on Florida’s Transportation Modes and Infrastructure.
for Assessing Current and Future Coastal Vulnerability to Climate Change. ETC/ACC Technical Paper, European Topic Centre on Air and Climate Change, Bilthoven.
[38] Gregory M.A., Cunningham, B.A., Schmidt, M.F. and Mack, B.W. (1999) Estimating Soil Storage Capacity for Stormwater Modeling Applications. 6th Biennial Stormwater Research and Watershed Management Conference, Tampa, 14-17 September 1999.
http://infohouse.p2ric.org/ref/41/40231.pdf
[39] Bloetscher, F., Heimlich, B.N. and Romah, T. (2011) Counteracting the Effects of Sea Level Rise in Southeast Florida. Journal of Environmental Science and Engineering, 5, 1507-1525. [40] E Sciences (2014) Groundwater Elevation Monitoring and Mapping Six Monitoring
Sta-tions throughout Miami Beach. E Sciences Project Number 7-0002-005, E Sciences, Fort Lauderdale. Miami Beach.
[41] Park, R.A., Trehan, M.S., Mausel, P.W. and Howe, R.C. (1988) The Effects of Sea Level Rise on US Coastal Wetlands. Holcomb Research Institute, Butler University, Indianapolis. [42] Moorhead, K.K. and Brinson, M.M. ((1995) Response of Wetlands to Rising Sea Level in
the Lower Coastal Plain of North Carolina. Ecological Applications, 5, 261-271.
http://dx.doi.org/10.2307/1942068
[43] Titus, J.G. and Wang, J. (2008) Maps of Lands Close to Sea Level along the Middle Atlantic Coast of the United States: An Elevation Data Set to Use While Waiting for LIDAR. In: Ti-tus, J.G. and Strange, E.M., Eds., Background Documents Supporting Climate Change Science Program Synthesis and Assessment Product 4.1, Section 1.1, US EPA, Washington DC, 1-44.
http://papers.risingsea.net/federal_reports/Titus_and_Strange_EPA_section1_1_Titus_and
_Wang_may2008.pdf
[44] Duke, G.D., Kienzle, S.W., Johnson, D.L. and Byrne, J.M. (2003) Improving Overland Flow Routing by Incorporating Ancillary Road Data into Digital Elevation Models. Journal of Spatial Hydrology, 3, 1-27.
[45] Marbaix, P. and Nicholls, R.J. (2007) Accurately Determining the Risks of Rising Sea Level.
Eos Transactions American Geophysical Union, 88, 441-442.
http://dx.doi.org/10.1029/2007EO430002
[46] Small, C. and Nicholls, R.J. (2003) A Global Analysis of Human Settlement in Coastal Zones. Journal of Coastal Research, 19, 584-599.
[47] Gesch D.B. (2009) Analysis of LiDAR Elevation Data for Improved Identification and De-lineation of Lands Vulnerable to Sea-Level Rise. Journal of Coastal Research, 53, 49-58.
Submit or recommend next manuscript to SCIRP and we will provide best service for you:
Accepting pre-submission inquiries through Email, Facebook, LinkedIn, Twitter, etc. A wide selection of journals (inclusive of 9 subjects, more than 200 journals)
Providing 24-hour high-quality service User-friendly online submission system Fair and swift peer-review system
Efficient typesetting and proofreading procedure
Display of the result of downloads and visits, as well as the number of cited articles Maximum dissemination of your research work