Munich Personal RePEc Archive
A Cross-national analysis of the relations
between school choice and effectiveness
differences between private-independent
and public schools
Dronkers, Jaap and Avram, S
Maastricht Research School of Economics of Technology and
Organization (METEOR)
July 2010
A Cross-national Analysis of the Relations between School Choice and Effectiveness Differences between Private-Independent and Public Schools 1
Jaap Dronkers & Silvia Avram
Maastricht University & European University Institute
Abstract
We apply propensity score matching to the estimation of the disparity in school effectiveness between the privately owned, privately funded school sector and the public one in a sample of 25 countries in Europe, America and Asia. This technique allows us to distinguish between school choice and school effectiveness processes and thus, to account for selectivity induced variation in school effectiveness. We find two broad patterns of private independent school choice: the choice as a social class reproduction choice; and the choice of an outsider’s for a good-equipped school. As regards school effectiveness, our results show that, after controlling for selectivity and school choice processes, the initial higher reading scores of students in private-independent schools become comparable to those public schools students in a majority of countries. However, in a few countries average reading scores remain higher in the private independent sector even after introducing controls for school choice induced selectivity. The opposite pattern, namely of higher average reading scores in the public sector has also been found in four countries.
Keywords: school choice; school effectiveness; private-independent and public schools; international comparison.
1. Introduction
The differences in scholastic achievement between public and private schools have been the topic of a large number of studies in the educational sciences, sociology and economics, mostly in the USA but also to some extent in Europe. Within this literature, a significant distinction emerges inside the private sector, namely the one between private-dependent (i.e. publicly financed) and private independent schools. The distinction is important for at least three reasons. First, in many countries, especially in continental Europe, these two types of schools coexist alongside each other and alongside public schools, often as an unintended outcome of the 19th century
struggle around school ownership and financing between the State and Church(es). Second, the functions that these types of schools fulfil can differ significantly, depending on the social, religious or ethnic groups that charter them. Third, the distinction between public schools and private government-dependent schools also relates to current policy debates about the organization, provision and financing of collective goods like education.
reducing the cost of education (Chubb & Moe, 1990). Another argument used in the American context states that schools should offer young people an education that is in accordance with the way of life of their parents. This latter line of reasoning comes closer to the European tradition of government dependent religious schools (Godwin & Kemerer, 2002). The developments taking place in the United States influenced the discourse on the relation between public and private schools in Europe, especially in the UK, where subsidized private schools were rare.
Due to its implications for educational policy, any differential effectiveness between private and public schools constitutes an important research topic. The debate started with the study of Coleman, Hoffer & Kilgore (1982), who claimed that pupils attending Catholic schools in the USA achieved at higher levels than comparable students in the public sector. This study was the start of a huge and still ongoing debate and research in the USA on public and private schools, potential state subsidies for religious schools and parental school choice. Coleman and Hoffer (1987) and Bryk, Lee and Holland (1993) provided comprehensive follow-up studies.
2. Public-private comparisons
Comparisons between the achievement of students in private and the public schools have been carried out mainly on a national basis. In the US, research based on the High School and Beyond and on the National Education Longitudinal Study, has generated heated controversies about whether private, in particular Catholic, schools were able to raise the achievement of the pupils more than schools in the public sector (Greeley 1982; Noell 1982; Alexander and Pallas 1983; Willms 1985; Coleman and Hoffer 1987; Chubb and Moe 1990; Gamoran 1996; Neal 1997; Hoffer 1998; Jeynes 2002). However, despite the impressive amount of research carried out, findings remain inconsistent and inconclusive. Results have depended on the timing of the study, on the particular research design and included variables, as well as on the precise statistical methods used.
Although the differences in scholastic achievement between public and private (dependent or independent) schools are relevant for nearly all developed countries, little cross-national research has looked into these differences in a comparative way. Making use of the PISA 2000 survey, Dronkers & Robert (2008a; 2008b) have conducted a systematic comparison of the effectiveness of public, private-dependent and private-independent schools in 22 OECD countries. Their analysis has found that, albeit the larger part of the gross scholastic achievement differences between public and private-dependent schools could be explained by differences in their student intake and by the related differences in school composition, private government-dependent schools still maintained an advantage in the average reading score compared to public schools. This advantage could not be explained either in terms of student and parent characteristics, or compositional effects. Moreover, the private-dependent sector advantage was found to be universal, meaning that it was more or less equal in the various countries.
(2004) in their analysis of the PISA 2000 data and by Somers, McEwan & Willms (2004) in their analysis of Latin-American private schools).
Another analysis of the same PISA 2000 data (Corten & Dronkers, 2006) suggests that private government-dependent schools are more effective for pupils from families with low levels of cultural possessions. They found no indication that private government-dependent schools were more favourable for children from higher social strata.
In this article we focus on the school choice and effectiveness differences between private government-independent schools and public schools. In an earlier article (Dronkers & Avram, 2010) we have made the same cross-national analysis for private-dependent and public schools. A comparison between both articles reveals that the substantive outcomes for government-dependent and government-independent schools are quite different, again underlining that these are distinct types of private schools. Concerning school choice between private-dependent schools and public schools, we found two patterns: a choice of upwardly mobile parents for private-dependent schools and a preference for segregation by (lower-) middle class parents. As regards school effectiveness of private dependent-schools compared with public school, our results indicated that, after controlling for selectivity, a substantial advantage in reading achievement remains among students in publicly funded private schools in ten out of the 26 countries.
3. Unmeasured selectivity of school choice and school effectiveness
The literature on the possible causes of differences in scholastic achievement among schools is extensive. Although we cannot discuss at length this literature, we point out some useful reviews (Sammons, Hillman, & Mortimore, 1995; Scheerens & Bosker, 1997; Teddlie & Reynolds, 2000). The main problem encountered when trying to assess the school effects on achievement resides in the unknown and therefore, unmeasured selectivity involved in opting for a private school instead of a public one. Indeed, a number of studies have pointed out that private and public school students differ in substantial ways such as parental education, income and wealth, educational resources present at home, parental involvement in the pupil’s educational career, and so on (Coleman, Hoffer et al. 1982; Greeley 1982; Coleman and Hoffer 1987; Witte 2000; Yang and Kayaardi 2004; Goldring and Phillips 2008). More generally, when attendance of a school, whether public or private, is ‘free’ meaning both parental and school selection occur before a student can enrol, selectivity is always an issue. Wealthier, better informed, and better educated parents will presumably have an advantage in finding and in gaining access to the ‘best’ school for their child (Ball 1993; Ball, Bowe et al. 1995; Echols and Willms 1995; Ball 1997; Goyette 2008; Jarvis and Alvanides 2008).
Analyses in the school effectiveness tradition (Dronkers & Robert (2008a; 2008b) follow that tradition) assume that the measured parental and pupil variables will control for any selectivity induced by school choice processes. This assumption seems appropriate when comparing the effectiveness of public schools within and across countries, as most often public schools have fixed catchment-areas and involve virtually no parental school choice, aside from the indirect choice of residence.
be linked to both choice processes and outcomes, and this almost surely brings about unmeasured heterogeneity, which might or might not be solved by the measured parental and pupil variables. More generally, the fact that both parents and schools are relatively unconstrained in picking a school or a student amplifies self-selection problems.
To address the issue of selectivity, we propose using another approach, namely propensity score matching to explicitly disentangle school choice processes from school-effectiveness. In a first step, we estimate the likelihood of choosing a private-independent school rather than a public one. The result assigns to each pupil a propensity score of choosing a private rather than a public school, based on the characteristics of the pupil, her parents and the features of the chosen school. The second step of the approach consists of estimating the effectiveness of non-public schools, based on a matched sample of pupils with similar propensities of choosing a private school but who nonetheless attended a public one.
In this article, we focus on the choice between public and private-independent schools (private schools which get their financial resources mainly from tuition and/or other private funds) and on the corresponding differences in school effectiveness in the cognitive domain (reading)2. In another article (Dronkers & Avram, 2010) we
have made the same cross-national analysis for private-dependent and public school in 25 countries.
4. Another approach to disentangle the relations between choice and effectiveness
To distinguish between school choice and school effectiveness processes, we employ a technique called propensity score matching.3 It has been used for several decades in
other fields, particularly in economics (see Rosenbaum & Rubin, 1983, for one of the original pieces in this method and Dehejia & Sadek, 2002, for a more recent review). The technique approximates a quasi-experimental design with secondary data by comparing individuals in a “treatment group” (in this case, pupils in private schools) to those in a “control group” (pupils in public schools) who have a similar likelihood of experiencing the treatment according to observable characteristics. This comparison is accomplished by using a logistic regression to estimate the propensity that the pupil will choose a private school. The propensity score is defined as follows (Rosenbaum & Rubin, 1983):
P(T) ≡ Pr {T = 1/S} = E{T/S}
where P(T) is the propensity of choosing a private school, T indicates that the pupil did or did not choose a private school (the treatment) and S is a vector of covariates influencing the private school choice.
The resulting propensity score is used to match4 pupils who did with those that
We want to stress that propensity score matching techniques are not a “magic bullet”. They only account well for selection if two assumptions are met. First, all observable variables influencing both the treatment – school choice - and the outcome – academic achievement- must be included in the propensity score model, i.e. there has to be conditional independence. Second, selection processes have to be captured well by variables predicting the propensity to experience the treatment of interest. But these issues arise no matter what method one uses, even the simplest. Thus, when comparing different modeling strategies, it is important to remember that every method has its own limitations. OLS regression analysis (which is most commonly used in school effectiveness analysis, multi-level models included) estimates the average treatment effect of private school attendance for the full sample when controlling for the other covariates. Propensity score matching restricts the available sample to treated and untreated cases that have comparable propensity scores. If there is no considerable overlap in the propensities of those in the treatment and the control group (like in most of our countries) the differences in educational achievement will not reflect the average treatment effect of attending a private school for the full sample, but only for a selective part, namely those pupils who have the possibility to actually choose a private school. From this perspective, the results of propensity score matching presented here should be seen as complementary to the earlier results, obtained through OLS regression.
The great advantage of using propensity scores lies in the fact that matching is performed on only one dimension instead of the all the variables on which the propensity score is computed (in this case, 15 pupil and school variables). Because of the large number of predictors, matching on all of the variables simultaneously would be virtually impossible. However, the same propensity score may result from very different values on the predictor variables entered in the logistic regression through which the propensity score is estimated.5 To account for this possibility, a more
sophisticated propensity matching has been performed using both the propensity scores and the Mahalanobis distance. The algorithm involves two steps. The first one consists of selecting all the control cases (in this case, pupils attending public schools) that have a propensity score within a range of a quarter of a standard deviation below or above each treatment case (in this case, pupils attending private-independent schools). In a second step, for all the selected control cases in the previous stage, a Mahalanobis distance is computed based on five variables (highest parental education, highest parental occupational status, family wealth, immigration status and cultural possessions index). These five variables have been chosen based on theoretical considerations, i.e. they are thought to play a particularly important role in school choice selectivity (Ball 1993; Gorard 1999; Witte 2000). Eventually, the control case with the lowest Mahalanobis distance is chosen as a match. This type of matching allows for a greater weight to be assigned to the variables included in the Mahalanobis distance matching. Simultaneously, it ensures that pupils attending public schools match (as close as possible) pupils attending private-independent schools not only on the propensity scores but also on the five social background variables on which the Mahalanobis distance is computed.
There are very few applications of propensity score matching in the study of the effects of private and public schools, but the first dates back more than 20 years and is used for the same topic: effectiveness differences between public and catholic schools in the USA (Hoffer, Greeley and Coleman, 1985; Morgan, 2001).
Our analyses are carried out using the Programme for International Student Assessment (PISA) survey. This dataset has the particular advantage of offering information both on school boards and funding sources. Thus, it enables us to make the distinction between the three school types mentioned above, namely public, private government independent and private government dependent.6 Other data-sets
like TIMSS and PRILS allow only for the distinction between public and private schools and, thus, are less useful given the already established differences in effectiveness between private independent and private government-dependent schools (Dronkers & Robert, 2008a). We restrict ourselves in this article to the comparison between public and private-independent schools. In Dronkers & Avram (2010) we have made a comparable comparison between public and private-dependent schools.
Three waves of the PISA survey have been carried out so far, in 2000, 2003 and in 2006. Use has been made of all three waves by pooling them into one database.7 This strategy allows us to maximize the number of private-independent
schools present in the database. We selected all European countries, non-European industrialized countries, countries in Latin-America & Asia that have a minimum of 10 private-independent schools present in the pooled dataset. We also discarded all countries in which the private-independent schools cater for less that 1 percent of the pupil population.
Only the composite reading score has been used as a proxy for the student’s educational performance. Albeit the math and science scores could also have been added to the analyses, we opted to exclude them due to the fact that in the first wave only part of the sample has been given (a shorter version of) the math and/or science test. Conversely, the reading score is available for the entire sample in each of the three waves. Earlier analyses (compare the results of Dronkers & Robert (2008a) who use reading as indicator with Dronkers & Robert (2008b) who use math as an indicator) have shown that differences in school achievement between school types are similar, irrespective of which of these three indicators of educational performance is used.
As PISA data are cross-sectional, they contain no information either about the pupils’ length of stay at their current school, or about the characteristics of their former schools. This might lead to a misspecification of the effect of the characteristics of the current school, especially if all (or at least the large majority of) 15 year old pupils in a specific country have moved recently to current school.
Based on the existing literature relating to private-public school comparisons, as well as on availability of comparable data in the three waves of PISA, a variety of family and school characteristics likely to influence school choice and school effectiveness have been included in the analyses. Gender, immigrant status, cultural possessions, household wealth, both maternal and paternal education and occupational status have been incorporated to account for variations in the family background of private and public schools’ student populations. Previous PISA based research has shown these variables to be the most powerful predictors of student achievement. Unfortunately, parental income (separate from household wealth) is not available in all PISA waves, and therefore, has not been included in the analysis.
variables related to the school’s visible resources, namely student-teacher ratios, computer-student ratios and a composite index of educational resources have been considered as potential factors influencing school choice on the school level. All of the included school characteristics are relatively observable to parents and therefore may play a role in shaping choice decisions. We did not include those school characteristics, which are less visible for parents (like teacher quality). Because they are not easily noticeable to parents, and thus are less amenable to clear assessments, the influence of such school characteristics might be more random. A crucial characteristic of private-independent schools is their affordability, i.e. the amount of tuition they charge. Regrettably, apart from a raw variable indicating that the school does indeed charge student fees, no detailed information on tuition payments exists in PISA. Since all private independent schools charge tuition, the binary variable mentioned above could not be used.
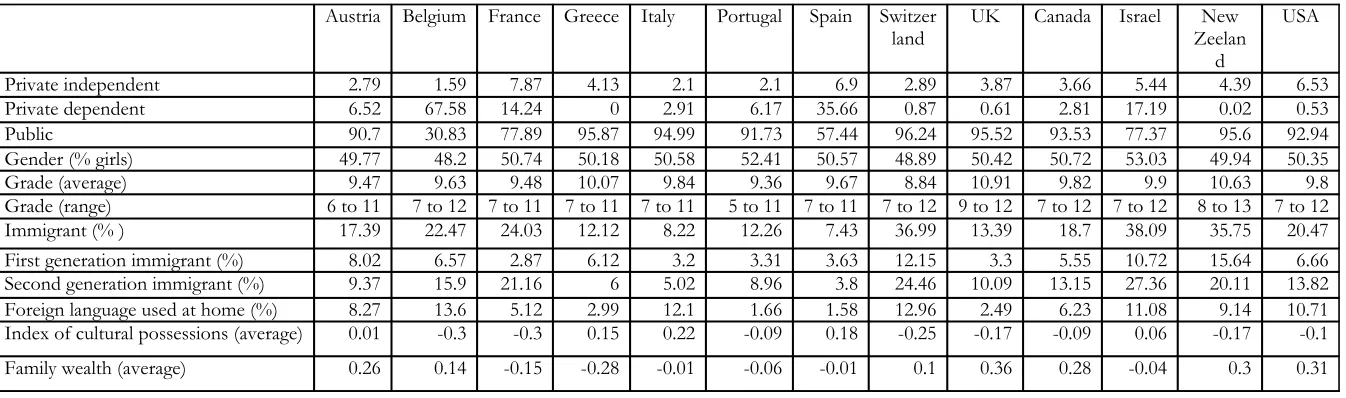
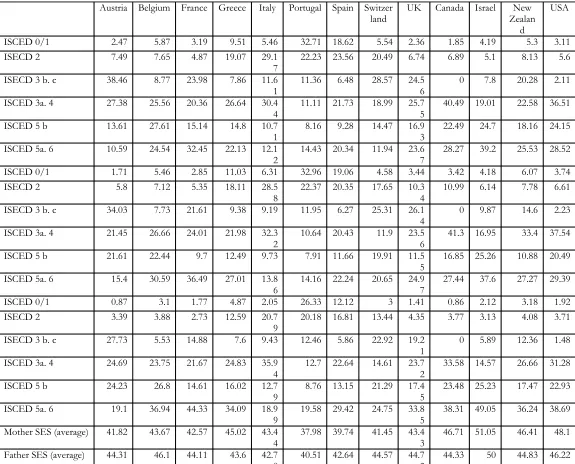
Mean values for the characteristics of pupils, parents and schools are shown in Table 1, separately for each country that had enough private independent schools in the sample to be included in our analyses.
[About here table 1]
25 counties on four continents have enough public and private-independent schools to be included in the analyses, although in some cases, the private-independent sector caters for a small percentage of all 15 year-olds (but always more than 1%).
6. Results for the choice of private-independent schools versus public schools.
A set of 25 logistic regression equations including all the parent, pupil and visible school characteristics presented in section 5 has been used to predict the selection of a private-dependent school rather than a public one, for each country separately.
Table 2 shows the regression coefficients corresponding to each of these equations. Since we use multivariate regressions that simultaneously include all of the predictors, the resulting coefficients can be interpreted as ‘net’ effects on the school choice.
[About here table 2]
The results indicate that, in general, the choice pattern between private-independent and public schools differs across these 25 countries. More specifically, the influence of various student and school characteristics on the selection of a private independent school rather than a public one is country specific. School admission based on parents’ endorsement of the school’s philosophy is positively influencing the likelihood of choosing a private-independent school in all countries, with the exception of the UK, Chile and Colombia.8 Admission policies based on participation
private-independent school in all countries except Indonesia and Thailand where a high student composition score increases the probability of a public school choice. A higher number of teachers per student in schools impacts positively9 on the likelihood
of selecting a private-independent school only in Switzerland, UK, Canada, USA, Chile, Columbia and Mexico. But a higher number of teachers per student increase the odds of public school choice in Austria, Belgium, Greece, Italy, Portugal, Spain, New Zealand, Argentina, Uruguay, Taiwan, Indonesia and Korea. The presence of additional educational resources favors the selection of a private independent school over a public one in the large majority of countries. The exceptions are France, Spain and Israel where there is no significant relation, as well as Greece and Peru where higher educational resources are associated with public schools.
The influence of student characteristics on the likelihood of selecting a private independent school over a public one similarly differs across countries. Thus, children of parents with higher occupational status tend to opt for private independent schools in Austria, Spain, Colombia, Uruguay, Taiwan, Indonesia, Japan (only the mother’s SES is significant), Canada, New Zealand, Peru, Korea (only the father’s SES is significant), Belgium, Greece, Switzerland, UK, USA and Brazil (both the mother’s and the father’s SES are significant). However, in France, Italy, Portugal, Mexico and Thailand there is no relation between parental SES and the choice of a private-independent school, whereas in Argentina a negative relation has been found. Confirming previous research, family wealth positively impacts the likelihood of a private independent school choice in an overwhelming majority ofcountries. Belgium, Portugal, Switzerland, USA, Argentina, Columbia, Peru and Japan differ in that no statistically significant relationship can be detected, while in Israel the relationship is negative. Finally, the parental educational level is generally unrelated to the likelihood of selecting a private independent school once the other student and school characteristics are controlled for. The pattern does not hold in Austria, Greece, Spain, Switzerland, UK, and the USA where parents of higher educational background prefer public schools over private independent ones. The opposite is true for Thailand. Private independent schools have sometimes been regarded as “elite” schools catering for the needs of upper class families. Indeed, such “elite schools have been very visible in educational systems following the Anglo-Saxon model. Nevertheless, our results indicate that this pattern is far from universal. On the contrary, in the majority of countries, there is little evidence that private independent school selection is reserved exclusively for upper class parents.
Native parents10 prefer public schools in Belgium, France, Spain, while
immigrant parents prefer private-independent schools in Portugal, Switzerland, UK, Canada, USA, Colombia and Thailand. Pupils who speak a foreign language at home are more likely to attend a private-independent school in Belgium, Portugal, UK and Israel, but not in Italy, Canada, New Zealand, USA and Thailand. Hence, private independent schools cannot be said to generally constitute a segregationist mechanism, used by indigenous parents and pupils to isolate themselves from children with an immigrant background.
[About here figure 1]
capital, fear of immigrants, wealth, school resources or selectivity, are simply misleading.
In an attempt to systematize the variation in the effects of various pupil and school characteristics across countries, we have made use cluster analysis, using the country regression coefficients11 as input. Figure 1 shows the country groupings that have
emerged from the hierarchical cluster analysis.12 Countries where coefficients are
more similar are clustered closer together, while countries with more divergent coefficients are placed further away from each other. The cluster analysis suggests the existence of two general clusters. The first cluster (A) consists of Austria, Canada, Switzerland, USA, Italy, Mexico, Indonesia, Brazil, Uruguay, Greece and UK. Table 3 shows that the private-independent schools in these eleven countries are chosen by native language speaking pupils from more wealthy families who choose private-independent schools for their high socioeconomic school composition and the special programs of these schools. One might characterize the private-independent school-choice in these countries as a social class reproduction choice. The second cluster (B) contains Belgium, Portugal, Israel, Chile, Taiwan, Japan, Spain, Argentina and Columbia. Table 3 shows that the private-independent schools in these nine countries are chosen by foreign language speaking pupils from less wealthy families who choose schools with many material resources. One might characterize the private-independent school-choice in these countries as an outsider’s choice for a well-equipped school.
[About here table 3]
private-independent schools for their high socioeconomic school composition and their material and educational resources. One might characterize the private-independent school-choice in these countries as a choice of the foreigner in poor countries.
To sum up, there is a substantial amount of variation in the impact of student and school characteristics on school choice processes across countries. Private-independent school choice cannot simply be explained through better teaching conditions (material and educational resources of schools; a high socio-economic composition of the student body). Preferences for a special educational philosophy and the maintenance of cultural capital represent important motives in some countries. Not only native parents but also immigrant parents can prefer private-independent schools, given the characteristics of the public schools. The above mentioned variation points out the differential role that public and private schools play, depending on a country’s educational system.
7. The effectiveness in reading achievement of private-independent schools compared to that of public schools
In this section we present the results from the second step of the propensity score matching. We only compare pupils who have relatively similar risks (or propensities) to attend a private-independent rather than a public school. We exclude those pupils in private-independent schools who have no comparable (i.e. with a similar risk of attending a private independent school) counterparts in a public school. This strategy leads to the loss of a fairly large number of pupils in the sample, particularly in countries where the private-independent sector is small or obviously skewed towards the better-off families.13 Table 4 summarizes the results of our analyses and the
number of matched pupils. [About here table 4]
The first column of the table presents the raw average difference in reading scores between pupils in private-independent schools and public schools, without any control for covariates. Given the school-choice selectivity discussed in section 6, it is no surprise that pupils of private-independent schools in nearly all countries have higher readings scores on average (except Italy and Switzerland). Quite surprisingly though, pupils of private-independent schools in Taiwan, Indonesia and Japan score significantly lower compared to those in public schools. The second column shows the number of pupils involved in this simple comparison. Because these differences are not controlled for school-choice selectivity and parental background effects, they cannot be said to accurately reflect differences in school effectiveness. Instead, they might only reflect school-choice selectivity.
independent and public schools respectively are registered only in Belgium, Greece, Canada, Israel and Peru. After matching, pupils of private-independent schools in Switzerland, Mexico, Taiwan and Japan score significantly lower than their counterparts in public schools. In the remaining countries the differences in the reading score between pupils of private-independent schools and public schools is no longer statistically significant. Note control of school-choice induced by selectivity (realized through the propensity score matching) changed the results for many countries. Most often, once the propensity score is controlled for, differences in the average reading score between private independent and public schools become statistically insignificant. This shows that controlling for the selectivity of school-choice is important for unmasking ‘true’ school effects.
Although propensity score matching has the advantage of requiring matching on only one dimension, i.e. the propensity score, it has the drawback that similar propensity scores can be the result of different combinations of parent, student and school characteristics. To further verify our results, we have used propensity score matching with Mahalanobis distance on a few key student background indicators. The Mahalanobis distance matching allows for a greater weight to be assigned to the variables on which the distance is computed. We chose to include five variables in the Mahalanobis distance computations, namely highest parental education, highest parental occupational status, family wealth, immigration status and cultural possessions index. This more refined analysis which combines matching on the propensity score together with additional controls for the five covariates (column 6) does not change the results much, compared with the analysis based on the simple nearest neighbour propensity score matching (column 4). After applying this (stricter) form of control for school-choice induced selectivity, significant positive differences in the reading score between pupils of private-independent and public schools persist in Belgium, Greece, Canada, Brazil, and Peru. Pupils of private-independent schools in Mexico, Taiwan, Japan and Thailand score significantly lower than pupils in public schools. In the remaining sixteen countries, the differences in reading scores between pupils of the two school sectors are not significant.
Finally, no apparent relationship could be established between school choice and school effectiveness processes (Table 4). Both clusters derived based on the choice patterns contained countries with a more effective private-independent sector, as well as countries where the public sector is more successful in raising the reading achievement of its pupils.
8. School Choice and School Effectiveness
Propensity score matching can provide a useful tool to differentiate between the effects of school choice and those of school effectiveness. Making this distinction is crucial for a valid estimation of the school sector differentials in effectiveness, i.e. the gains in achievement that are brought about by the school itself rather than as a consequence of its student intake.
who choose private-independent schools for their high socioeconomic school composition and the special programs that these schools run. The second one might be summarized as the choice of the outsiders for a well-equipped school. Private-independent schools in the countries belonging to this cluster are chosen by foreign language speaking pupils from less wealthy families who choose schools with higher material resources. Within these two large groups, one can also distinguish smaller sub-clusters: three within the first cluster encompassing countries where private independent schools are a social class reproduction choice (educational philosophy choice; choice of the rich; choice of the cultural elite) and two within the second cluster grouping countries where private independent schools constitute an outsider strategy (the cultural rich parent; foreigner in poor countries). However, the main finding is that the choice in favour of a private-independent school varies between countries indicating that private-independent schools do not fulfil the same function everywhere. Generalizing Anglo-Saxon examples of private-independent schools to other countries is simply wrong and misleading.
We have also found a large variation in the effectiveness of private-independent schools across countries. After having taken into account the differences between the private-independent and public sectors generated by school choice processes, pupils at private-independent schools in Austria, Brazil, Canada, Greece, Israel, Peru and Switzerland still achieved significantly higher than their counterparts in the public sector. In these seven countries the observed higher reading scores cannot be explained by the school choice processes. The result might be an indication of a higher effectiveness of private-independent schools in these countries. However in Japan, Mexico, Taiwan and Thailand, pupils at private-independent schools scored significantly lower on the reading test than pupils in the public sector. Thus, in these four countries, the school choice processes hide the actual lower effectiveness of private-independent schools, compared to the higher effectiveness of the public sector. Religious or ethnic motives might explain the parental preference for private-dependent schools, despite their lower effectiveness. But also private-inprivate-dependent schools might be a “second choice” for parents if their child fails to pass the competitive entrance examination to the public schools. In the remaining fourteen countries, school choice processes explain the observed higher or lower average reading scores of private-independent schools compared to those of public schools. Interestingly, no relationship between the clusters of a private-independent school choice and the relative effectiveness of the private independent sector in comparison with the public one could be detected.
Our findings contradict neo-liberal theories related to school choice and school effectiveness at least on two counts. On the one hand, we could not find any correlation, at the country level, between school choice and school effectiveness patterns. The lack of a choice-effectiveness link contradicts the existence of a universal consumer logic operating in school markets, whereby parents always choose the most effective schools for their children. In fact, in four countries parents chose to send their children to a private-independent school despite the lower success of this type of schools in raising achievement.
background variables and school composition, that private-independent schools were less effective than public schools in all countries. This finding is not confirmed in this study, as we find higher achievement scores in the private-independent sector for some of the countries included in the analysis. However, our study contains a wider variation of countries than the range Dronkers and Robert (2008a) analyzed, especially due to including more countries outside Europe.
But the findings of our study also indicate that we cannot simply dismiss the higher effectiveness of private-independent schools, at least in some countries, by referring solely to the selectivity argument. Private-independent schools remain significantly more effective than comparable public schools, in some countries, even after complex adjustments and controls for their student intake.
Cross-national variation in both choice and effectiveness patterns related to the private sector points to the potential role played by country specific institutional and social factors. Dissimilarities in the general education system containing the private sector give rise to divergent opportunities and constraints to which private-independent schools must adapt. Also differences in the religious and ethnic composition of public and private schools in the various countries (a factor which we could not take into account) might explain these cross-national variations in choice and effectiveness. Moreover, in some countries, the cleavage between public and private-independent schools might be deep for still relevant historical reasons, while in other countries students move now easily from public to private-independent schools, or vice versa.
Further cross-national analyses are needed to pinpoint the exact institutions and legacies that are involved in moulding both school choice and school effectiveness between the private and the public sectors.
Literature
Alexander, K. L. and A. M. Pallas. 1983. "Private Schools and Public Policy: New Evidence on Cognitive Achievement in Public and Private Schools" Sociology of Education 56:170-182. Ball, S. J. 1993. "Education Markets, Choice and Social Class: The Market as a Class Strategy in
the UK and the USA" British Journal of Sociology of Education 14:3-19.
Ball, S. J. 1997. "On the cusp: parents choosing between state and private schools in the UK: action within an economy of symbolic goods" International Journal of Inclusive Education 1:1-17.
Ball, S. J., R. Bowe and S. Gewirtz. 1995. "Circuits of schooling: A sociological exploration of parental choice of school in social class contexts" Sociological Review 43: 52-78.
Bryk, A. S., V. E. Lee and P. B. Holland. 1993. Catholic schools and the common good. Cambridge (Mass.)/ London: Harvard University Press.
Chubb J. E and T. M. Moe. 1990. Politics, Markets and America's Schools. Washington DC: Brookings Institution Press.
Coleman, J.S. and T. Hoffer. 1987. Public and private high schools. The impact of communities. New York: Basic Books.
Coleman, J. S., T. B. Hoffer and S. Kilgore. 1982. High school achievement: Public, Catholic and other private schools compared. New York: Basic Books.
Corten, R. and J. Dronkers. 2006. "School Achievement of Pupils from the Lower Strata in Public, Private Government-Dependent and Private Government-Independent Schools: A cross-national test of the Coleman-Hoffer thesis" Educational Research and Evaluation 12:179-208.
Dehejia, R. and W. Sadek. 2002. “Propensity score matching methods for non-experimental causal studies” Review of Economics and Statistics 84:151-161.
Dronkers, J. and S. Avram. 2010. “A Cross-national Analysis of the Relations between School Choice and Effectiveness Differences between Private-Dependent and Public Schools” Educational Research and Evaluation 16:151-176.
Dronkers, J. and P. Robert. 2004. "Has educational sector any impact on school effectiveness in Hungary? A comparison of the public and the newly established religious grammar schools" European Societies 6:205-236.
Dronkers, J. and P. Robert. 2008a. "Differences in Scholastic Achievement of Public, Private Government-Dependent and Private-independent Schools: A Cross-National Analysis" Educational Policy 22:541-577.
Dronkers, J. & P. Robert. 2008b. "School Choice in the Light of the Effectiveness Differences of Various Types of Public and Private Schools in 19 OECD Countries" Journal of School Choice 2:260-301.
Echols, F. H. and J. D. Willms. 1995. "Reasons for School Choice in Scotland" Journal of Education Policy 10:143-156.
Gamoran, A. 1996. "Student Achievement in Public Magnet, Public Comprehensive, and Private City High Schools" Educational Evaluation and Policy Analysis 18:1-18.
Godwin, R. K. and F. R. Kemerer. 2002. School Choice Tradeoffs. Liberty, Equity, and Diversity. Austin: University of Texas Press.
Goldring, E. B. and K. J. R. Phillips. 2008. "Parent preferences and parent choice: the public-private decision about school choice" Journal of Education Policy 23: 209-230.
Goyette, K. 2008. "Race, Social Background, and School Choice Options" Equity & Excellence in Education 41:114-129.
Greeley, A. M. 1982. Catholic High Schools and Minority Students. New Brunswick: Transaction Books.
Hoffer, T. B. 1998. "Social Background and Achievement in Public and Catholic High Schools" Social Psychology of Education 2:7-23.
Hoffer, T., A. M. Greeley, and J. S. Coleman. 1985. “Achievement Growth in Public and Catholic Schools” Sociology of Education 58:74-97.
Jarvis, H. and S. Alvanides. 2008. "School choice from a household resource perspective: Preliminary findings from a north of England case study" Community, Work & Family 11:385-403.
Jeynes, W. 2002. "Educational Policy and Effects of Attending a Religious School on the Academic Achievement of Children" Educational Policy 16:406-424.
Langouët, G. and A. Léger. 1994. École publique ou école privée? Trajectoires et réussites scolaires. Paris: Editions Fabert.
Morgan, S. L. 2001. "Counterfactuals, causal effect heterogeneity, and the Catholic school effect on learning" Sociology of Education 74:341-374.
Morgan, S. L. and C. Winship. 2007. Counterfactuals and Causal Inference. Methods and Principles for Social Research. New York: Cambridge University Press.
Neal, D. 1997. "The Effects of Catholic Secondary Schooling on Educational Achievement" Journal of Labor Economics 15:98-123.
Noell, J. 1982. "Public and Catholic Schools: A Reanalysis of "Public and Private Schools" Sociology of Education 55:123-132.
Rosenbaum, O.D. and D. Rubin. 1983. "The central role of the propensity score in observational studies of causal effects“ Biometrika 70:41-55.
Sammons, P., J. Hillman and P. Mortimore. 1995. Key characteristics of effective schools: A review of school effectiveness research. London: Office for Standards in Education and Institute of Education.
Scheerens, J. and R. Bosker. 1997. The Foundations of Educational Effectiveness. Kidlington /New York /Toyko: Pergamon.
Somers, M.-A., P. J.McEwan and J. D. Willms. 2004. “How Effective Are Private Schools in Latin America?” Comparative Education Review 48:48-69
Teddlie, C. and D. Reynolds. 2000. The international handbook of school effectiveness research. London: Falmer.
Vandenberghe, V. and S. Robin. 2004. "Evaluating the effectiveness of private education across countries: a comparison of methods" Labour Economics 11:487-506.
Willms, J. D. 1985. "Catholic-School Effects on Academic Achievement: New Evidence From the High School and Beyond Follow-up Study" Sociology of Education 58:98-114.
Witte, J. F. 2000. The Market Approach to Education. An Analysis of America's First Voucher Program. Princeton: Princeton University Press.
Figure 1 Clusters of choice patterns of private-independent schools versus public school.
0
.2
.4
.6
G
o
w
e
r
d
is
s
im
ila
ri
ty
m
e
a
s
u
re
Aus tria Can
ada
Sw itzer
landUSAItaly Mex
ico
Indo nesi
a Bra
zil
Uru guay
Gre
ece UK Bel
gium Por
tuga l
Isra el
Chi le
Taiw an
Japa n Spa
in
Arg entin
a
Col um
bia
Det of private independent school choice- All countries
TABLE 1: Descriptive Statistics for variables entered in the propensity estimation model per country
Austria Belgium France Greece Italy Portugal Spain Switzer
land
UK Canada Israel New
Zeelan d
USA
Private independent 2.79 1.59 7.87 4.13 2.1 2.1 6.9 2.89 3.87 3.66 5.44 4.39 6.53
Private dependent 6.52 67.58 14.24 0 2.91 6.17 35.66 0.87 0.61 2.81 17.19 0.02 0.53
Public 90.7 30.83 77.89 95.87 94.99 91.73 57.44 96.24 95.52 93.53 77.37 95.6 92.94
Gender (% girls) 49.77 48.2 50.74 50.18 50.58 52.41 50.57 48.89 50.42 50.72 53.03 49.94 50.35
Grade (average) 9.47 9.63 9.48 10.07 9.84 9.36 9.67 8.84 10.91 9.82 9.9 10.63 9.8
Grade (range) 6 to 11 7 to 12 7 to 11 7 to 11 7 to 11 5 to 11 7 to 11 7 to 12 9 to 12 7 to 12 7 to 12 8 to 13 7 to 12
Immigrant (% ) 17.39 22.47 24.03 12.12 8.22 12.26 7.43 36.99 13.39 18.7 38.09 35.75 20.47
First generation immigrant (%) 8.02 6.57 2.87 6.12 3.2 3.31 3.63 12.15 3.3 5.55 10.72 15.64 6.66
Second generation immigrant (%) 9.37 15.9 21.16 6 5.02 8.96 3.8 24.46 10.09 13.15 27.36 20.11 13.82
Foreign language used at home (%) 8.27 13.6 5.12 2.99 12.1 1.66 1.58 12.96 2.49 6.23 11.08 9.14 10.71
Index of cultural possessions (average) 0.01 -0.3 -0.3 0.15 0.22 -0.09 0.18 -0.25 -0.17 -0.09 0.06 -0.17 -0.1
TABLE 1: Descriptive statistics for variables entered in the propensity estimation model per country (continued)
Austria Belgium France Greece Italy Portugal Spain Switzer
land
UK Canada Israel New
Zealan d
USA
ISCED 0/1 2.47 5.87 3.19 9.51 5.46 32.71 18.62 5.54 2.36 1.85 4.19 5.3 3.11
ISECD 2 7.49 7.65 4.87 19.07 29.1
7
22.23 23.56 20.49 6.74 6.89 5.1 8.13 5.6
ISECD 3 b. c 38.46 8.77 23.98 7.86 11.6
1
11.36 6.48 28.57 24.5
6
0 7.8 20.28 2.11
ISCED 3a. 4 27.38 25.56 20.36 26.64 30.4
4
11.11 21.73 18.99 25.7
5
40.49 19.01 22.58 36.51
ISCED 5 b 13.61 27.61 15.14 14.8 10.7
1
8.16 9.28 14.47 16.9
3
22.49 24.7 18.16 24.15
ISCED 5a. 6 10.59 24.54 32.45 22.13 12.1
2
14.43 20.34 11.94 23.6
7
28.27 39.2 25.53 28.52
ISCED 0/1 1.71 5.46 2.85 11.03 6.31 32.96 19.06 4.58 3.44 3.42 4.18 6.07 3.74
ISECD 2 5.8 7.12 5.35 18.11 28.5
8
22.37 20.35 17.65 10.3
4
10.99 6.14 7.78 6.61
ISECD 3 b. c 34.03 7.73 21.61 9.38 9.19 11.95 6.27 25.31 26.1
4
0 9.87 14.6 2.23
ISCED 3a. 4 21.45 26.66 24.01 21.98 32.3
2
10.64 20.43 11.9 23.5
6
41.3 16.95 33.4 37.54
ISCED 5 b 21.61 22.44 9.7 12.49 9.73 7.91 11.66 19.91 11.5
5
16.85 25.26 10.88 20.49
ISCED 5a. 6 15.4 30.59 36.49 27.01 13.8
6
14.16 22.24 20.65 24.9
7
27.44 37.6 27.27 29.39
ISCED 0/1 0.87 3.1 1.77 4.87 2.05 26.33 12.12 3 1.41 0.86 2.12 3.18 1.92
ISECD 2 3.39 3.88 2.73 12.59 20.7
9
20.18 16.81 13.44 4.35 3.77 3.13 4.08 3.71
ISECD 3 b. c 27.73 5.53 14.88 7.6 9.43 12.46 5.86 22.92 19.2
1
0 5.89 12.36 1.48
ISCED 3a. 4 24.69 23.75 21.67 24.83 35.9
4
12.7 22.64 14.61 23.7
2
33.58 14.57 26.66 31.28
ISCED 5 b 24.23 26.8 14.61 16.02 12.7
9
8.76 13.15 21.29 17.4
5
23.48 25.23 17.47 22.93
ISCED 5a. 6 19.1 36.94 44.33 34.09 18.9
9
19.58 29.42 24.75 33.8
5
38.31 49.05 36.24 38.69
TABLE 1: Descriptive statistics for variables entered in the propensity estimation model per country (continued)
Austria Belgium France Greece Italy Portugal Spain Switzer
land
UK Canada Israel New
Zealan d
USA
value reading (average) 496.14 510.72 503.2 467.11 485.83 476.52 484.93 494.87 508.78 514.45 451.29 524.32 495.03
Girl schools% 1.79 0.35 0 0.14 0.1 0 0.23 0.42 7.44 0.63 13.4 16.34 1.39
Boy schools% 1.15 0.92 0 0.45 1.41 0.05 0.91 0.11 5.23 0.43 9.43 13.15 1.02
Mixed schools % 97.06 98.73 100 99.42 98.49 99.95 98.85 99.47 87.33 98.94 77.16 70.51 97.59
Social composition (% parent's having tertiary education)-(average)
19.04 36.57 44.08 34.09 18.96 19.57 29.34 24.71 33.48 38.29 48.9 35.9 38.58
School size 586.45 693.13 892.09 284.12 664.88 974.41 709.66 455.52 978.81 756.66 831.83 1095.14 1321.84
Admission-parents' endorsement of the school’s educational philosophy - %
45.85 71.92 91.85 34.54 35.1 56.57 44.86 31.25 46.84 28.34 75.02 45.58 36.06
Admittance-special programs considered- % 79.26 69.96 100 61.22 76.89 86.04 53.94 59.72 57.32 72.69 88.91 73.18 71.87
Teacher-student ratio 12.23 9.49 12.55 9.43 8.97 9.6 12.8 11.95 15.03 16.35 13.03 15.14 15.38
Computer-student ratio (average) 0.22 0.15 0.13 0.08 0.17 0.09 0.11 0.17 0.25 0.24 151.4 0.22 0.28
Educational resources (average) 0.21 -0.09 -0.49 0.16 0.21 -0.18 0.01 0.33 0.25 -0.03 -0.03 0.18 0.2
TABLE 1: Descriptive statistics for variables entered in the propensity estimation model per country (continued)
Argentina Brazil Chile Colombia Mexico Peru Uruguay Taiwan Indonesia Japan Korea Thailand
Private independent 7.25 10.22 11.88 12.52 9.77 9.7 20.5 40.08 29.38 27.06 22.7 6.71
Private-dependent 23.07 0 39.67 3.7 0.09 1.62 0 0 4.37 0.61 28.44 4.32
Public 69.69 89.78 48.45 83.78 90.14 88.68 79.5 59.92 66.25 72.33 48.86 88.97
Gender (% girls) 53.75 53.61 49.85 54.38 53.77 50.79 49.84 47.57 50.49 49.99 44.99 57.56
Grade (average) 9.63 8.46 9.68 9.59 9.75 9.35 9.45 9.69 9.29 10 9.99 9.55
Grade (range) 7 to14 7 to 11 7 to 11 7 to 11 7 to 12 7 to 11 7 to 11 8 to 11 7 to 12 10 9 to 11 7 to11
Immigrant (% ) 7.01 1.67 1.72 1.32 2.87 1.33 4.11 2.25 0.52 0.79 0.04 0.78
First generation immigrant (%) 0.95 0.23 0.65 0.22 1.55 0.29 1.2 0.41 0.21 0.25 0 0.1
Second generation immigrant (%) 6.06 1.45 1.07 1.09 1.33 1.04 2.91 1.84 0.31 0.54 0.04 0.69
Foreign language used at home (%) 0.58 0.57 0.44 0.38 1.2 1.22 1.89 0.55 24.75 0.27 0.1 30.51
Index of cultural possessions (Average) -0.07 -0.24 -0.12 0.03 -0.49 0.06 0.01 0.15 -0.6 -0.4 0.15 -0.1
Family wealth (Average) -1.18 -1.35 -0.96 -1.67 -1.15 -1.75 -0.65 -0.2 -1.84 -0.18 -0.12 -1.22
ISCED 0/1 Mother education 18.1 35.15 9.02 35.75 36.53 4.11 26.86 9.73 37.05 1.91 7.15 41.57
ISECD 2 22.54 25.85 18.85 17.54 25.65 37 8.36 20.5 25.46 4.89 14.95 29.89
ISECD 3 b.c 7.82 5.46 15.17 0 3.44 16.26 0.9 0 6.32 11.24 17.63 4.52
ISCED 3a. 4 9.6 11.07 23.93 13.59 9.68 0 12.09 0 20.38 35.05 30.87 11.7
ISCED 5 b 19.49 8.02 18.29 17.01 10.56 23.79 22.01 59.5 3.89 25.52 13.1 1.24
ISCED 5a. 6 22.47 23.44 14.73 16.11 14.15 18.84 19.78 10.27 6.91 21.4 16.3 11.09
ISCED 0/1 Father education 19.66 27.88 8 35.96 31.4 1.3 27.81 7.97 28.78 3.78 5.65 36.61
ISECD 2 22.88 24.59 17.56 14.62 24.47 24.45 20 19.93 23.1 7.55 11.6 27.7
ISECD 3 b.c 8.62 5.63 14.85 0 3.62 15.38 2 0 8.79 13.24 16.32 6.19
ISCED 3a. 4 10.5 10.39 23.55 13.44 9.92 0 10.11 55.42 23.82 26.59 24.83 14.77
ISCED 5 b 17.12 9.4 16.97 16.51 12.28 29.87 23.73 0 4.86 8.06 12.64 2.29
ISCED 5a. 6 21.22 22.11 19.07 19.47 18.31 29 16.35 16.69 10.65 40.78 28.96 12.43
Mother SES (average) 43 37.23 33.82 39.86 41.28 38.78 41.59 45 33.96 46.61 41.18 33.34
FATHER SES (average) 41.86 38.17 38.69 39.85 39.29 38.52 42.14 46.01 34.16 44.87 44.37 34.72
value reading (Average) 403.48 391.58 432.18 390.3 424.86 334.57 423.58 506.67 377.15 507.68 536.61 429.48
Girl schools% 1.76 0.1 7.16 1.45 0.29 18.54 0 4.45 0.56 8.04 35.32 2.95
Boy schools% 1.2 0.08 5.48 0.8 0.09 0 0 0.43 1.44 5.35 18.4 0.41
Mixed schools % 97.03 99.82 87.36 97.75 99.61 81.46 100 95.12 98 86.61 46.28 96.65
education)-average 31.15 24.27 13.08 31.3 15.18
School size 631.4 1215.75 1092.53 1765.75 892.92 1140.64 461.9 2264.98 635.55 863.95 1198.09 1687.19
Admission-parents' endorsement of the
school’s educational philosophy 67.06 53.15 62.65 90.17 89.92 100 33.46 72.88 72.8 52.76 40.27 80.39
Admittance-special programs 83.9 53.65 77.41 54.54 24.66 84.15 19.39 54.3 77.28 49.6 60.25 89.26
Teacher-student ratio 10.2 52.03 26.91 64.98 57.1 100 42.43 65.85 18.49 78.5 17.72 22.49
Computer-student ratio 80.9 32.42 51.68 24.95 29.13 23.3 16.48 17.46 19.25 14.03 0.25 1.8
Educational resources -0.03 0.09 -0.16 0.12 0.09 273.61 0.06 0.2 -0.58 0.19 0.16 -0.1
Teacher shortage (neg scale) -0.58 -0.57 0.19 -1.13 -0.53 1.18 -0.63 0.66 0.96 0.14 -0.49 0.66
Table 2: The coefficients of the logistic regression predicting the choice of a private-independent school relative to a public school per country. including tuition. Regressi on coefficie nts Gender (male) Immigra nt (First or second generatio n) Foreign language used at home Cultural possessio ns Family wealth Mother ISCED Father ISCED Mother SES Father SES School-soc composit ion School size Admissi on-parents' endorse ment of the school’s educatio nal philosop hy Admissi on- special program Student-teacher ratio Compute r-student ratio Educatio nal resources Constant EUROPE
Austria 0.770* (0.144) 0.0006 (0.233) -0.448 (0. 383) 0.004 (0.083) 0.180* (0.093) -0.180* (0.074) 0.010 (0.071) 0.014* (0.005) 0.002 (0.005) 5.992* (0.419) -0.005* (0.000) 2.313* (0.272) -0.947* (0.338) 0.106* (0.013) 1.531* (0.380) 0.207* (0.077) -6.325 (0.496) Belgium 0.578*
(0.153) -1.642* (0.264) 0.901* (0.252) 0.293* (0.084) 0.020 (0.096) -0.046 (0.068) -0.036 (0.068) 0.013* (0.005) 0.016* (0.005) 1.424* (0.443) -0.0009* (0.0003) 4.798* ( 0.419) -1.190* (0.162) 0.054* (0.015) 5.090*
(0.585) 0.443* (0.072) -9.080 (0.669) France -0.080
(0.150) -0.547* (0.225) 0.441 (0.456) 0.021 (0.083) 0.266* (0.110) 0.025 (0.070) -0.084 (0.068) 0.008 (0.005) -0.009 (0.005) 3.813* (0.513) -0.001* (0.0002) Dropped † Dropped † -0.018 (0.028) -4.947* (1.370) 0.016 (0.083) -1.691 (0.649) Greece -0.071
(0.206) -0.094 (0.320) -2.436 (1.607) -0.096 (0.132) 0.387* (0.135) -0.200 (0.106) -0.242* (0.107) 0.021* (0.007) 0.030 * (0.008) 16.419 * (1.088) -0.002 (0.001) 0.863* (0.310) 2.416* (0.374) 0.202* (0.049) 21.164* (1.530) -0.446* (0.118) -18.576 (1.339) Italy -0.140
(0.136) 0.027 (0.249) -1.346* (0.311) -0.232* (0.094) 0.384* (0.095) -0.006 (0.060) -0.071 (0.060) 0.009 (0.005) 0.005 (0.005) 6.412* (0.418) -0.010* (0.0005) 2.580* (0.176) 0.321 (0.279) 0.080* (0.012) -0.499 (0.407) 0.319* (0.076) -4.402 (0.426) Portugal 0.214
(0.198) 0.690* (0.241) 1.411* (0.666) 0.097 (0.140) 0.069 (0.134) -0.0007 (0.084) 0.012 (0.085) 0.003 (0.007) 0.002 (0.008) 9.045* (0.594) -0.001* (0.0002) 2.089* (0.418) -1.734* (0.407) 0.132* (0.009) -0.068 (0.493) 0.804* (0.126) -8.568 (0.666) Spain 0.163
UK 0.251 (0.129) 0.790* (0.156) 1.109* (0.398) 0.704* (0.075) 0.403* (0.080) -0.198* (0.059) -0.180* (0.054) 0.028* (0.004) 0.029* (0.004) 12.056* (0.545) -0.0006* (0.0002) -0.398* (0.182) 0.832* (0.204) -0.97*1 (0.038) -3.273* (0.600) 0.454* (0.062) 1.394 (0.585) Regressi on coefficie nts Gender (male) Immigra nt (First or second generatio n) Foreign language used at home Cultural possessio ns Family wealth Mother ISCED Father ISCED Mother SES Father SES School-soc composit ion School size Admissi on-parents' endorse ment of the school’s educatio nal philosop hy Admissi on- special program Student-teacher ratio Compute r-student ratio Educatio nal resources Constant
OTHER INDUSTRIALIZED NATIONS
Canada 0.575* (0.117) 0.350* (0.139) -0.747* (0.224) 0.300* (0.067) 0.240* (0.080) -0.090 (0.064) 0.034 (0.060) -0.008* (0.004) 0.014* (0.004) 12.690* (0.433) -0.007* (0.0003) 2.800* (0.144) -0.158 (0.135) -0.100* (0.020) -0.660 (0.344) 0.935* (0.068) -7.934 (0.554) Israel 0.024 (0.186) -0.060 (0.195) 0.650* (0.286) 0.102 (0.107) -0.520* (0.113) 0.043 (0.109) 0.071 (0.098) 0.002 (0.006) 0.0005 (0.006) 3.772* (0.538) -0.002* (0.0003) 1.496* (0.334) -2.266* (0.318) -0.018 (0.020) 0.0007 (0.0004) 0.013 (0.090) -3.090 (0.733) New Zealand 0. 703* (0.185) 0.154 (0.188) -1.016* (0.392) 0.014 (0.095) 0.391* (0.108) -0.120 (0.076) 0.038 (0.079) 0.006 (0.006) 0.018* (0.005) 6.297* (0.588) -0.0003 (0.0003) Dropped ‡ 0.802* (0.340) 0.343* (0.034) 17.491* (1.006) 0.825* (0.076) -17.764 (1.089) USA 0.284* (0.121) 0.720* (0.210) -0.443 (0.362) 0.184* (0.066) -0.076 (0.079) -0.160* (0.070) -0.282* (0.064) 0.015* (0.004) 0.019* (0.004) 7.010* (0.366) -0.003* (0.0002) 2.890* (0.172) 0.517* (0.205) -0.083* (0.020) -1.072* (0.392) 0.621* (0.066) -4.242 (0.513) LATIN AMERICA Argentin a 0.664* (0.260) 0.892 (0.642) 1.548 (1.871) -0.118 (0.158) 0.124 (0.157) 0.200 (0.108) 0.170 (0.105) -0.020* (0.009) -0.016 (0.008) 15.92* (1.416) -0.001* (0.0004) 2.220* (0.578) -2.056* (0.713) 0.303* (0.030) 55.455* (5.681) 0.664* (0.141) -16.18 (1.551) Brazil -0.162
(0.120) 0.085 (0.423) -0.607 (1.348) -0.058 (0. 074) 0.898* (0.081) 0.011 (0. 041) -0.042 (0.039) 0.009* (0.004) 0.008* (0.004) 7.528* (0.347) -0.0006* (0.0000) 0.499* (0.152) 0.974* (0.156) 0.004 (0.005) 1.940* (0.658) 0.699* (0.046) -5.123 (0.374) Chile 0.105
Mexico -0.442* (0.093) 0.016 (0.279) -1.988 (1.112) 0.101 (0.056) 0.534* (0.060) -0.021 (0.033) -0.023 (0.033) 0.004 (0.003) 0.000 (0.003) 5.453* (0.245) -0.002* (0.0001) 1.106* (0.101) 0.490* (0.112) -0.017* (0.004) 5.305* (0.618) 0.399* (0.038) -2.557 (0.304) Peru -1.151*
(0.325) -1.341 (1.478) -3.259 (4.106) -0.148 (0.174) 0.281 (0.148) 0.079 (0.129) -0.200 (0.137) 0.011 (0.011) 0.023* (0.010) 2.437* (0.878) -0.002* (0.0003) Dropped † Dropped † 0.0008 (0.024) -0.011 (0.059) -1.676* (0.253) 2.362 (0.976) Uruguay -0.375*
(0.163) 0.341 (0.478) -1.110 (1.237) -0.136 (0.103) 0.768* (0.109) -0.089 (0.058) 0.092 (0.052) 0.015* (0.005) 0.007 (0.005) 10.990* (0.647) -0.003* (0.0005) 4.111* (0.210) 1.240* (0.180) 0.033* (0.016) 1.518 (1.809) 1.980* (0.100) -6.235 (0.512) Regressi on coefficie nts Gender (male) Immigra nt (First or second generatio n) Foreign language used at home Cultural possessio ns Family wealth Mother ISCED Father ISCED Mother SES Father SES School-soc composit ion School size Admissi on-parents' endorse ment of the school’s educatio nal philosop hy Admissi on- special program Student-teacher ratio Compute r-student ratio Educatio nal resources Constant ASIA Taiwan -0.065 (0.077) 0.275 (0.266) 0.771 (0.572) -0.046 (0.050) 0.391* (0.065) -0.059 (0.037) -0.005 (0.035) 0.012* (0.003) -0.0007 (0.003) 2.035* (0.277) 0.0001* (0.0000) 1.804* (0.092) 1.403* (0.111) 0.252* (0.009) 5.080* (0.316) 0.370* (0.029) -9.223 (0.332) Indonesi a 0.139* (0.069) -0.224 (0.450) 0.236 (0.226) -0.209* (0.041) 0.363* (0.037) 0.023 (0.030) -0.049 (0.030) 0.009* (0.003) 0.0004 (0.003) -1.323* (0.367) -0.003* (0.0001) 0.869* (0.125) 0.413* (0.131) 0.117* (0.006) 0.001* (0.0003) 0.051* (0.020) -2.088 (0.242) Japan -0.507*
(0.071) 0.312 (0.404) 0.494 (0.767) 0.005 (0.042) 0.078 (0.056) 0.043 (0.038) -0.022 (0.032) 0.006* (0.002) 0.003 (0.002) 1.507* (0.194) 0.002* (0.0001) 2.006* (0.077) -0.097 (0.081) -0.167* (0.013) -0.767* (0.273) 0.220* (0.035) -1.390 (0.295) Korea -0.386* (0.087) Dropped ‡ Dropped ‡ 0.064 (0.053) 0.210* (0.061) -0.041 (0.038) -0.031 (0.037) -0.004 (0.003) 0.009* (0.003) 4.032* (0.260) 0.001* (0.0001) -0.352* (0.152) 0.436* (0.094) 0.018 (0.026) -2.835* (0.512) 0.379* (0.051) -3.703 (0.547) Thailand -0.270*
Table 3: Means of the coefficients of the logistic regressions (table 2) for two clusters
Name cluster Male Immi grant
Foreign language used at home
Cultural Posses sions
Family wealth
Mother ISCED
Father ISCED
Mother SES
Father SES
School Socio-economic com position
School size
Admission parents' endorsement of school’s educational philosophy
Admission Special program
Teacher Student ratio
Computer Student ratio
Educational resources
Cluster A (11)
Social class reproduction
.08 .24 -.72 .09 .39 -.08 -.07 .01 .01 8.09 -.00 1.86 .62 -.06 2.33 .53
Cluster B (9)
Good-equipped school for outsiders
.08 .13 1.07 .03 .13 .03 -.00 .00 -.00 6.91 -.00 1.99 -1.22 .16 11.41 .54
Cluster A1 (4)
Educational philosophy
.42 .42 -.44 .13 .13 -.10 -.08 .01 .02 7.86 -.00 2.71 .04 -.03 -.12 .59
Cluster A2 (5)
Richness -.20 .05 -.96 -.11 .59 -.02 -.02 .01 .00 5.81 -.00 1.83 .69 .04 1.65 .69
Cluster A3 (2)
Cultural elite
.09 .35 -.66 .51 .39 -.20 -.21 .02 .03 14.24 -.00 .23 1.62 -.38 8.95 .00
Cluster B4 (7)
Cultural rich parents
.07 -.32 .96 .04 .13 .02 -.04 .01 .00 5.20 -.00 2.23 -1.03 .19 7.88 .32
Cluster B5 (2)
Foreigner in poor countries
.11 1.69 1.47 .00 .13 .09 .09 .00 -.02 12.89 -.01 1.14 -1.88 .05 23.74 1.32
Table 4: Effect of attending a private-independent school vs. a public school on reading achievement Simple reading score
difference between private and public schools pupils
No of observed pupils
Reading score difference of the private- nearest public school neighbour in propensity scores
No of pupils (private/ public)
Reading score difference of the private –public school pupils based on nearest neighbour and Mahalanibis distance
No of pupils (private/ public) Europe
Austria 21.52 (5.51)*** 7482 9.19 (9.11) (243/ 194) 8.57 (8.51) (243/207) Belgium 46.98 (5.80)*** 3993 25.63 (9.14)** (242/183) 25.68 (9.93)** (258/194) France 11.52 (5.68)* 1993 5.84 (8.12) (228/194) 2.51 (7.96) (228/198) Greece 61.03 (5.03) *** 7310 129.70 (23.99)*** (157/ 62) 207.88 (40.83)*** (357/ 61 ) Italy 7.52 (4.55) 17678 -10.40 (11.92) (368/ 230) -19.21 (10.67) (368/ 225 Portugal 60.72 (6.13) *** 8460 -8.44 (15.22) (115/ 74) -27.17 (29.67) (204/81) Spain 38.10 (2.04)*** 12500 5.35 (27.36) (1273/ 171) 16.01 (11.93) (1273/188) Switzerland 0.70 (3.72) 16244 -16.25 (7.32)* (509 /375) -13.90 (7.34) (509/386) Other industrialized
UK 74.59 (2.97)*** 19104 12.23 (11.34) (648/ 258) 7.93 (9.55) (648/ 265) Canada 46.90 (2.54)*** 27592 44.05 (10.35)*** (863/ 323) 41.45 (10.49) ** (1121 /336) Israel 32.32 (7.92) *** 2048 34.46 (12.77) ** (153/ 111) 26.48 (17.38) (169/ 113) New Zealand 42.19 (5.21) *** 3407 12.16 (9.84) (260/ 164) 25.24 (13.04) (353/165) USA 20.69 (5.36)*** 4186 2.01 (10.43) (276/ 163) 6.88 (11.49) (276/ 152) Latin America
Uruguay 97.23 (3.09)*** 5665 23.69 (14.16) (362/ 159) 22.48 (22.18) (1493/174) Asia
1This article is one of the products of the cross-national project „Religious education in a multicultural society: School
and home in comparative context”, directed by Emer Smith (Economic & Social Research Institute, Dublin) and financed by the European Commision within the 7th Frame Work (FP7-SSH-2007-1- REMC).
2 In subsequent studies, we will compare the choice/effectiveness gaps between public and private-independent schools,
as well as compare school effects concerning student attitudes on environmental issues and school climate.
3
We use for the description of this technique the article of Frisco, Muller & Frank (2007), who use this technique in their analysis of the effects of parental divorce on children’s well-being.
4 We use nearest neighbour and nearest neighbour with Mahalanobis distance matching; 5
Normally, this should not be a big problem; see Morgan & Winship (2007)
6 The PISA survey does not distinguish between denominational and non-denominational schools.
7 We could only use the first PISA wave for France, because the public data set of the second and third PISA wave do
not contain valid values for French public and private school indicator. We have to assume that this private-public distinction has become a state-secret, too annoying for the secular French Republic to be published.
8 Parental endorsement figures in the admission policies of all private-independent schools in France, New Zealand and
Peru, therefore a coefficient could not be computed for this variable in these five countries.
9 This is a negative coefficient in table 2, because the variable is the student-teacher ratio.
10 Based on country of birth of (one of) the parents outside the country of birth and/or the foreign language used at
home.
11
Given the different measurement scales of variables, we multiplied the coefficient by the existing range in the sample to compute a maximum effect; also-the analysis uses the Gower measure and the Ward’s method of clustering.
12
We had to delete from the cluster analysis those countries (France, Korea, New Zealand, Peru, Thailand) for which not all parameters are available.
13 Information about the characteristics of the matched treated and control pupils and their parents is available from the