Munich Personal RePEc Archive
The impact of immigration on Canada’s
labour market
Grady, Patrick
Global Economics Ltd.
October 2009
Online at
https://mpra.ub.uni-muenchen.de/25148/
F
o
to
li
a
C
anada’s immigration levels have been very high since the Mulroney government opened the door more widely in the mid-1980s. Over 250,000 new permanent residents and 113,000 temporary foreign workers were welcomed to Canada in 2006 (Citi-zenship and Immigration Canada, 2006). Bringing in such a large number of permanent and tempo-rary new residents to participate in the Canadian labour market has wide-ranging implications for the Canadian economy, particularly for Canada’s labour market. Yet there is very little understanding of these impacts and their implications for both existing Canadian residents and the new arrivals.Labour market impact
The impact of immigration on the labour market has many dimen-sions. It encompasses labour force participation rates, employment rates, and unemployment rates for
immigrants. It also includes im-migrants’ wages and earnings and reflects the indirect effects of an increased immigrant labour supply on the labour market outcomes of the Canadian-born and earlier co-horts of immigrants. These impacts are all compounded by the entry of large numbers of temporary foreign workers who also must be absorbed by the labour market.
Up until around 1980, the pat-tern (as revealed by the censuses) was that new immigrants started out earning about 80% or so of the equivalent wage of a Canadian-born, but then moved up to—and even beyond—the average wage over a 10- to 20-year period. But in sub-sequent years—at the same time as Canada’s source countries changed, as did other characteristics of im-migrants, such as language and job experience—there was a substantial deterioration in the labour market performance of immigrants over time (Picot and Sweetman, 2005). In 1993, the point system—which since its introduction in 1967 has
selected immigrants on the basis of “points” earned for such factors as age, education, knowledge of Eng-lish and/or French, work experience, arranged employment, and adapt-ability—was modified to put more emphasis on education. Selecting immigrants based on their educa-tion rather than their specific job
PATRICK GRADY
The impact of
immigration
on Canada’s
labour
market
F
o
to
li
Figure 1: Immigration of family class and skilled workers, 1980-2006
Immig
ran
[image:3.612.235.532.98.250.2]ts (000s)
Figure 2: Immigrants, 15+ years of age, by level of education, 1980-2006
Source: Citizenship and Immigration Canada, 2007. Source: Citizenship and Immigration Canada, 2007.
0 30 60 90 120 150
06 04 02 00 98 96 94 92 90 88 86 84 82 80
0 30 60 90 120 150
06 04 02 00 98 96 94 92 90 88 86 84 82 80
Immig
ran
ts (000s)
www.fraserinstitute.org
Fraser Forum 12/09
29
skills has been called the “humancapital” approach. This approach can be contrasted with the “occupational needs” approach, which attempts to identify occupational classes where workers are in short supply and ad-mit immigrants in those classes.
In order to improve the la-bour market performance of new immigrants, starting in 1994 the Skilled Class of immigrants admit-ted on the basis of their qualifica-tions was increased and the Family Class admitted on the basis of their family relationships with Canadian residents was decreased. This move was reinforced in 2002 when the point system was changed so that more points would be awarded for a trade certificate or second degree, and fewer would be awarded for experience. The result of these two policy changes was an increase in the Skilled Class of immigrants relative to the Family Class (figure 1) and a dramatic increase in the education level of immigrants (figure 2).
While there has been some im-provement since 2001 as the labour market has tightened, the employ-ment rate of recent immigrants in 2006 (defined in the census as those arriving between 2001 and 2006) was substantially lower than for the Canadian-born, particularly among women (table 1). The unemployment rate has come down, especially for recent immigrant men, but was al-most twice as high for men and three times as high for women as for the Canadian-born. The labour market performance of recent immigrants is poorest among recent immigrants from Africa and, to a lesser extent, Asia and Latin America (table 2). More ominously, judging from what happened in 2001 when unemploy-ment rose (as shown in table 1), any downturn in the labour market re-sulting from the current economic slowdown is likely to adversely and disproportionately affect recent im-migrants from the source countries with the poorest performance.
Table 1: Employment and unemployment rates (%) of recent immigrants and Canadian-born aged 25 to 54 (%)
Men Women
Emp. Rate Unemp. Rate Emp. Rate Unemp. Rate
Recent immigrants*
2001 74.5 11.4 53.2 15.7 2006 78.6 9.3 56.8 14.3 Canadian born
2001 85.7 6.3 76.3 5.7 2006 86.3 5.2 78.5 5.0
*Note: Recent immigrants are defined as those being in the country for less than five years.
Source:Statistics Canada, 2008a: 30.
Skilled workers
Family class
University
[image:3.612.236.519.332.483.2]Figure 3: Ratio of earnings of immigrants to earnings of the Canadian-born, by level of education and sex
R
a
tio t
o C
anadian born
Source: Statistics Canada, 2008b: 22.
0.0 0.2 0.4 0.6 0.8 1.0
2005 2000
1990 1980
Male with degree Female with degree
Male with no degree Female with no degree
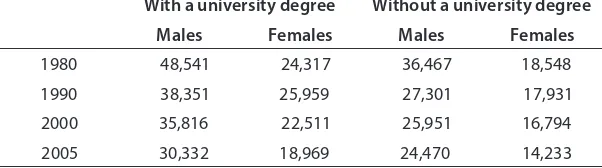
Over the last 25 years, in spite of the changes in immigration policy introduced by the federal government, the earnings of recent immigrants have continued to dete-riorate relative to those of equiva-lent Canadian-born workers (figure 3). The earnings of new immigrant men with a university degree has fallen dramatically to less than half of that of Canadian-born men, and the earning of new immigrant woman with a university degree has dropped to almost 40% of that of Canadian-born women. In 2005, recent immigrant men earned only $30,332 if they had a university de-gree (compared to $62,566 for Cana-dian-born men) and $24,470 if they did not (compared to $40,235 for the Canadian-born) (table 3). Re-cent immigrant women earned only $18,969 with a degree (compared to $44,545 for Canadian-born women) and $14,233 without (compared to $25,590 for the Canadian-born).
[image:4.612.77.543.106.248.2]The gap is greatest among those with a university degree; recent im-migrants in that group earn less than half of the wages earned by the Ca-nadian born. The deterioration in wages is largest among women with no degree and men with a univer-sity degree. Most troubling of all is
Table 2: Low-income rates (%) for immigrant economic families, 2000, total and by place of origin
Period of immigration Total Before
1961
1961-1970
1971- 1980
1981- 1990
1991- 2001
1991- 1995
1996- 2001
Immigrant population 19.1 6.8 8.2 10.4 17,2 33.6 25.2 41.2
Place of origin:
United States 10 4.2 5.8 7.5 9.7 19.2 13.3 23.2 Europe 10.9 6.9 8.4 8.2 10.5 24.7 14.5 33.7 Africa 28.1 7.1 7.2 10 20.7 42.6 34.8 48.8 Asia 26.9 8.7 8.3 11.3 19.4 36.8 27.8 44.6
Note: The figure for the non-immigrant population is 11.2%. Source: Statistics Canada, 2002.
the downward trend in the relative performance of recent immigrants, which showed no signs of abating even as the labour market tightened between 2001 and 2006. And this decline predates the recent deterio-ration in the labour market caused by the recession, which will only exacerbate the already poor perfor-mance of immigrants relative to the Canadian born.
Why are immigrants
doing so poorly?
[image:4.612.240.527.339.526.2]www.fraserinstitute.org
Fraser Forum 12/09
31
and produced many high-qualityresearch studies that analyze the available data to find out why im-migrants are doing so poorly in the labour market.
Picot and Arthur Sweetman (2005) have provided a convenient survey of the studies. They attribute the decline in entry-level earnings and increasing low-income rates to: (1) the changing characteristics of immigrants, including country of origin, language, and education, which appear to account for about a third of the increase in the earn-ings gap; (2) the decreasing returns on foreign work experience, which explain another third; and (3) the decline in labour market outcomes for all new labour force entrants, including immigrants. They also discuss a possible reduction in the return on education and differences in education quality. Put simply, the research shows that Canadian em-ployers do not value foreign experi-ence and heavily discount the value of foreign education. A lack of flu-ency in English or French is also a problem (Grondin, 2005). A more recent study by Picot (2008) attribut-ed much of the recent decline to the downturn in high tech, combined with the increasing concentration of immigrants in IT and engineer-ing. This provides a good example of the difficulty the government has in selecting the people most in demand in the labour market.
Relative poverty
increasing among
immigrants
The poor performance of recent im-migrants in the labour market has caused a much larger proportion of recent immigrants than Canadian -born to fall below Statistics Can-ada’s Low Income Cut-Off (LICO), which is the most widely used, though still controversial, measure of the incidence of low income or “relative” poverty (for a discussion about the difference between rela-tive and absolute poverty, see Sarlo, 2006, 2008). By this measure, the incidence of low income has been highest among recent immigrants from Africa and Asia (figure 3). This increase in the incidence of low in-come among immigrants helps to explain why income inequality has been increasing in the main immi-grant-receiving centers of Toronto, Montreal, and Vancouver, where im-migrants are becoming increasingly ghettoized (Hou and Picot, 2004).
[image:5.612.72.373.112.196.2]While relative poverty, as de-fined by the LICO, has been rising among the immigrant community, it has been falling among the Canadi-an born (Grady, 2005). As a result, a growing disparity between rich and poor is emerging along ethnic and racial lines. There is a risk that this might undermine the dynamic of intergenerational upward mobility Table 3: Median earnings, in 2005 constant dollars, of male and
female recent immigrant earners aged 25 to 54 ($)
With a university degree Without a university degree Males Females Males Females
1980 48,541 24,317 36,467 18,548 1990 38,351 25,959 27,301 17,931 2000 35,816 22,511 25,951 16,794 2005 30,332 18,969 24,470 14,233
Source: Statistics Canada, 2008b: 22.
that has made Canadian immigra-tion policy so successful in the past.
Discussion and
recommendations
The fundamental problem, which few are willing to acknowledge and even fewer willing to do anything about, is simply that, using the ex-isting selection system, it is not pos-sible to admit annually as many as 250,000 immigrants who are capable of doing well in the Canadian labour market, despite 16 years of economic expansion, during which the unem-ployment rate dropped below 6%. The situation can only worsen as un-employment climbs, as is happening now as Canada faces the worst reces-sion of the post-War period.
future employers and prevent them from ever finding professional or skilled jobs.
The only way to ensure that new immigrants will do better in the Canadian labour market is to be more selective in choosing them. This means that the selection system will have to be radically revamped to make sure that it correctly identi-fies the immigrants who will really succeed in the labour market, rather than those who have formal educa-tion but few practical skills. Then the economic performance of the immi-grants who are admitted will have to be monitored much more carefully to make sure that new immigrants are indeed succeeding—that is, on average, doing roughly as well as native Canadians after being in the country for a couple of decades.
To be more selective, it will be necessary to lower the global target for immigration substantially. We could begin by reducing the target to 100,000 immigrants per year. This target, a significant reduction from current levels, would make possible a marked increase in the labour mar-ket readiness of new arrivals. If the lower number of more qualified migrants produced the desired im-provement in the immigrants’ eco-nomic performance, then the new immigration target could be main-tained. If not, then it would have to be reduced further until the new immigrants were able to perform satisfactorily in the labour market.
Canadians, including existing immigrants, could expect to reap significant benefits from lower and more selective levels of immigration.
The resulting increase in immi-grants’ earnings would help stop the rise in relative poverty among immi-grants. This, in turn, would make it more likely that the new immigrants would make a net fiscal contribution to the country within a reasonable period of time and thus prevent the emergence of a large, net fiscal drain, which, if allowed to grow, would make it all the more difficult for the government to eliminate its current unsustainably large deficit and re-store its finances to a more healthy position (Grubel, 2005, provides preliminary estimates of the fiscal cost of recent immigration).
More generally, a tighter la-bour market would put upward pressure on the wages and incomes of all Canadians, including im-migrants, which, maybe not coin-cidently, have stagnated in recent years. However, true reform will not be easy to achieve, given the strong political pressure on all par-ties to maintain high immigration levels, regardless of the economic consequences.
References
Citizenship and Immigration Canada
(2007). Facts and Figures 2006:
Im-migration Overview: Permanent and Temporary Residents. Government of Canada. <http://tinyurl.com/ yc3ven8>.
Grady, Patrick (2005). What the
Im-migration Minister Should Have Known. Global Economics Ltd. <http://www.global-economics.ca/ immigrationstudies.htm>.
Grady, Patrick (2009). Immigration
Should Be Cut to Counter Soaring Unemployment. Global Economics Ltd. <http://www.global-economics. ca/immigration_rnu.htm>.
Grondin, Chantal (2005). Knowledge of
Official Languages among New Im-migrants: How Important Is It in the Labour Market? Catalogue No. 89-624-XWE. Statistics Canada.
Grubel, Herbert (2005). Immigration
and the Welfare State in Canada: Growing Conflicts, Constructive So-lutions. Public Policy Sources No. 84. Fraser Institute.
Hou, Feng, and Garnett Picot (2004). Visible Minority Neighbourhoods in Toronto, Montréal and
Vancou-ver. Canadian Social Trends 72:
8–13.
Picot, Garnett (2008). Immigrant
Eco-nomic and Social Outcomes in Canada: Research and Data Devel-opment at Statistics Canada. Cata-logue No. 11F0019M – No. 319. Sta-tistics Canada.
Picot, Garnett, and Arthur Sweetman
(2005). The Deteriorating Economic
Welfare of Immigrants and Possible Causes: Update 2005. Catalogue No. 11F0019MIE2005262. Statistics Canada.
Sarlo, Chris (2006). Poverty in Canada:
2006 Update. Fraser Institute.
Sarlo, Chris (2008). What is Poverty?
Providing Clarity for Canada. Fra-ser Institute.
Statistics Canada (2002). 2001
Cen-sus of Canada. Statistics Canada. <http://www12.statcan.ca/english/ census01/home/index.cfm>.
Statistics Canada (2008a). Canada’s
Changing Labour Force, 2006
Cen-sus. Catalogue No. 97-559-X.
Statis-tics Canada.
Statistics Canada (2008b). Earnings
and Incomes of Canadians over the Past Quarter Century, 2006 Census. Catalogue No. 97-563-X. Statistics Canada.
Erratum
In the November 2009 issue of Fraser Forum, we incorrectly identified