http://dx.doi.org/10.4236/cs.2016.76053
Critical Data Delivery Using TOPSIS in
Wireless Body Area Networks
K. Suriyakrishnaan, D. Sridharan
Department of ECE, College of Engineering, Anna University, Guindy Campus, Chennai, India
Received 16 March 2016; accepted 3 May 2016; published 6 May 2016
Copyright © 2016 by authors and Scientific Research Publishing Inc.
This work is licensed under the Creative Commons Attribution International License (CC BY).
http://creativecommons.org/licenses/by/4.0/
Abstract
Technology development in the Wireless Sensor Network (WSN) has paved the way for body area network for remote health monitoring. For this purpose, a message or a data packet should be transmitted from the patient to the medical evaluator without any loss. In this work, Technique for Order of Preference by Similarity to Ideal Solution (TOPSIS) algorithm is implemented for Wireless Body Area Networks (WBAN) to deliver the message, based on the criticality of the pa- tient. Finally, we compare the results for both the real-time data and the simulated (random) val-ues in terms of packet-size forwarding for different parameters such as Packet Delivery Ratio (PDR), Delay and Throughput. The result shows better performance in the real time value by using TOPSIS scheme in the WBAN. By improving the quality of service in body area networks, health monitoring system can be automated with good performance.
Keywords
E-Health, Packet Size, Reliability, TOPSIS, WBAN, WSN
1. Introduction
patient and do their medical needs to save the patient life. This will in turn benefit the patient in general hospital and day care.
1.1. Motivation
More chronic health diseases are associated with changing lifestyle behaviour due to the physical inactivity and poor dietary choices. The critical data from the patient’s body has to be transmitted in a reliable manner without affecting the actual observed body parameters to the medical evaluator [3] [4]. So, in this case, finding the criti-cal data is more important for selecting the patient with abnormalities to detect and diagnose the patient to save their life through e-health [5].
1.2. Contribution
This paper work addresses the reliable monitoring based allocation of time slots based on the emergency/criti- cality of the patient’s health data. The contribution of the paper is that the time critical health data should be found out by the decision making algorithm. Here we implement the TOPSIS [6] developed originally by Hwang and Yoon in 1981 for selecting the abnormal value and allocating slots in the controller node based on the urgency of the patient’s health information. According to it, time slot is allocated and the critical data is transmitted by the controller node through the base station (BS) to the receiver side (medical server). The infor-mation is obtained by the medical evaluator/doctor through the internet.
2. Related Works
Sudip misra etal. [3] proposed a Priority based Allocation of Time Slots (PATS) algorithm which considers the emergency health data to be transmitted to the LDPU based on the seriousness and urgency. However, the au-thor does not highlight the decision making algorithm for implementation. Lahby etal. [6] proposed a Multiple Analytic Hierarchy Process (M-AHP) which chooses the ideal solution but the author did not use the real time health data for the simulation for getting optimal solution.
In Body Area Networks (BAN), health parameters that are observed from the body are transmitted using wakeup radio concept [7]. Here the data packets are imparted by emergency communication. In our work, the critical health data are disseminated by selecting the abnormalities of the patient body health parameters. For this intent we implement the TOPSIS scheme for selecting the ideal solution.
During the transmission process the information or the data packets from the patient is disseminated by relay-ing method [8]. However the author does not enlighten the delay, throughput, packet size and normalized over-heads. Misra etal. [4] also proposed a data rate tuning mechanism to improve the quality of service in BAN. In Naganawa etal. [9], the path loss can be provoked by more number of body nodes which are placed in different postures of human body that are generated by time domain method and the performance is evaluated using two hop relaying scheme. So for any information in BAN, data should be highly reliable [10].
Medium Access Control (MAC) layer improvement is done by using fuzzy logic system, thereby achieving quality of service and better energy consumption in BAN by fuzzy logic system [10]. The topology and the BAN architecture for on body and in body communication is illustrated in MAC, PHY and Network layer [11],
[9] and ongoing research are highlighted [12]. A stochastic link cost formulation is developed in [13]. Ludoric et
al. [14] proposed a performance evaluation scheme for BAN with blocking effects using one bounce model for their evaluation.
So while designing the BAN, the obstacle size should be considered. Samanta etal. [15] proposed a quality link establishment for allocation with balancing load in BAN network. During the transmission of data packets, the delay factor should be considered for strict requirement of the reliable and efficient BAN. For this, changyen
etal. [16] proposed a compatible mechanism for medical data with emergency transmission in E-Health net-works.
3. Network Model and Architecture
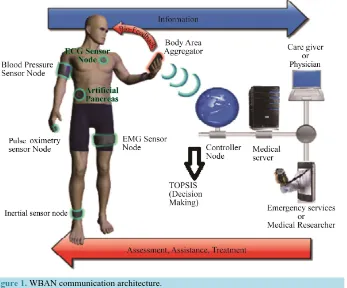
Figure 1.WBAN communication architecture.
3.1. System Model
In our proposed system there are several sensors mounted on a human body. For example, ECG, EEG, BP and EMG are placed in appropriate positions of the human body that continuously sense the information from the patient and transmit to the controller node. Here the body sensors are placed at the minimum distance required to avoid interference issue and these collected information is aggregated and sent to the controller node. The con-troller node will take the decision according to the patient’s critical situation based on the observed health pa-rameters. More number of data packets are arrived at the controller node and so collision problem may occur.
For that, Carrier Sense Multiple Access with Collision Avoidance (CSMA/CA) [17] is employed to provide Collison free transmission based on the emergency and detailed method for routing protocol is illustrated [1] [18] for packet forwarding. The controller node will take the decision based on the critical data packets of the pa-tient’s medical history and take decision based on the TOPSIS scheme and transferred to the medical server. From this server the patient information is shared to care giver or medical evaluator/ doctor for diagnosis through the internet and save the risk of the patient life.
3.2. Simulation Scenario
Here the biosensors such as ECG, EMG, BP and SPO2 sensors are placed on human body for observing the bio signals. Data aggregation is done by controller node. Wireless channel model of IEEE 802.15.6 has been con-sidered as channel model with initial energy of 100 J. The path loss for this channel is being concon-sidered from Two Ray Ground Propagation model. The transmission and receiving power are 0.02 J and 0.01 J respectively. Omni directional antenna has been chose for a network diameter of 30 m. The simulation is carried out using Network Simulator-2 (NS-2). Simulated results has been discussed in the following section.
4. Proposed System
In lowest level sensor communicates with controller node and which in turn connects with the medical server in the next level. In next higher level the server is connected with internet to forward the received data from con-troller node. In the same level the proxy server is connected with internet to accomplish the multihop communi-cation with controller nodes to form this architecture.
The server sends announcement message as periodical broadcast message to communicate with internet and internet node sends broadcast message as periodical message. Receiving controller nodes create the communica-tion with server via internet. Then controller nodes broadcast controller announcement message with its locacommunica-tion in wireless medium. Receiver nodes checks for nearest node by verifying location, distance and stores the near-est controller node id. All the sensor nodes maintain its local controller unit id to forward the sensed data.
Once the structure is formed, each sensor nodes performs sensing process, and forward the data to its local controller unit. The controller node collects the sensed data from all connected sensors and forward the emer-gency data to the server via internet. The algorithm for the proposed system is given below.
In our proposed system, the patient’s health information is collected through biosensors and then it is given as input to the TOPSIS algorithm. From this the evaluation matrix is formed followed by the normalization and calculation of the weight. Once the normalized weighted decision matrix is formed, thresholds for both upper and lower limit should be found out. From that calculate the target distance and find out whether the data is critical or not. If it is critical, forward the data immediately to the medical server. If it is not, discard the data packet.
5. Result and Discussion
In this work, the real value of TOPSIS is compared with simulated value. The real values used for the simulation is observed from patients in nearby hospital based on a survey conducted by us. Destination Sequenced Distance Vector (DSDV) routing protocol is employed in this simulation. By comparing simulated data with real time value, real time values will outperform in terms of PDR, Throughput, Delay, Jitter, Dropping ratio, and Packets dropped. The following graphs are plotted based on the critical data packet transmission from the patient to the medical evaluator.
Figure 2 shows a constant difference between TOPSIS simulated value and TOPSIS real value. With increase in packet size, the Packet Delivery Ratio (PDR) starts increasing initially and later decreases and TOPSIS real value achieves maximum (99%) reliability. PDR can be calculated by the ratio of the number of delivered data packet to the destination. This illustrates the level of delivered data to the destination. Comparatively TOPSIS real value has greater PDR than the TOPSIS value.
Figure 3 shows a constant difference between TOPSIS value and TOPSIS real value. With increase in packet size, the dropping ratio is slightly increasing. The dropping ratio can be measured by average number of packets dropped during the transmission. So comparatively TOPSIS real value has lesser dropping ratio when compared with the TOPSIS value.
Figure 2.Packet size vs PDR.
Figure 3. Packet size vs dropping ratio.
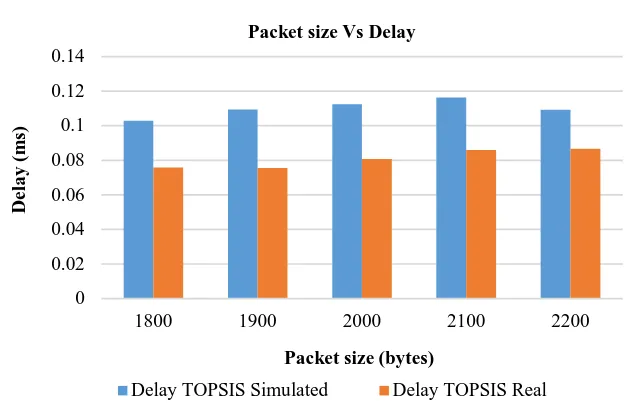
Figure 4.Packet size vs delay.
97 97.5 98 98.5 99 99.5 100
1800 1900 2000 2100 2200
P
DR (
%
)
Packet size (bytes) Packet size Vs PDR
PDR TOPSIS Simulated PDR TOPSIS Real
0 0.2 0.4 0.6 0.8 1 1.2 1.4 1.6 1.8 2
1800 1900 2000 2100 2200
D ro p p in g R a ti o ( % ) Packetsize (bytes)
Packet size Vs Dropping Ratio
Dropping Ratio TOPSIS Simulated Dropping Ratio TOPSIS Real
0 0.02 0.04 0.06 0.08 0.1 0.12 0.14
1800 1900 2000 2100 2200
D el a y ( m s)
Packet size (bytes) Packet size Vs Delay
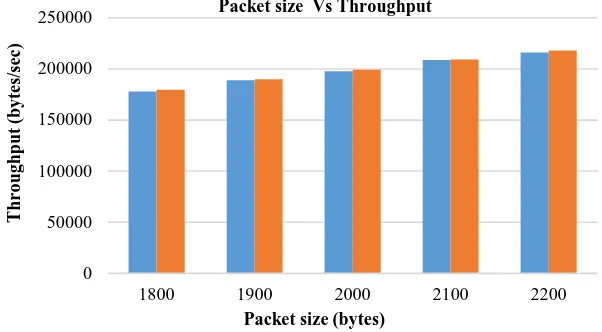
[image:5.595.156.474.502.706.2]Figure 5 shows that there is no difference between TOPSIS value and TOPSIS real value for throughput. With increase in packet size, the throughput is slightly increasing and achieves maximum level. Throughput is the amount of work that a node can do in a given time period. Typically, throughput has been a measure of the comparative effectiveness of dense network that run many tasks concurrently. So comparatively TOPSIS real value and the simulated value has same throughput values.
Figure 6 shows a constant difference between simulated value and TOPSIS real value. With increase in packet size, the packets dropped is slightly increasing and are less in real time value. The packets dropped is the ratio of packet loss with respect to the packet sent. So, TOPSIS real value has lesser packets dropped than the TOPSIS value.
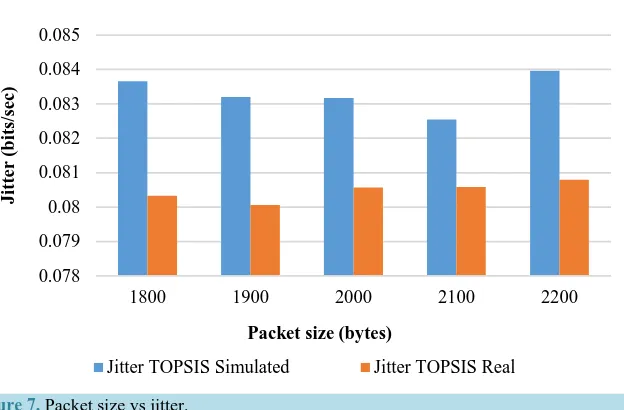
Figure 7 shows a constant difference between TOPSIS value and TOPSIS real value. With increase in packet size, the jitter is slightly increasing and later become constant for real value. The jitter period in a network is the interval between two times of maximum effect of a data characteristic that varies regularly with time at receiver end. So comparatively TOPSIS real value has lesser jitter than the TOPSIS value.
6. Conclusion
[image:6.595.163.464.322.488.2]In this paper, we proposed TOPSIS scheme implementation for the continuous monitoring for patients health in hospitals and day care. The critical data should be given preference during transmission in order to avoid casualty. This work utilizes the TOPSIS algorithm in finding the criticality of the data. The simulation is carried
[image:6.595.162.471.542.683.2]Figure 5.Packet size vs throughput.
Figure 6. Packet size vs packets dropped.
0 50000 100000 150000 200000 250000
1800 1900 2000 2100 2200
T
hr
o
ug
hput
(
by
te
s/
se
c)
Packet size (bytes) Packet size Vs Throughput
Throughput TOPSIS Simulated Throughput TOPSIS Real
0 10 20 30 40
1800 1900 2000 2100 2200
P
a
ck
et
s D
ro
p
p
ed
(
%
)
Packet size (bytes) Packet size Vs Packets Dropped
Figure 7.Packet size vs jitter.
out for the real time data observed from the hospital based on a survey observed by us and compared with ran-domly (simulated) generated data. The TOPSIS algorithm in wireless body area network performs well for transmitting the critical data packets from patients to the doctor/caregiver in terms of PDR, Delay, Dropping ra-tio, Packets dropped, Jitter and throughput. Finally the maximum amount of critical data packets (99% of PDR) is delivered from source to the destination, increasing the reliability of the algorithm in BAN.
Acknowledgements
We acknowledge the support provided under the Anna Centenary Research Fellowship (ACRF) scheme of Anna University, Chennai and the cooperation given by the patients of the surrounding locality.
References
[1] Sharavanan, P.T., Kumar, R. and Sridharan, D. (2015) A Comparative Study of Cross Layer Protocols in WBAN. Aus-tralian Journal of Basic and Applied Sciences, 9, 294-300.
[2] Lim, C.Y. and Kim, K. (2014) A Study on Healthcare System Using Smart Clothes. Journal of Electrical Engineering & Technology, 9, 372-377. http://dx.doi.org/10.5370/JEET.2014.9.1.372
[3] Misra, S. and Sarkar, S. (2015) Priority-Based Time-Slot Allocation in Wireless Body Area Networks during Medical Emergency Situations: An Evolutionary Game-Theoretic Perspective. IEEE Journal of Biomedical and Health Infor-matics, 19, 541-548. http://dx.doi.org/10.1109/jbhi.2014.2313374
[4] Misra, S., Moulik, S. and Chao, H.-C. (2015) A Cooperative Bargaining Solution for Priority-Based Data-Rate Tuning in a Wireless Body Area Network. IEEE Transactions on Wireless Communications, 14, 2769-2777.
[5] Kim, S.-K., Kim, T.-K. and Koh, J.-H. (2013) Energy Efficient Wireless Data Transmission for Personal Health De-vices. Journal of Electrical Engineering & Technology, 8, 1559-1570. http://dx.doi.org/10.5370/JEET.2013.8.5.1559
[6] Lahby, M., Cherkaoui, L. and Adib, A. (2013) Hybrid Network Selection Strategy by Using M-AHP/E-TOPSIS for Heterogeneous Networks. The 8th International Conference on Intelligent Systems: Theories and Applications (SITA), 8-9 May 2013, 1-6. http://dx.doi.org/10.1109/sita.2013.6560784
[7] Al Ameen, M. and Hong, C. (2015) An On-Demand Emergency Packet Transmission Scheme for Wireless Body Area Networks. Sensors, 15, 30584-30616. http://dx.doi.org/10.3390/s151229819
[8] Pan, R., Chua, D.J., Pathmasuntharam, J.S. and Xu, Y.P. (2015) An Opportunistic Relay Protocol with Dynamic Scheduling in Wireless Body Area Sensor Network. IEEE Sensors Journal, 15, 3743-3750.
[9] Suriyakrishnaan, K. and Sridharan, D. (2014) A Review of Reliable and Secure Communication in Wireless Body Area Networks. Proceedings of Thirteenth IRF International Conference, Chennai, 14 September 2014, 32-44.
[10] Otal, B., Alonso, L. and Verikoukis, C. (2009) Highly Reliable Energy-Saving Mac for Wireless Body Sensor Net-works in Healthcare Systems. IEEE Journal on Selected Areas in Communications, 27, 553-565.
0.078 0.079 0.08 0.081 0.082 0.083 0.084 0.085
1800 1900 2000 2100 2200
J
itte
r (b
its
/s
ec
)
Packet size (bytes) Packet size Vs Jitter
[11] Ullah, S., Higgins, H., Braem, B., Latre, B., Blondie, C., Merman, I., Saleem, S., Rahman, Z. and Kwak, K.S. (2012) A Comprehensive Survey of Wireless Body Area Networks. Journal of Medical Systems, 36, 1065-1094.
[12] Cao, H.S., Leung, V., Chow, C. and Chan, H. (2009) Enabling Technologies for Wireless Body Area Networks: A Survey and Outlook. IEEE Communications Magazine, 47, 84-93.
[13] Quwaider, M. and Biswas, S. (2010) DTN Routing in Body Sensor Networks with Dynamic Postural Partitioning. Journal of Ad Hoc Networks, 8, 824-841. http://dx.doi.org/10.1016/j.adhoc.2010.03.002
[14] Chevalier, L., Sahuguede, S. and Julien-Vergonjanne, A. (2015) Performance Evaluation of Wireless Optical Commu-nication for Mobile Body Area Network Scenario with Blocking Effects. Optoelectronics, IET, 9, 211-217.
[15] Samanta, A., Bera, S. and Misra, S. (2015) Link-Quality-Aware Resource Allocation with Load Balance in Wireless Body Area Networks. IEEE Systems Journal, PP, 1-8. http://dx.doi.org/10.1109/JSYST.2015.2458586
[16] Yi, C., Alfa, A.S. and Cai, J. (2015) An Incentive-Compatible Mechanism for Transmission Scheduling of Delay-Sen- sitive Medical Packets in E-Health Networks. IEEE Transactions on Mobile Computing, PP, 1-13.
http://dx.doi.org/10.1109/TMC.2015.2500241
[17] Chen, M., Gunzalez-Valenzuela, S., Vasilakos, A., Cao, H.S. and Leung, V.C.M. (2011) Body Area Networks: A Sur-vey. Journal of Mobile Networks and Applications—MONET, 16, 171-193.