Munich Personal RePEc Archive
Personal Income Tax Gap for Business
Income Earners In New York State:
From the Real Estate Tax Perspective
Niu, Yongzhi and Cohen, Roger
New York State Department of Taxation and Finance
2010
Online at
https://mpra.ub.uni-muenchen.de/26437/
Personal Income Tax Gap for Business Income Earners
In New York State: From the Real Estate Tax Perspective
1Yongzhi Niu, Ph.D.
New York State Division of the Budget
Roger Cohen, Ph.D.
New Jersey Division of the Treasury
Abstract
Based on the recognition that the evasion of real estate tax is much more difficult than the evasion of personal income tax and the assumption that, in general, taxpayers with similar income would consume a similar amount of housing and pay a similar amount of real estate tax, we build a model to estimate the personal income tax gap for business income earners in New York State. More specifically, we compare reported Federal adjusted gross income (AGI) between two groups of taxpayers: wage earners and business income earners. With the assumption that the wage income earners fully report their income, we find that there is a huge reporting gap of AGI for the business income earners in New York State as a whole. The income gap is $67.8 billion in 2007, which accounts for 26.2 percent of the total AGI the business income earners would have reported if they had been totally compliant with tax laws. If we apply the median of the New York State personal income tax rate, 5.25 percent, to the income gap, the personal income tax gap for the business income earners in the State in 2007 reaches $3.6 billion.
1. Introduction
A tax gap is the difference between the total tax actually collected by tax authorities and the total tax liabilities of the taxpayers. The tax liabilities are the amount that would have been collected if all taxpayers had paid the required amount of tax according to the law. The total tax gap may
1
be divided into subgroups according to the tax type: business tax gap, sales tax gap, personal income tax (PIT) gap, etc., with the personal income tax gap being the largest.
Total tax gap can also be divided into three subgroups according to the source of the gap: Non-filing, underreporting, and underpayment. Non-filing occurs when taxpayers who were required to file tax returns either did not file them or did not file them on time. Underreporting occurs when taxpayers filed tax returns on time but reported less tax liabilities than they should have as required by law, due to either understating their income or overstating their deductions,
exemptions, or credits. Underpayment occurs when taxpayers reported the correct amount of tax liabilities but failed to pay the tax due on time for various reasons, such as forgetting to enclose a check or not having the money to pay.
There have been only several prominent studies on the tax gap in the literature. At the federal level, the tax gap estimations were done by Internal Revenue Service (IRS). According to research by IRS (Bloomquist, 2007), for 2001 the total federal tax gap was $345 billion, about 16.3 percent of total tax liabilities. Of the $345 billion gap, $27 billion was from non-filing and $33 billion from underpayment. The most significant part of the tax gap was underreporting. It accounted for $285 billion or 83 percent of the total tax gap. Of the $285 billion of
underreporting, $197 billion, or 69 percent, was from the personal income tax.
Although the IRS started to estimate tax gaps long ago, it never published any detailed
methodology behind its estimations. Currently the IRS is consulting with a group of experts in the Information Reporting Program Advisory Committee (IRPAC) to help it improve its tax gap estimations.
In this study, we focus specifically on the personal income tax gap caused by taxpayers who underreport their business income. Business income is self reported and often lacks third party reporting that validates wage income. Employers as well as employees report wage information to the IRS and State taxing authorities. Knowing that unreported wages can be identified by tax agents improves compliance for this income category. The absence of such third party
verification for business income may embolden some taxpayers to underreport income from those sources. According to the IRS, in 2001 the underreported business income gap is $109 billion, which is about 55percent of the total individual income tax gap (Bloomquist, 2007). A treasury official once testified that “individuals operating cash-based businesses report only 19
percent of their income.” (George, 2006) Our study uses a different methodology and New York
State taxpayer data between the years 2005 to 2007 to estimate the magnitude of under reported business income.
The methodology used in this study is different from that used in the literature cited. In previous studies, researchers compare third-party sampling data (Census data, for example) with tax return data and treat the difference between the two as the tax gap with the implicit assumption that the third-party sampling data reveals a true picture of people’s activities without distortion. In this study, we apply real estate tax data taken directly from the Federal returns instead of the third party sampling data to compare income reported by business income earners to income reported by wage income earners and treat the difference of the two groups as the tax gap. We know from previous studies that tax gap exists for both wage earners and business income earners.
Therefore, the tax gap resulting from this study should be regarded as a relative gap (relative to wage earners) for business income earners, or regarded as the lower limit of the tax gap for the business income earners. Once a reliable estimation of the tax gap for the wage earners is developed, the absolute tax gap for business income earners will be easy to reach.
The remainder of this paper consists of three sections. Section 2 discusses data used in this research. Section 3 presents the research methodology, estimation procedures, and estimation results. Section 4 finishes the paper with a summary and conclusions.
2. Data
estate tax as reported on schedule A, Itemized Deductions, of Form 1040, is extracted from the second database which contains Federal individual tax return data for New York State taxpayers.
3. Methodology and Estimation Results
A. Assumptions
We make three assumptions in this study: (1) taxpayers with similar income from the same income source would consume a similar amount of housing, and, therefore, pay a similar amount of real estate tax; (2) taxpayers with similar income would consume a similar amount of housing regardless of the income sources; and (3) wage earners (without business income) report their income fully. Reasoning behind each assumption is explained below.
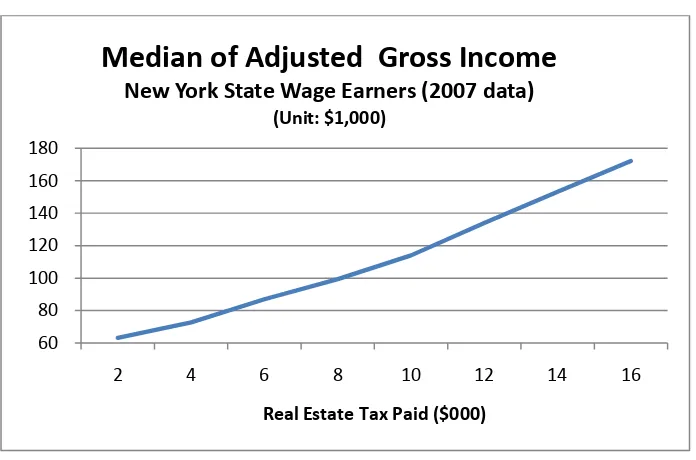
The first assumption is that taxpayers with similar income from the same income source would consume a similar amount of housing, and, therefore, pay a similar amount of real estate tax. It is true that if we investigate taxpayers at the individual level, this assumption may seem too strong, since we may see a particular taxpayer with very high income living in a moderate house or a taxpayer with limited income living in an expensive house. Also, it is possible for two individual taxpayers with similar incomes to consume very different levels of housing because of their individual preferences. To further complicate the issue, many people regard housing not only as a consumption decision, but also as an investment decision. All of these factors seem contradictive to our assumption. However, this study is not about taxpayers at the individual level, but at an aggregate level. At the aggregate level, the assumption that taxpayers with similar income would consume a similar amount of housing is valid. This can be observed from the practice of the mortgage market. Most homebuyers borrow money from mortgage lenders and the maximum amount a borrower can borrow is closely tied to the amount of the income he can earn. Although the lending procedures may be different for different lenders, the maximum amount a homebuyer can borrow is similar, which puts a constraint on the amount a taxpayer can consume on housing.
Figure 1:
The second assumption in this study is that taxpayers with similar income would consume a similar amount of housing regardless of the income sources, i.e., it doesn’t matter if the income is wage income, business income, or other income.
People may argue that a typical business income earner consumes more housing than a typical wage earner with similar income because business income earners can, other things being equal, tolerate more risk than wage earners, which is the reason why business income earners go into business in the first place. Because they can tolerate more risk, they would buy bigger houses than wage income earners. Furthermore, if the housing choice is regarded not only as a
consumption decision but also as an investment decision, then a typical business income earner would buy a bigger, more expansive house than a typical wage earner with similar income because of potential returns from the housing investment. On the other hand, people may argue that a typical business income earner may consume less housing than a typical wage earner with similar income because business income is involved with more risk factors than wage income and, therefore, is more volatile. In reality, more than 95 percent of new businesses close within 5 years of start up. For this reason, if they have the same tolerance level toward risk, a typical business income earner would buy a smaller house than a typical wage earner with similar income.
The net effect of these two opposing forces is not clear. Here, we will assume that there is zero-sum effect of the two forces. If it is true that business income earners conzero-sume more housing than wage earners with similar income, our study would overestimate the personal income tax gap for business income earners. On the other hand, if it is the case that business income earners
60 80 100 120 140 160 180
2 4 6 8 10 12 14 16
Real Estate Tax Paid ($000)
Median of Adjusted Gross Income
New York State Wage Earners (2007 data)
consume less housing than wage earners with similar income, then our study would underestimate the tax gap for business income earners.
The third assumption underlying our study is that wage earners (without business income) report their income fully. Wage earners’ income is defined to include both wage income and other components of AGI, such as income from interest, dividends and capital gains. While it is difficult for an employee to underreport wage income because of the strict wage reporting regulations, underreporting of wages does occur. According to the IRS, wage reporting was $10 billion in 2001, about one percent of total wages (Bloomquist, 2007). Furthermore, wage earners have the same opportunity as business income earners to underreport other components of AGI, such as capital gains. Therefore, the assumption of the full-reporting of income by wage earners is far from the reality. For this reason, the tax gap resulting from this study should be regarded as the tax gap for business income earners RELATIVE to that for wage earners, or the lower limit of the tax gap for business income earners.
B. Taxpayer Classification
To make the estimation possible, the personal income taxpayers are classified into different groups. There are five steps for the data extract and taxpayer classification. First, individual taxpayer information is extracted from the data sets mentioned in the Data Section, including the
taxpayer’s ID, wages, business income, real estate tax, and Federal adjusted gross income (AGI). The tax information was reported in the State personal income tax returns, which is based on the figures reported on the taxpayers, Federal individual tax Form 1040 and Schedule A.
Information included on the short forms of Federal tax returns, Forms 1040A and 1040EZ, is not used because taxpayers using these forms do not report business income. Using Federal
individual income tax Form 1040 and Schedule A for 2007 as an example, wage income is defined as wages, salaries, and tips, etc. as reported on Line 7 of Form 1040. Business income is defined as the sum of Line 12, business income or loss, and Line 17, rental real estate, royalties, partnerships, S corporations, trusts, etc. AGI is from Line 37 of Form 1040, and real estate tax is from Line 6 of Schedule A.
In the third step, the first two groups identified in the second step, business income earners and wage earners, are each split into two subgroups. One subgroup of taxpayers uses standard deductions and the other uses itemized deductions on their federal tax returns.
In the fourth step, the taxpayers with itemized deductions in each of the two groups, wage
earners and business income earners, are further split into two sets. One set consists of taxpayers who reported real estate tax on Line 6 of Schedule A, Form 1040. The other set consists of taxpayers who did not report real estate tax on that line.
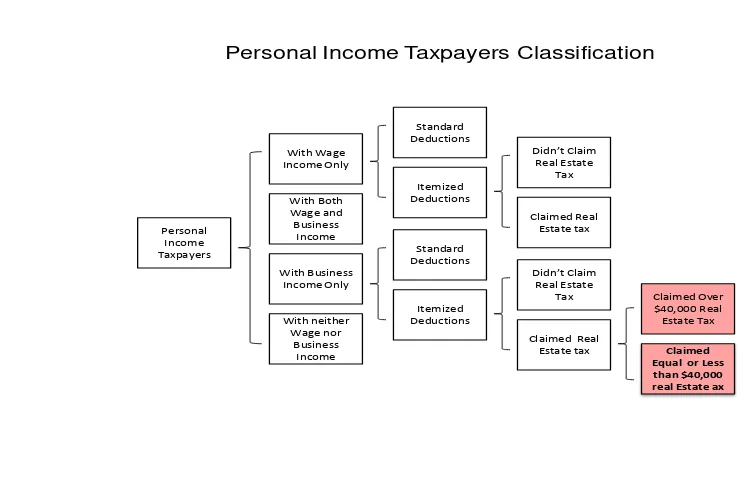
[image:8.612.73.447.334.575.2]In the final step, the business income earners who reported real estate tax are split into two subsets: one subset consists of taxpayers who claimed real estate tax equal or less than $40,000 and the other subset consists of taxpayers who claimed more than $40,000. We make this split because we will apply different estimation methods to these two subsets, which will be explained in detail later. Figure 2 is a summary of the taxpayer classification described above.
Figure 2: With Both Wage and Business Income With neither Wage nor Business Income Personal Income Taxpayers Itemized Deductions Standard Deductions Claimed Real Estate tax Didn’t Claim Real Estate Tax With Business Income Only With Wage Income Only
Personal Income Taxpayers Classification
Itemized Deductions Standard Deductions Claimed Real Estate tax Didn’t Claim Real Estate Tax Claimed Equal or Less than $40,000 real Estate ax
Claimed Over $40,000 Real Estate Tax
The taxpayers in the shadowed boxes have the following characteristics in common: they had either wage income or business income, but not both; they applied itemized deductions on their federal individual income tax returns; and they claimed real estate tax deductions.
C. Tax Gap for Business Income Earners who Claimed Real Estate Tax Deductions
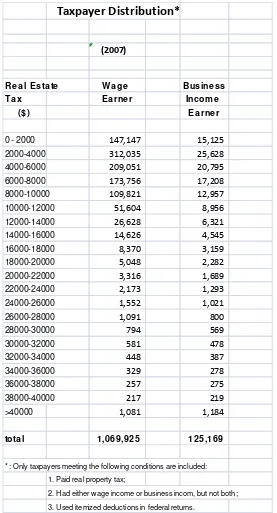
Table 1:
Next, we estimate the tax gap for the business income earners who paid real estate tax less than or equal to $40,000 (the first 20 brackets in Table 1) by comparing them with wage earners within the same brackets. As mentioned earlier, the wage earners will serve as the control group and they are assumed to report their income lawfully and correctly while the business income earners will serve as the experiment group. The difference between these two groups will be regarded as the tax gap.
Taxpayer Distribution*
(2007)
R e a l E sta te W a ge Busine ss T a x E a rne r Income ($) E a rne r 0 - 2000 147,147 15,125 2000-4000 312,035 25,628 4000-6000 209,051 20,795 6000-8000 173,756 17,208 8000-10000 109,821 12,957 10000-12000 51,604 8,956 12000-14000 26,628 6,321 14000-16000 14,626 4,545 16000-18000 8,370 3,159 18000-20000 5,048 2,282 20000-22000 3,316 1,689 22000-24000 2,173 1,293 24000-26000 1,552 1,021 26000-28000 1,091 800
28000-30000 794 569
30000-32000 581 478
32000-34000 448 387
34000-36000 329 278
36000-38000 257 275
38000-40000 217 219
>40000 1,081 1,184
tota l 1,069,925 125,169
* : Only taxpayers meeting the following conditions are included: 1. Paid real property tax;
The median of adjusted gross income for each bracket is calculated separately for each group. The median instead of the mean is used here because for our purpose the median is more representative than the mean. Median of AGI is used to avoid possible skewed (not normally distributed) data which may distort the real picture of AGI. For example, if just one taxpayer with very high income is added to a particular bracket, then the mean may increase substantially, making the system unstable. Adding this taxpayer to a bracket will have little effect on the median. As in the case of the housing market, government agencies and realtors’ associations often use median instead of mean to represent the price of the real estate market.
At this point we have two groups of taxpayers, wage earners and business income earners. Each group was classified into 21 brackets according to the level of real estate tax; and for each bracket, we have a median of AGI for the taxpayers in that bracket. As mentioned earlier, we have an assumption that taxpayers with similar income would consume a similar amount of housing and pay a similar amount of real estate tax regardless of the income type. This assumption, in turn, means that within each bracket, the median of AIG should be roughly the same for wage earners and for business income earners. If there is a significant difference between the medians of the two groups in a bracket, it should be regarded as the income gap resulted from underreporting by a typical business income earner, where income gap is defined as the difference between the income which should have been reported by the law and the income which was actually reported.
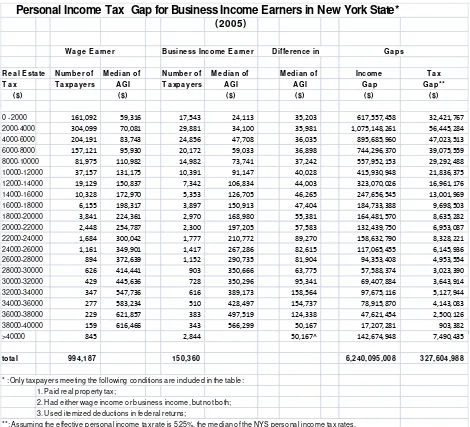
Table 2:
Personal Income Tax Gap for Business Income Earners in New York State* (2005)
W a ge E a rne r Busine ss Income E a rne r D iffe re nce in Ga ps
R e a l E sta te N umbe r of Me dia n of N umbe r of Me dia n of Me dia n of Income T a x T a x T a xpa ye rs AGI T a xpa ye rs AGI AGI Ga p Ga p**
($) ($) ($) ($) ($) ($)
0 - 2000 161,092 59,316 17,543 24,113 35,203 617,557,458 32,421,767
2000-4000 304,099 70,081 29,881 34,100 35,981 1,075,148,261 56,445,284
4000-6000 204,191 83,743 24,856 47,708 36,035 895,685,960 47,023,513
6000-8000 157,121 95,930 20,172 59,033 36,898 744,296,370 39,075,559
8000-10000 81,975 110,982 14,982 73,741 37,242 557,952,153 29,292,488
10000-12000 37,157 131,175 10,391 91,147 40,028 415,930,948 21,836,375
12000-14000 19,129 150,837 7,342 106,834 44,003 323,070,026 16,961,176
14000-16000 10,328 172,970 5,353 126,705 46,265 247,656,545 13,001,969
16000-18000 6,155 198,317 3,897 150,913 47,404 184,733,388 9,698,503
18000-20000 3,841 224,361 2,970 168,980 55,381 164,481,570 8,635,282
20000-22000 2,448 254,787 2,300 197,205 57,583 132,439,750 6,953,087
22000-24000 1,684 300,042 1,777 210,772 89,270 158,632,790 8,328,221
24000-26000 1,161 349,901 1,417 267,286 82,615 117,065,455 6,145,936
26000-28000 894 372,639 1,152 290,735 81,904 94,353,408 4,953,554
28000-30000 626 414,441 903 350,666 63,775 57,588,374 3,023,390
30000-32000 429 445,636 728 350,296 95,341 69,407,884 3,643,914
32000-34000 347 547,736 616 389,173 158,564 97,675,116 5,127,944
34000-36000 277 583,234 510 428,497 154,737 78,915,870 4,143,083
36000-38000 229 621,857 383 497,519 124,338 47,621,454 2,500,126
38000-40000 159 616,466 343 566,299 50,167 17,207,281 903,382
>40000 845 2,844 50,167^ 142,674,948 7,490,435
tota l 994,187 150,360 6,240,095,008 327,604,988
* : Only taxpayers meeting the following conditions are included in the table: 1. Paid real property tax;
2. Had either wage income or business income, but not both; 3. Used itemized deductions in federal returns;
**: Assuming the effective personal income tax rate is 5.25%, the median of the NYS personal income tax rates.
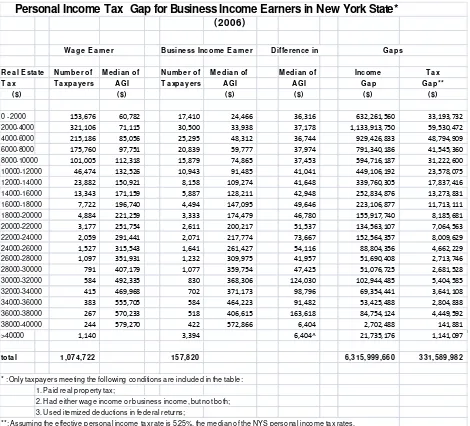
Table 3:
Personal Income Tax Gap for Business Income Earners in New York State* (2006)
W a ge E a rne r Busine ss Income E a rne r D iffe re nce in Ga ps
R e a l E sta te N umbe r of Me dia n of N umbe r of Me dia n of Me dia n of Income T a x T a x T a xpa ye rs AGI T a xpa ye rs AGI AGI Ga p Ga p**
($) ($) ($) ($) ($) ($)
0 - 2000 153,676 60,782 17,410 24,466 36,316 632,261,560 33,193,732
2000-4000 321,106 71,115 30,500 33,938 37,178 1,133,913,750 59,530,472
4000-6000 215,186 85,056 25,295 48,312 36,744 929,426,833 48,794,909
6000-8000 175,760 97,751 20,839 59,777 37,974 791,340,186 41,545,360
8000-10000 101,005 112,318 15,879 74,865 37,453 594,716,187 31,222,600
10000-12000 46,474 132,526 10,943 91,485 41,041 449,106,192 23,578,075
12000-14000 23,882 150,921 8,158 109,274 41,648 339,760,305 17,837,416
14000-16000 13,343 171,159 5,887 128,211 42,948 252,834,876 13,273,831
16000-18000 7,722 196,740 4,494 147,095 49,646 223,106,877 11,713,111
18000-20000 4,884 221,259 3,333 174,479 46,780 155,917,740 8,185,681
20000-22000 3,177 251,754 2,611 200,217 51,537 134,563,107 7,064,563
22000-24000 2,059 291,441 2,071 217,774 73,667 152,564,357 8,009,629
24000-26000 1,527 315,543 1,641 261,427 54,116 88,804,356 4,662,229
26000-28000 1,097 351,931 1,232 309,975 41,957 51,690,408 2,713,746
28000-30000 791 407,179 1,077 359,754 47,425 51,076,725 2,681,528
30000-32000 584 492,335 830 368,306 124,030 102,944,485 5,404,585
32000-34000 415 469,968 702 371,173 98,796 69,354,441 3,641,108
34000-36000 383 555,705 584 464,223 91,482 53,425,488 2,804,838
36000-38000 267 570,233 518 406,615 163,618 84,754,124 4,449,592
38000-40000 244 579,270 422 572,866 6,404 2,702,488 141,881
>40000 1,140 3,394 6,404^ 21,735,176 1,141,097
tota l 1,074,722 157,820 6,315,999,660 331,589,982
* : Only taxpayers meeting the following conditions are included in the table: 1. Paid real property tax;
2. Had either wage income or business income, but not both; 3. Used itemized deductions in federal returns;
**: Assuming the effective personal income tax rate is 5.25%, the median of the NYS personal income tax rates.
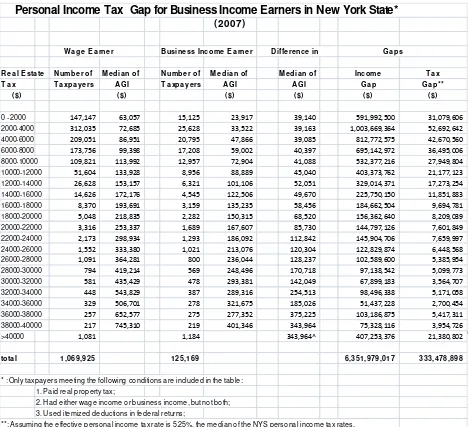
Table 4:
In Tables 2, 3, and 4, the income gap and tax gap for taxpayers who paid more than $40,000 in real estate tax were estimated differently from those who paid equal or less than $40,000. For these taxpayers, the income gap and tax gap was estimated by applying the AGI medians in the $38,000 to $40,000 bracket. For example, in Table 2, we used $50,167 as the difference in the medians for the last bracket, same as that of the $38,000 to $40,000 bracket. The reason for this is that for the taxpayers with more than $40,000 real estate tax, the span of the real estate tax is very wide and the skewed data for taxpayers in this bracket makes it unreliable to estimate the tax gap with the same methodology used for the brackets with less than $40,000 of real estate tax. If we estimate the tax gap for this bracket using the same methodology as that for other
Personal Income Tax Gap for Business Income Earners in New York State* (2007)
W a ge E a rne r Busine ss Income E a rne r D iffe re nce in Ga ps
R e a l E sta te N umbe r of Me dia n of N umbe r of Me dia n of Me dia n of Income T a x T a x T a xpa ye rs AGI T a xpa ye rs AGI AGI Ga p Ga p**
($) ($) ($) ($) ($) ($)
0 - 2000 147,147 63,057 15,125 23,917 39,140 591,992,500 31,079,606
2000-4000 312,035 72,685 25,628 33,522 39,163 1,003,669,364 52,692,642
4000-6000 209,051 86,951 20,795 47,866 39,085 812,772,575 42,670,560
6000-8000 173,756 99,398 17,208 59,002 40,397 695,142,972 36,495,006
8000-10000 109,821 113,992 12,957 72,904 41,088 532,377,216 27,949,804
10000-12000 51,604 133,928 8,956 88,889 45,040 403,373,762 21,177,123
12000-14000 26,628 153,157 6,321 101,106 52,051 329,014,371 17,273,254
14000-16000 14,626 172,176 4,545 122,506 49,670 225,750,150 11,851,883
16000-18000 8,370 193,691 3,159 135,235 58,456 184,662,504 9,694,781
18000-20000 5,048 218,835 2,282 150,315 68,520 156,362,640 8,209,039
20000-22000 3,316 253,337 1,689 167,607 85,730 144,797,126 7,601,849
22000-24000 2,173 298,934 1,293 186,092 112,842 145,904,706 7,659,997
24000-26000 1,552 333,380 1,021 213,076 120,304 122,829,874 6,448,568
26000-28000 1,091 364,281 800 236,044 128,237 102,589,600 5,385,954
28000-30000 794 419,214 569 248,496 170,718 97,138,542 5,099,773
30000-32000 581 435,429 478 293,381 142,049 67,899,183 3,564,707
32000-34000 448 543,829 387 289,316 254,513 98,496,338 5,171,058
34000-36000 329 506,701 278 321,675 185,026 51,437,228 2,700,454
36000-38000 257 652,577 275 277,352 375,225 103,186,875 5,417,311
38000-40000 217 745,310 219 401,346 343,964 75,328,116 3,954,726
>40000 1,081 1,184 343,964^ 407,253,376 21,380,802
tota l 1,069,925 125,169 6,351,979,017 333,478,898
* : Only taxpayers meeting the following conditions are included in the table: 1. Paid real property tax;
2. Had either wage income or business income, but not both; 3. Used itemized deductions in federal returns;
**: Assuming the effective personal income tax rate is 5.25%, the median of the NYS personal income tax rates.
brackets, the tax gap for this bracket would be negative for both 2005 and 2006 and extremely huge for 2007.
The grand total of the income gap and grand total of the tax gap are the sum of the gaps of the 21 brackets. Tables 2, 3, and 4 show some degree of consistency over time. As the real estate tax increases from lower brackets to higher brackets, the number of taxpayers would decrease, with a few exceptions. Each year, the tax gap is more than $300 million for this group of business income earners. The bracket containing the largest number of both wage earners and business income earners is the second bracket, in which taxpayers’ real estate tax is between $2000 and $4000. Also, in absolute terms, the business income earners in this bracket contributed over $50 million to the tax gap each year, more than 15 percent of the total.
Although the estimation shows some degree of consistency over time, we should be cautious about making any vertical comparison between different years because in these tables, a taxpayer is not fixed within one bracket. For example, if a taxpayer paid $1,800 real estate tax in 2005 and $2,050 in 2006, he would move from the first bracket to the second bracket; If a taxpayer sold a house at the end of 2005 and never bought a house afterwards, his case would be included in the 2005 table, but not in the 2006 and 2007 tables. In addition, any economic situation changes over time may push the median of AIG in each bracket up or down.
D. Tax Gap for All Business Income Earners
It should be noted that above analysis is about the personal income tax gap for a group of business income earners who meet the following conditions:
1. They had business income but not wage income;
2. They used itemized deductions in their Federal individual tax returns;
3. They claimed a real estate tax deduction in their Federal individual tax returns.
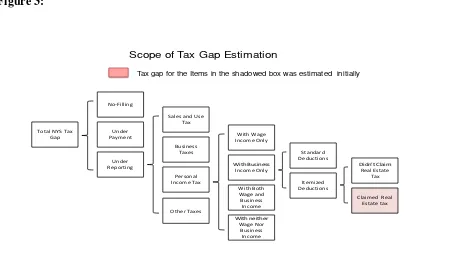
Figure 3:
Total NYS Tax Gap No-Filling Under Payment Under Reporting With Both Wage and Business Income With neither Wage Nor Business Income Sales and Use
Tax
Business Taxes
Personal
Income Tax Itemized Deductions
Standard Deductions
Claimed Real Estate tax Didn’t Claim Real Estate Tax With Business Income Only With Wage Income Only Other Taxes
Scope of Tax Gap Estimation
Tax gap for the Items in the shadowed box was estimated initially
Next, starting with the results from the above analysis (shadowed box in Figure 3), we are going to use the 2007 data, the most recent data available, to estimate the tax gap resulting from underreporting by business income earners as a whole. To make this estimation possible, we make the following assumptions and premises:
1. On average, the business income earners who did not claim real estate tax in their itemized deductions have the same underreporting rate as those who claimed real estate tax;
2. Business income earners who took standard deductions have the same underreporting rate as those who made itemized deductions;
3. For taxpayers with both wage income and business income, their AGI splits into two parts: One part is associated with wage income and the other part with business income. The split is accomplished by using two ratios: the ratio of business income to AGI for the business income group (taxpayers with business income but without wage income) and the ratio of wage income to AGI for the wage income group (taxpayers with wage income but without business income). For details on the split, see Appendix I;
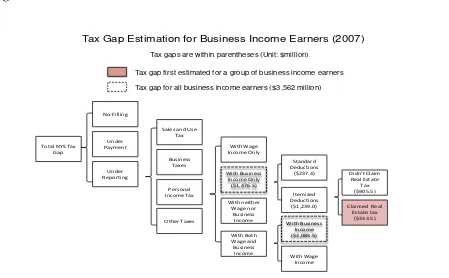
With these assumptions and premises, we are able to calculate the tax gaps for all business income earners. The results are presented in Figure 4, with the level of tax gaps enclosed by parenthesis.
Figure 4:
Total NYS Tax Gap No-Filling Under Payment Under Reporting With Both Wage and Business Income With neither Wage nor Business Income Sales and Use
Tax
Business Taxes
Personal
Income Tax Itemized Deductions
($1,239.0) Standard Deductions
($237.4)
Claimed Real Estate tax ($333.5) Didn’t Claim Real Estate Tax ($905.5) With Business Income Only ($1,476.5) With Wage Income Only Other Taxes
Tax Gap Estimation for Business Income Earners (2007)
Tax gap first estimated for a group of business income earners
With Business Income ($2,085.5)
With Wage Income
Tax gap for all business income earners ($3,562 million) Tax gaps are within parentheses (Unit: $million)
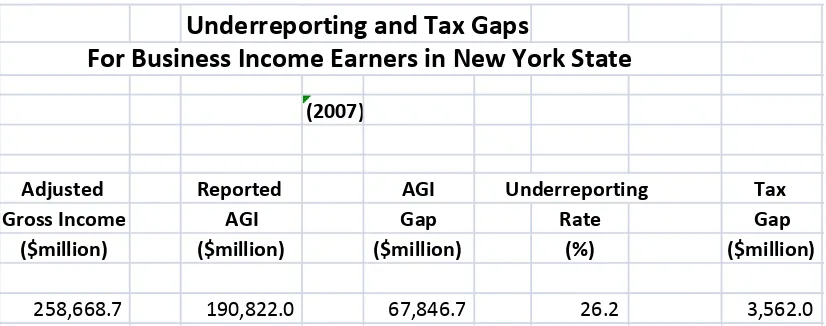
Table 5:
Table 5 shows the underreporting rate of AGI is 26.2 percent, which seems lower than the IRS estimation. For example, according to IRS (Bloomquist, 2007), the underreporting rate of business income for 2001 is 43 percent. The low underreporting rate in this study arises due to two factors. First, the measurement in this research is not the same as that of the IRS estimation. The IRS research analyzes the “pure business income,” which includes only three items: (1) non-farm proprietor income, (2) farm income, and (3) income from partnership, S-corp, rents and royalties, estate and trust, etc. In this study we analyze a much broader definition of income reported by business income earners, adjusted gross income, which includes not only the “pure business income,” but also other components of adjusted gross income from the Federal individual income tax returns, such as interest, dividends, and capital gains. The lower underreporting rate for most of these components makes the underreporting rate in our study lower.
The second factor has something to do with our assumption that wage earners do not underreport their income, which we know is not true. Therefore, we should not regard the underreporting rate in this research as an absolute term, but as a relative term, relative to wage earners. If we or other researchers can find a reliable estimate of the underreporting rate for wage earners in the future, then it would be easy to translate the results of this study into an absolute term.
4. Summary and Conclusions
Based on the recognition that the evasion of the real estate tax is much more difficult than the evasion of the personal income tax and the assumption that, in general, taxpayers with similar income would consume a similar amount of housing and pay a similar amount of real estate tax, we build a model to estimate the personal income tax gap for business income earners relative to wage income earners in New York State.
Underreporting and Tax Gaps
For Business Income Earners in New York State
(2007)
Adjusted Reported AGI Underreporting Tax
Gross Income AGI Gap Rate Gap
($million) ($million) ($million) (%) ($million)
258,668.7
It is found that there is a huge reporting gap for adjusted gross income for the business income earners as a whole. For example, in 2007 the income gap is $67.8 billion, which accounts for 26.2 percent of the total AGI the business income earners would have reported if they are totally compliant with tax laws. If we use the median of the New York State personal income tax rate, 5.25 percent, to apply to the income gap, the tax gap for these taxpayers in 2007 is $3.6 billion.
How to close this tax gap is a huge challenge facing policy-makers, researchers, and State tax authorities, especially at this time when the State budget is facing serious challenges. One reason for the huge gap is the imperfection of the monitoring mechanism for business income. However, the cost to improve the mechanism may be high and the political consequences for doing so cannot be foreseen and may be serious. Nevertheless, given the current situation that there are huge deficits in the nation and large budget gaps in many states, it may be the right time to take on the challenge to close the tax gap.
Appendix I.
There are three steps used to split AGI into business-income-related AGI and wage-income-related AGI:
1. To calculate the ratio of business income to AGI for the business income group
(taxpayers with business income but without wage income), Rbus, and the ratio of wage
income to AGI for the wage income group (taxpayers with wage income but without business income), Rwage:
Rbus = BIbus / AGIbus;
Rwage = WIwage / AGIwage;
where:
BI = Business income; WI = Wage income;
wage = Taxpayers with wage income but without business income; bus = Taxpayers with business income but without wage income.
2. To split AGI of the taxpayers with both business income and wage income, AGIboth, into
two parts, AGIb and AGIw, using the two ratios obtained from Step 1. AGIb is supposed
to be the part of AGI associated with business income and AGIw to be the part of AGI
associated with wage income for these taxpayers. We have:
AGIw = WIboth /Rwage;
AGIp = AGIb +AGIw,
Where AGIp , the sum of AGIb and AGIw, can be viewed as the preliminary AGI after the
initial distribution of the AGI for the taxpayers with both business income and wage income. Ideally, AGIp should equal to AGIboth if the relationship between AIG and
business income or wage income is the same among different groups of taxpayers. In our case, we found that AGIp equals to 96.7 percent of AGIboth, i.e., we have distributed 96.7
percent of AGIboth, leaving part of it undistributed. Then we have to proceed to Step 3 to
adjust it.
3. To do a final adjustment. First we find the adjustment factor, A.
A = AGIboth / AGIp ;
Then we apply the adjustment factor A to AGIb and AGIw obtained in Step 2 to get he
final AGI associated with the business income and that associated with the wage income.
AGIb,f = AGIb * A;
AGIw ,f = AGIw * A;
where the subscript f refers to the AGI distribution after the adjustment. It is clear that the sum of AGIw,f and AGI b,f equals to AGIboth. Then AGI b,f will be used to calculate
the underreporting of AGI for the taxpayers with both business income and wage income.
References
Bloomquist, Kim M. 2007. IRS Compliance Research and Tax Gap Estimates, 2007 FTA Revenue Estimation and Tax Research Conference, September 17, 2007
http://www.taxadmin.org/fta/meet/07rev_est/papers/Bloomquist.pdf
Minnesota Department of Revenue. 2004. Individual Income Tax Gap Tax Year 1999
http://www.taxes.state.mn.us/legal_policy/other_supporting_content/tax_gap_study.pdf
OTPA (2005) Office of Tax Policy Analysis, NYS Department of Taxation & Finance, New York State Personal Income Tax Compliance Baseline Study Tax Year 2002, FTA Conference on Revenue Estimation and Tax Research, Oklahoma City, Oklahoma, October 2005