1652
STUDY ON VISUAL INSPECTION MECHANISM AND
DYNAMIC MODELING OF COAL BUNKER
1QIAO TIE-ZHU, 1*CHEN XIN, 1MA FU-CHANG, 2WANG FENG 1
Assoc. Prof., Education Ministry Key Lab of Advanced Transducers and Intelligent Control System, Taiyuan University of Technology, Taiyuan City 030024, China
2
Department Science and Technology Information Engineering,Taiyuan University of Technology, Taiyuan City 030024, China
E-mail: [email protected],[email protected]
ABSTRACT
In order to analyze theory and method of coal level detection by intelligent camera, firstly, mathematic model of coal level detection in bunker was established by three-dimensional imaging and synthesis and decomposition of vision signal, which is based on Faugerast’s calibration method, and the variation law between image signal and coal level variation in bunker were obtained by theory analysis. Secondly, the experimental simulation system for coal level detection in variation induced by the variation of image signal was constructed, and the image signal variation law was revealed. The numerical simulation model of the coal level detection in vision display was established, the simulation show that the greater the peak and contour points of coal level are, the faster the variation of image signal is, and the greater the initial value of coal level is, the higher the image signal is, and the coal level may have lightly pit. Finally, the image reconstruction shows that the theoretical analysis, experimental research and numerical results are consistent.
Keywords: 3D Image- Forming Principle,The Coal Level Detection In Vision,Image Display,Image Reconstruction
1. INTRODUCTION
Video action analysis earns its great interest from many potential applications. In video mining area, there have been recently a number of systems developed to extract meaningful semantics from image and video contents. Those we can see the demonstration in the video Google [1], and the landmark structure is in Chum [2], and landmark three-dimension reconstruction is in Snavely [3].
In this paper, we present a framework for matching actions in video, which can be used as a core module for development of a complete visual-based action analysis engine. A typical coal level action can be decomposed into two main stage, feature extraction and learning. Generally, the literature on feature extractions can be grouped into two main approaches, one detail with global features for the coal edge of interest [4]-[6], while the other works on sparse set of local feature, significant results have been obtained in these works. In this work, we approach video action analysis using improved Faugerast’s calibration
1653 The remaining of this paper will be as followed, in Section 2; we give the theory of coal level detection from vision sensor. Mathematic model of coal level detection is established in section 3. Section 4 will integrate those action model elements into a dynamic structure. At the end of section 4, Experimental results are presented; follow which concluding remarks are given in section 5. By analyzing experimental results on different types of actions, we can then draw some useful conclusion about the improved algorithm and their potential field of application.
2. THE THEORY OF COAL LEVEL DETECTION
The imaging model of vision sensor is a mathematical description of the physical process that is the projection from space scene to 2d imaging plane. According to the imaging forming principle, in figure 1, the point P in the Cartesian space of vision sensor and corresponding
imaging point P inner parameters
corresponding relations as follows:
= = 1 1 1 0 0 0 0 1 1 1 1 1 1 1 1 1 0 0 z y z x M z y z x k k in y x n µ n µ (1)
The corresponding relation between parameters is: = = 1 1 1 0 1 ω ω ω ω ω ω ω z y x M z y x p R z y x c c c (2)
It is hypothesis scenery that the points in the world coordinate system are known, following the laws of reflection, we have:
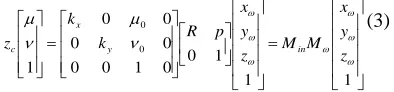
= = 1 1 1 0 0 1 0 0 0 0 0 0 1 0 0 ω ω ω ω ω ω ω n µ n µ z y x M M z y x p R k k
z y in
x
c
(3)
Here Min denote the internal parameter matrix that is decided by the sensors itself optical and geometrical properties and describe the relation between scene points and image points.
is the scenery coordinate in camera
coordinate system, is the scenery
coordinate in world coordinate system, R and p constitute external parameters of sensor that is the , which describe the positional relation between sensor coordinate system and the three-dimensional
coordinate system.
[image:2.612.100.297.552.598.2]The image sensor in this paper we used three are used to self-calibration by holes imaging principle. In the calculation of the sensor internal and external parameters, at the same time, we can calculate space position information of coal level in coal bunker.
Fig. 1 Pin-Hole Imaging
3. THE MATHEMATIC MODEL AND ANALYSIS OF COAL LEVEL
The improved mathematical model using three visual probes and three visual probes in the same space can make adaptive control from each other, and establish three-dimensional coordinate system circled in O as well, which is the center of a circle in coal bunker bottom, combining with two-dimensional system based on the holes imaging principle. Respectively, calibration
visual sensors position
is , , . To coal pile
vertex P as an example, the sensor to the point P have distance for radius, three round intersection position is the point P, as the equation (4) shows:
(
) (
) (
)
(
) (
) (
)
(
) (
) (
)
= − + − + − = − + − + − = − + − + − 2 2 3 2 3 2 3 2 2 2 2 2 2 2 2 2 1 2 1 2 1 r a z a y a x r a z a y a x r a z a y a x (4)In the coal level changing process, visual probe’s position is fixed, in order to simplify the conversion formula’ s derive, we make the following hypothesis about coal bunker:
(1). Coal bunker bottom as the standard circle, ignore wall irregular form of coal bunker to make visual probe in the standard coordinate system.
(2). It is the hypothesis that image edge profile is clear. In the image processing, we use Laplace algorithm to make the influence of the image burr reduce to minimum.
1654
Fig. 2 The geometric relation of three intersections
(5)
(6)
In the image collected process, we calculate the value of K and R and change pixel coordinate system into the actual coordinate system by virtual instrument, thus, we can obtain the specific value of the vertex P in actual two-dimensional coordinate, . Then substituting three visual sensors coordinate values to get the actual value of vertex P in the Z axis.
4. EXPERIMENTAL RESULT
4.1 Experimental Project
In order to effectively eliminate the blind spot area a sensor caused and improve the accuracy of three-dimensional data simulation, as shown in figure 3, the distance between every two visual
sensors are And also in the same horizontal plane.
[image:3.612.91.299.211.338.2]
Fig. 3 The Installation Method Of The Three Intelligent Cameras
In the simulation experiments, in order to observe
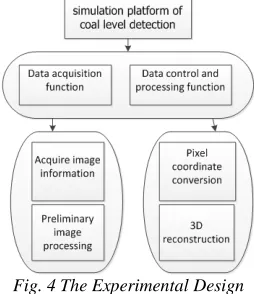
the actual situation in the coal bunker at the real-time and analysis specific change of the coal level value accurately, we select 4 profile measuring point and 1vertex point from a large number of fixed points, located in the coal pile contour line and the vertices. A simulation experiment platform scheme is shown in figure 4:
Fig. 4 The Experimental Design
4.2 The Experimental Results and Analysis
(a) 1th measuring point
(b) 2th measuring point
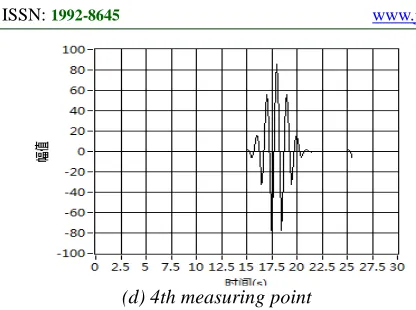
[image:3.612.332.505.370.717.2]1655 (d) 4th measuring point
Fig. 5 The Curve Graph Of Amplitude Change
Now we select four key positions of the measuring points as an example for details, as is shown in figure 5:
(1). Figure 5(a) indicated that no. 1 measuring point is far from the coal entry. Because the 1 point is far away from the coal entry so that the rate of spread continuously attenuation and coal level have a low change amplitude.
(2). No.2 and no.3 monitoring points are closed to the coal entry. The rate of spread is bigger than no.1 point so that have a higher change amplitude and highest can amount to 6~10cm.
(3).We detected no.4 point display a pulse waveform, this is because the coal level value far from the coal entry increase slowly in the storage process. However, propagation velocity is not decay at the coal entry point so that the changing of coal level has a sharp increase. Therefore, no.4 measuring point produced a similar pulse waveform.
(4). Because of different change amplitude and the rate of coal level change is not uniformity, between no.1 and no.2 points and no.2 and no.3 points appeared different degree of sag area.
5. NUMERICAL-CALCULATION RESULTS OF COAL POSITION DETECTION
Fig. 6 3D Artificial Hologram
In order to simulate coal level changing process in coal bunker effectively, according to initial status data, the simulation of physical model can divide into three areas named smooth area, sag area, prominent area. The initial condition is as follows:
For visual sensor, H=143.53cm, R=276.34cm. H is the installation height of visual sensor. R is a horizontal distance between visual sensor and simulation coal bunker.
[image:4.612.313.551.338.595.2]This paper use the improved coal level measurement algorithm, according to the experimental result, we found the change of coal level are not uniformity. Therefore, we selected 9 key points from a large number of measuring data in three divided area, as is shown in table 1, and reconstruction three dimension image by the application of virtual instrument’s three-dimension simulation platform.
Table 1 The Value Of Sampling Points
Fig. 7 The Tendency Chart Of Value Change
By contrast with table 1, figure 6 and figure 7, we can be conclude that the value of no.1 to no.4 points didn’t change, the value of no.5 to no.6 and no.7 to no.8 points increased slowly, however, no.8 to no.9 have a sharp increase. It described the coal level increasing trend of whole coal bunker from outside to inside, and described the changing process of coal level accurately. The vertex of the coal pile is fastest than others, each outer contour line is along with the increase of radius in turn. But because the slope between
X(pixel) Y(pixel) Real height measurement error
[image:4.612.313.553.342.469.2]1656 no.5 to no.6 and no.7 to no.8 are obviously different, no.6 to no.7 have a sunken place. The inhomogeneity decline of material in coal bunker lead to the numerical calculation increased in-consistency caused the different slope between the measuring points. And contrast with the three-dimensional simulation show that a specific height calculation and prediction is consistent, and the method is simple and accurate to ensure a real-time monitoring.
6. CONCLUSION
(1) Through the theoretical analysis to establish a new type of coal detection mathematical model, we can conclude specific position information and the changing trend of the rate of coal level and the quality of calculation data is small so that a real-time detection is possible.
(2) According to deeply analysis of the image signal, we found the bigger the coal pile vertex and contour point of the initial amplitude is, the greater the image of the initial waveform amplitude is and the higher the coal pile vertex and contour points change amplitude is, the bigger the pulse waveform amplitude of the image is.
(3) Given the initial condition in the numerical calculation, the numerical results also show that the bigger the coal pile vertex and contour point change amplitude value is, the greater the slope the display and the steep the image waveform is, the higher the initial amplitude and vertex and contour point of the height are.
REFRENCES:
[1] Kim,J. W., Jung,K. H. & Hyun, C. C. (2005), A study on an efficient sign recognition algorithm for a ubiquitous traffic system on DSP ,Computational science and Its Applications-ICCSA 2005, 3480(1) ,1177-86.
[2] Poppe, Ronald. (2010). a survey on
vision-based human action recognition,
IMAGE AND VISION COMPUTING:
28,976-990.
[3] Hartley, R. &Zisserman, A. (2000), Multi-View Geometry in Computer Vision, Cambridge University Press, Cambridge. ICCV' 05 (2005),
ICCV2005 Computer Vision Contest, Beijing. [4] Wu, J. P. & Tsai, Y. (2006), Enhanced roadway
inventory using a 2-D sign video image recognition algorithm, Computer-Aided Civil and infrastructure Engineering, 21, 369-82. [5] Zhu, S. D., Zhang, Y. & Lu, X. F. (2006),
Detection for triangle traffic sign based on neural network, in Proceedings of the Advances in Neural Network-ISNN 2006, Pt 3, 3973, 40–45.
[6] Luo PF, Chao YJ, Sutton MA. Application of stereo vision to 3-D deformation analysis in fracture experiments. Opt Eng 1994; 33(3):981-90.
[7] Luo PF, Chao YJ, Sutton MA, Peters WH. Accurate measurement of three-dimensional deformations in deformable and rigid bodies using computer vision. Exp Mech 1993; 33(2):123-32.
[8] Faugeras OD. Three-dimensional computer vision: a geometric viewpoint. Cambridge, MA: MIT Press; 1993
[9] HE Cheng, WANG Yao-nan. Machine vision detection and recognition of quality of filling liquid medicine, Journal of Central South University of Technology, 2009(4):30-34. [10] Helm JD, McNeill SR, Sutton MA. Improve
3-Dimage correlation for surface displacement measurement. Opt ENG 1996; 35(7):1911-20.
[11] Helm JD, Sutton MA, McNeill SR.
Deformations in wide, center-notched, thin panels: part I: three dimensional shape and deformation measurements by computer vision. Opt Eng 2003; 42(5):1293-305.
[12] Helm JD, Sutton MA, McNeill SR.
Deformations in wide, center-notched, thin panels: part II: finite element analysis and comparison to experimental measurements, Opt Eng 2003; 42(5):1306-20
[13] Schreier HW, Garcia D, Sutton MA. Advances in light microscope stereo vision, Exp Mech 2004; 44(3):278-88.
[14] Sutton MA, Ke X, Lessner SM, Goldbach M, Yost M, Zhao F, Schreier HW, and Strain filed measurements on mouse carotid arteries using microscopic three-dimensional digital image correlation. J Biomed Mater Res a 2008; 84; 178-90.
[15] Sutton MA, Helm JD, Boone ML.
1657 [16] Yan J-H, Sutton MA, Deng X, Cheng C-S.
Mixed mode fracture of ductile thin sheet materials under combined in-plane and out-of-plane loading.Int J Fract 2007; 144(4):297-321.