Software Process and Quality
Digital Technical Journal
Digital Equipment Corporation
Cover Design
The honeycomb structure bas long inspired mathematicians and architects. On our cover, the honeycomb represents the structured disci pline and dynamic development that are char acteristic of software processes as described in this issue. Overlaid on the honeycomb is a stepped line representing the five levels of pro cess maturity. These levels are defined by the Software Engineering Institute, a federally funded organization, and are discussed in the paper by Davies and Dumont.
The cover was designed by Susanna B. Ries of Digital's UNIX Software Publications Group.
Editorial
Jane C Blake, Managing Editor Kathleen M. Stetson, Editor Helen L Patterson, Editor
Circulation
Catherine M. Phillips, Administrator Dorothea B. Cassady, Secretary Production
Terri AULieri, Production Editor Anne S. Katzeff, Typographer Peter R. Woodbury, Illustrator Advisory Board
Samuel H. Fuller, Chairman Richard W Beane
Donald Z. Harbert Richard J Hollingsworth Alan G. Nemeth Jeffrey H. Rudy Stan Smits Michael C Thurk Gayn B. Winters
The Digital Technical journal is a refereed journal pub I ished quarterly by Digital Equipment Corporation, 30 Porter Road LJ02/D 10, Littleton, Massachusetts 01460. Subscriptions to the journal are $40.00 (non-U.S. $60) for four issues and $75.00 (non U.S. $115) for eight issues and must be prepaid in US funds. University and college professors and Ph.D. students in the electrical engineering and compmer science fields receive complimentary subscriptions upon request. Orders, inquiries, and address changes should be sent to the Digital Technical journal at the pub! ished-by address Inquiries can also be sent electronically to 01J@CRLDEC . C OM. Single copies and back issues are available for S 16.00 each by calling DECdirect at 1-800-DICITAL (1-800-344-4825). Recent back issues of the journal are also available on the Internt:t at gatekeeper.dec.com in the directory /pub/DEC /DECinfo/DTJ.
Digital employees may order subscriptions through Readers Choice by entering vrx PROFILE at the system prompt
Comments on the content of any paper are welcomed and may be sent to the managing editor at the published-by or network address.
Copyright© 1993 Digital Equipment Corporation. Copying without fee is permitted provided that such copies are made for use in education;ol institutions by faculty mem bers and are not distributed for commercial advantage. Abstracting with credit of Digital Equipment Corporation's authorship is permitted All rights reserved. The information in the journal is subject to change without notice and should not be construed as a commitment by Digiral Equipment Corporation. Digital Equipment Corporation assumes no responsibility for any errors that may appear in the jour-nal.
ISSN 0898-901X
Documentation Number EY-F920E-DP
The following are trademarks of Digital Equipment Corporation: ACMS, ALL-IN-I, Alpha AXP, AXP, DEC MAIL works, DEC TP WORKcenter, Digital, the DIGITAL logo, OpenVMS, POLYCENTER, TeamLinks, TeamRoute, VAX, VAX RALLY, and VMS. Apple, Mac, and Macintosh are regi>tcrcd trademarks of Apple Computer, Inc. Motif is a registered trademark of Open Software Foundation, Inc.
Post-it is a registered trademark of 3M Company.
PostScript is a registered trademark of Adobe Systems Incorporated. QFD/CAPTURE is a trademark of International Tech neG roup Incorporated. SPECmark is a registered trademark of the Standard Performance Evaluation Cooperative.
Windows is a trademark of Microsoft Corporation.
I
Contents
6 Foreword
Anthony F Hutchings
9 Modeling the Cost of Software Quality Stephen T. Knox
18 Changing the Rules: A Pragmatic Approach to Product Development
Paul K. Huntwork, Douglas W Muzzey, Christine M . Pietras, and Dennis R. Wixon
Software Process and Quality
36 Defining Global Requirements with Distributed QFD John A. Hrones, Jr., Benjamin C. Jedrey, Jr. , and Driss Zaaf
47 DEC TP WORK center: A Software Process Case Study Ernesto Guerrieri and Bruce]. Taylor
59 SEI-based Process Impravemettt Efforts at Digital Neil L. M . Davies and Margaret M . Dumont
I
Editor's Introduction
Jane C. Blake Managing Editor
j (
Digital is continually seeking to adopt, improve, or devise processes that will deliver the highest qual ity products to our customers. In this issue of the Digital Technical journal, software engineers from several of Digital's organizations present their expe riences with modern software process methods, such as Voice of the Customer techniques and the Software Engineering Institute's (SEI) framework, that direct the development focus on the needs of customers.
One of the first hurdles for software process advocates is making a clear case for the value of implementing software product development pro cesses. Steve Knox's paper offers a Software Cost of Quality Model that addresses the cost and schedule concerns of many software managers. The model demonstrates that among the incentives for improv ing software process is a two-thirds decrease i n the cost of quality, as a percentage of development, as process maturity grows.
Digital's software processes are still in the early stages of maturity as defined by the SEI (described in a later paper). Nevertheless, software engineers who are using process techniques are already see ing significant benefits in the form of products that meet customer needs. Paul Huntwork, Doug Muzzey, Chris Pietras, and Dennis Wixon describe the techniques they used to gather customer requirements for the TeamLinks for Macintosh groupware application. TeamLinks designers uti li zed Contextual Inquiry and art ifact walk throughs, and a Vector Comparative Analysis tool to quantify the data obtained . The authors review the key requirements-and surprises-u ncovered and the impact these had on design.
Quality Function Deployment is another process for obtaining an accurate, prioritized set of customer requirements, specifically through well-planned,
2
structured meetings. John Hrones, Ben Jedrey, and Driss Zaaf present an enhanced approach to QFDs, i.e., a D istributed QFD for gathering customer requirements from around the globe. They refer ence a Digital-internal QFD conducted by Corporate Telecommunications Software Engineering.
The motto of the team that built DEC TP WORKcenter was "Use the process, but don't let the process use you." The team was in fact able to successfu l ly adapt several processes-Contextual Inquiry, QFD, conceptual modeling, and rapid prototyping-to serve quality and schedule goals. Ernesto Guerrieri and Bruce Taylor analyze the effectiveness of these and other design-ph;u;e pro cesses vis-a-vis the WORKcenter project and make recommendations for their general application in future software projects.
Many of the software methods described in this issue originated at the Software Engineering Institute, a federally funded organization which pro motes software process infrastructure to achieve productivity and quality. Meg Du mont and Neil Davies provide a brief overview of the five levels of the SEI's Capability Maturity Model and discuss two case stud ies of their organizations' experiences with the CMM. Included are their evaluations of the challenges presented by the model and future direc tions for Digital's process-improvement efforts.
In the papers above, engineers stress the impor tance of learning customer requirements as early as possible in the project. For engineers porting the OpenVMS operating system to the Alpha AXP plat form, customer requirements/expectations for this mature and complex system were wel l known. As Robert Thomson explains, ensuring that these expectations were met for the AXP product and at the same time meeting the aggressive Alpha AXP program schedule would require a new quality assessment process. Robert describes how subjec tive data, obtained by means of a questionnaire for developers, can be used to assess the qual ity of a software release.
Biographies
NeilL. M. Davies Neil Davies is the Open VMS qual i ty manager and is respon sible for creating metrics, goals, and programs to achieve engineering excellence in the Open VMS organization. In this role, Neil works with Digital's engineering management to introduce the techniques established by the Software Engineering Institute. Neil is also involved with the task force aimed at defining metrics for cycle time, applied time, and product quality and reducing the cost to qual ify new systems. Prior to joining Digital in 1992, Neil was the software quality manager for all of Hewlett-Packard's computer systems.
Margaret M. Dumont Meg Dumont is the engineering manager for process development in the UNIX Software Group (USG). She helped organize a Software Engineering Institu te Assessment of USG and created and staffed a process improvement group that is focused on the recom mendations from the assess ment. Meg is involved with the future direction and ongoing improvements within the quality function. Prior to this work, she created a standards engineer ing function within USG and was responsible for standards compliance in the DEC OSF/ 1 AXP operating system Vl.O to V 1 .2. Meg joined Digital in 1980.
Ernesto Guerrieri Ernesto Guerrieri, a senior software engineer in the Produc tion Systems Group, is the DEC TP WORKcenter project leader. He is an adjunct professor at Boston University Prior to joining Digital in 1 990, he was employed by SofTech, Inc, where he was the chief designer and developer of reusable Ada products for information systems development (RAPID) center l ibrary He holds a Ph.D. in software engineering from Rensselaer Polytechnic Institute and an M.S. CS. from the University of Pisa. Ernesto has published various papers in soft ware engineering. He is a member of ACM, IEEE Computer Society, and Sigma Xi.
John A. Hrones,Jr. As a consultant in the Software Engineering Technology Center (SETC), John Hrones works with cl ients to develop and implement TQM programs and is program manager for the Corporate Formal Inspection effort and for Six Sigma for Software . John joined Digital in 1 973. He led software devel opment efforts in MUMPS, BLISS, DSR, and OPS5 and originated the ELF facility and the Software Tools Clearinghouse. He managed the Corporate Forms, Base Graphics, and Engineering Quality Technology groups before joining SETC John received a B.S. from MIT and an M.S. from the University of Michigan.
I
Biographies
4
Paul K. Huntwork Paul Huntwork is a consultant engineer in D igital's Software Engineering Technology Center, an organization that collaborates with development groups to adapt or invent world-class methods for use in their product development activities. He joined Digital in 1987 after leading reengi neering projects in software development, verification, manufacturing, and dis tribution at Comp utervision. Paul also led proto-SEI process assessment and maturation drives at Control Data Corporation, using techniques drawn from IBM's Federal Systems Division.
Benjamin C. jedrey, Jr. Ben jedrey i s an information systems consu ltant within Corporate Telecommunication Software Engineering. He has program/ project management responsibil ities for developing telecommunications soft ware and hardware solutions. He also manages next-generation routing-bridge fil tering and network cost-reduction projects. Since joining Digital in 1966, Ben has contributed to information systems and programming and system development, and has provided support for financial applications at the corporate and field oper ations levels. Ben was previously employed by the brokerage firm Estabrook & Co.
Stephen T. Knox Steve Knox is a principal software engineer with the Software Engineering Technology Center. Current ly, he is assigned to the Networked Systems Management organization to improve software and develop ment processes. Steve came to Digital in 1989 from Tektronix, Inc . , to further develop the Contextual Inquiry process. A Quality Engineer certified by the American Society of Quality Control, Steve received the 1991 High Performance Systems Technical Leader Award . He holds an M .S. (1986) in psychology from Portland State University.
Douglas W. Muzzey Doug Muzzey is a software engineering manager in Workgroup Systems. He is the development m anager for the TeamLinks for Macintosh and TeamRoute workflow products, and he sponsored the usability and customer partnering for the Team Links product family. In prior work, Doug contributed to communications and systems products and managed programs in Software Manufacturing, License Management, and Corporate Programs. Doug joined Digital in 1979. He holds a B.S. CS. ( 1978) from Florida Technological University and an M.B.A. (1991) from Rivier College.
Bruce J. Taylor A principal software engineer, Bruce Taylor is the software architect of the DEC TP WORKcenter project. Prior to joining Digital in 1991, Bruce worked in CASE tool development at lntermetrics, Inc. He designed the repository database for the SLCSE software development environment and has published many papers on the use of database technology in the software devel opment environment. He has a B.A. in English and an M.A. in computer science f rom Duke University. His current research interests include repository support for complete software life-cycle environments and software qual ity strategies.
Robert G. Thomson A senior software engineer in the Open VMS AXP Group, Robert leads the validation of Volume Shadowing's port to the Alpha AXP plat form. During the OpenVMS port, he measured quality and contributed to func tional verification, for which he was co-recipient of an Alpha AXP Achievement Award. Since joining Digital in 1986, Robert has also contributed to improvements in system availability measurement and in symmetric multiprocessing and Backup performance. He has a patent pending and two published papers based on this work. Robert holds an M.S. in computer engineering from Boston University.
Dennis R. Wixon Dennis Wixon has worked in the area of user interface design for 20 years. He helped design the VT200 series keyboards and the DECwindows, Motif, and most recent windows interfaces. Currently a principal engineer in the Usability Expertise Center User, Dennis manages the Contextual Inquiry Program and conducts user needs analysis training. Before coming to Digital in 1981, he designed and programmed statistical analysis tools at Clark University. Dennis holds B.A., M.A., and Ph.D. degrees in psychology and has pub lished more than 25 papers in psychology, statistics, and interface design.
Driss Zaaf Principal engineer Driss Zaaf of Corporate Telecommunications is a project leader for several network applications and products. In earlier work, he led software projects in the Publishing Technologies Group in Galway, where be helped develop a distributed l ibrary system. Before joining Digital in 1985, be was employed by CPT Corporation and Bull Groupe. Driss received an M.S.
(1980) in science f rom the Faculty of Science, Rabat University, Morocco, and a Degree in Telecommunications Engineering (1983) from the Ecole Nationale Superieure des Telecommunications de Paris, France.
I
I
Foreword
Tony F. Hutchings
Technical Director of Software Process and the Software Engineering
Technology Center
In the early 1980s, when the semiconductor and microprocessor industry was still relatively young, a few wise people recognized that the distinguish
ing factor for the winners in the race would be pro cess, i.e . , base technology, design methods, and CAD tools. They were right. Great processes are among the key reasons why Intel is today "top of the p ile" and why our Alpha AXP chips achieve exceptionally
high performance.
The formula works as follows: Bri l l iant, innova tive people plus outstanding process produce con sistently great results, repeatedly. This is in fact true of all product development efforts and is also there fore the case with software in the 1990s. We have thus devoted an entire issue of the Digital Technical journal to software process and quality.
The most popular and effective models and methods for quality and process improvement hold several characteristics in common:
• All pu t the customer first, including knowing when customers and their requirements are being satisfied and when we and they are achieving desired results in the marketplace.
• All have a basis in applied measurement, using data from the appl ication of the processes to help determine what changes to make.
• Al l are closed loop; that is, there is a clear path for feeding back observations to improve the current state of the process.
6
We are increasingly being asked: What is Digital's overall vision for software quality and process improvement? From a completely mature organiza tion, the answer to that question would be some thing like the following: Every project sets its own clearly measurable, customer-driven quality goals; pu ts appropriate learning and improvement prac tices in p lace; continually monitors its progress toward its goals; and makes adjustments to process as needed to ensure it meets its goa ls. Fine words, but in reality we are not yet at that state in our cor porate life. We have, however, developed a process improvement strategy, or vision, which we hope will encourage all projects and groups to move toward the kind of state described above. That vision is best il lustrated by the following diagram .
We imagine this vision would map to an imple mentation model as follows:
I
DEFINE PRODUCTS THROUGH "VOICE OF THE CUSTOMER" PROCESSES
\
DEFINE
ORGANIZATION'S GOALS
�
DEFINE METRICS FOR THESE GOALS
�
PERFORM SEI ASSESSMENT�
DEVELOP PROCESS IMPROVEMENT PLAN
�
EXECUTE IMPROVEMENT PLAN ON PROJECTS
company; basing our process application on assess ing our current levels of performance and therefore the opportunities for introducing new "best prac tices" to overcome our weaknesses; and continu ously using quantitative and qualitative analysis to determine how we might achieve better and better results. Our Voice of the Customer concept embraces such powerful techniques as Contextual Inqu iry (for understanding customers' work and what might delight them in the future) and Quality Function Deployment (for rigorously prioritizing customers' requirements and how to satisfy them with world-class product concepts). Our applica tion of the Software Engineering Institute's (SEI) approach to improving processes relies on per forming organization-wide assessments of process capability and on developing long-lasting improve ment plans, drawing on the rich pool of best prac tices described in their Capability Maturity Model. Our notion of Continuous Improvements rests on empowering engineering teams to study the resu lts of their work with measurable data, analyzing the root causes of any process problems, and systemati cally implementing improvements to their pro cesses such that they achieve better results.
The relationship between these concepts is sub tle yet vital: Al l our process work needs to be cus tomer-driven, and yet these Voice of the Customer techniques themselves need to be open to improve ment as we learn from real data coming from their application; the advice in the SEI's Capabi lity Maturity Model is sound and we need to choose judiciously the most appropriate best practices according to the state of maturity of each organiza tion; nevertheless, as these practices are applied, we need to learn what is working and what is not and adjust their definition and application accord ingly; these practices should also be chosen, at all times, to maximize the benefit for our customers as well as for ourselves.
None of the three mutually reinforcing elements of the composite strategy is sufficient individually to drive the massive and sustainable changes we want to see in software engineering process at Digital. The SEI's Capability Maturity Model frame work alone under-emphasizes the extraordinarily important and powerful Voice of the Customer and Market; the Voice of the Customer and Market alone provides insufficient structure on which to hang an entire process improvement strategy; Continuous Improvement alone, as likely to be practiced at Digital, is at a level of intervention too low to move entire organizations sufficiently quickly toward
I
orders of magnitude improvement in productivity and quality.How are others in the industry tackling the prob lem of improving their quality and productivity' Many of the techniques and processes which we are now mastering or planning to are also in use by other leaders in our industry. For instance, Voice of the Customer processes (as typified by Quality Function Deployment) are in regu lar use at Hewlett-Packard; Formal Inspection (called Peer Reviews by the SEI) is practiced at Hewlett-Packard, IBM, and a host of other industry leaders; the use in software metrics is commonplace at Hewlett Packard and Motorola; Continuous Improvement teams abound at Motorola, IBM, etc.
We have made great strides in the past two years in the application of better and more modern qual ity processes in Digital's software engineering com munity. No longer is the notion of using Voice of the Customer techniques really contested; few doubt the cost-effectiveness of Formal Inspections as a defect-detection technique; there is a ground swel l o f support for the SEI's organizational assessment model and a belief that its associated Capability Maturity Model offers a rich source of really good advice on the steps to take to improve one's pro cess capability; and so on. We are even beginning to compile case studies from within Digital that demonstrate the positive impact of these pro cesses, techniques, and concepts on project quality and schedu le. Of course, we need many more such experiences before we can say that we are tru ly "best in class" in t hese areas.
Readers may well ask how the various papers i n this issue relate to the strategy described here. Different aspects of the application of our Voice of the Customer techniques are emphasized in two papers: Contextual Inquiry and Rapid Prototyping are discussed in the paper "Changing the Rules: A Pragmatic Approach to Product Development"; an approach to using Quality Function Deployment across different geographies is covered in "Defining Global Requirements with Distributed QFD."
Examples of how we are applying the SEJ's assess ment and Capability Maturity Model approaches are covered in "SEI-based Process Improvement Efforts at Digital." Another form of quality assess ment is shown in the paper "Assessing the Quality of OpenVMS AXP: Software Measurement Using Subjective Dat a"; the business case for implement ing SEI-like programs is covered in the paper "Modeling the Cost of Software Quality." Finally, in the paper "DEC TP WORKcenter: A Software
Forewo rd
Process Case Study," many of these separate con cepts are shown in practice: the use of a require ments analysis process, of defects metrics, and of overall continuous improvement.
Digital's software engineering processes are improving quite quickly and radically. To be com pletely successful will require a high degree of commitment and significant effort by management and engineers alike. The opportunity is, however, clearly there.
Modeling the Cost of
Software Quality
Stephen T. Knox I
This paper offers an extrapolation of tbe manufacturing and service industries' Cost of Quality Model to tbe business of software development. Tbe intent is to pro vide a tbeoretical account of the cbanging quality cost structure as a function of a maturing software development process. Thus, the trends in expenditures due to tbe four major quality cost categories-appraisal, prevention, internal failures, and external failures-are presented over tbe five levels of software process matu rity, according to the Software Engineering Institute's (SEI's) Capability Maturity Model for Software (CMM). The Software Cost of Quality Model conservatively pro poses tbat tbe total cost of quality, expressed as a percentage of the cost of develop ment, can be decreased by approximately two-tbirds as process maturity grows from Levell to Level 5 of tbe SEts CMM.
Introduction
Two questions often asked of quality function pro fessionals by a software project manager are, How much will working on these quality processes cost me? and What can I expect in return for my invest ment? The manager recognizes that to implement a quality improvement project, resources must be al located toward processes not currently being undertaken, and prior management experience has proven that usually the resources available are barely adequate to meet aggressive project and schedule deliverables. Also impl icit in the man ager's questions is the expectation of some point of diminishing returns: Even if there is benefit from an investment in quality-related work, help me under stand the point at which the investment will be
more costly than what I can get in return.
Background-The Traditional Cost of Quality Model
The concerns expressed by our present-day hypo thetical software manager are the same concerns expressed by industrial management during the 1950s. At that time, the quality function profes sionals saw the need to extend quality attainment efforts beyond the traditional inspection and test activities to the processes further upstream in the manufacturing and product development groups. Quality function managers, hoping to increase the scope of the quality effort, were faced with the task
Digital Technical journal Vol. 5 No. 4 Fall 1993
of convincing upper management of the necess ity to al locate additional resources to quality attain ment. Management demanded that the quality function quantitatively demonstrate the amount of resource investment that was necessary and the expected return on that investment.
The quality function professionals responded by developing an investment model that expressed quality i n terms of costs-the cost of attaining qual ity (the investment) and the cost of not attaining qual ity (the return). Their argument was that mod erate increases in the former (typical ly, appraisal processes, such as inspection and test, and some defect prevention processes) would result in signif icant decreases in the latter (e.g . , defects, scrap, repair and warranty costs), up to some point of diminishing returns. The traditional Cost of Quality Model shown in Figure 1 graphically represents their investment model . 1 The three curves portray moderate increases in prevention and appraisal costs resulting in dramatic decreases in failure costs. The point of inflection in the total cost of quality quadratic curve represents the point of diminishing returns on quali ty investment.
Figure 1 reflects the bel ief of the 1950s' quality function professionals that attaining 100 percent conformance to specification would be prohibi tively expensive. The rationale was that zero-defects production would require extensive testing and inspection at every point in the design, manufacture,
Software Process and Quality
f- (j) 0 u
0
COST OF FAILURES
�
COST OF DEFECT
�
APPRAISAL ANDPREVENTION
CONFORMANCE TO SPECIFICATION (PERCENT) 1 00
Figure 1 Traditional Cost of Quality Model
and delivery process. Consequently, they con ceived of a point of diminishing returns on quality related investments. This point of maximum quality attainment for the minimum amount of investment is exactly the point of interest to our hypothetical software manager.
The modeled point of diminishing returns, however, was not verified by empirical cost of qual ity data. 2.3.4 In actual practice, investment in quality attainment shifted from appraisal to prevention pro cesses as the quality function moved upstream into the manufacturing process and product design groups. Defect prevention processes, such as statis tical process control and robust product designs, actually reduced the overall cost of attaining qual ity, contrary to the expectation of the quality func tion of the 1950s. Designing durable products to delight customers and manufacturing these prod ucts in a well-controlled environment resulted in fewer defects at the point of final inspection. Thus, appraisal costs were reduced significantly. (The author has participated in cases where successful application of defect prevention processes led to the complete elimination of expensive inspection and test.S)
The Revised Cost of Quality Model
The quality function managers of the 1950s could not conceive of a quality investment model that did not rely heavily on inspection and test. Actual expe rience, however, uncovered that an increased emphasis on defect prevention processes led to sig nificant reductions in appraisal costs and, in some cases, eliminated final inspection. The empirical cost of quality data resulted in a revised model, published in 19882 As shown in Figure 2, the
10
f- (j) 0 u
0
COST OF FAILURES
COST OF DEFECT APPRAISAL AND PREVENTION
� TOTAL COST
/ OF QUALITY
CONFORMANCE TO SPECIFICATION (PERCENT)
Figure 2 Revised Cost of Quality Model 1 00
Revised Cost of Quality Model extracts the point of diminishing returns.
The three curves express the changing quality cost structure as qual ity attainment efforts shift from appraisal processes to the processes designed to achieve higher-quality output befo re final prod uct test. In the revised model, the costs due to defect appraisal and defect prevention r ise moder ately as investments are made to improve product quality. The moderate i ncreases in the costs of appraisal and prevention resu lt in dramatic decreases in the failure costs. Unl ike the corre sponding curve in Figure 1 , appraisal and preven tion costs do not increase exponentially, since the means of quality attainment shifts from defect appraisal to defect prevention. The total cost of quality curve in Figure 2 consistently decreases as quality improves; therefore, the curve does not have a point of diminishing returns.
The Software Cost of Quality Model
The Revised Cost of Quality Model has been used extensively in the manufacturing and service indus tries as a benchmark against which actual quality costs are compared. The model has thus helped organizations identify opportunities for continuous improvement.4 Also, a leading government research corporation, MITRE Economic Analysis Center, recently advocated using this method for reducing the cost of quality in software development.6 What is lacking, however, is a model of qua lity costs in the domain of software development.
Important differences exist between the domains of the industrial environment and the software development environment. While an extrapolation of the Revised Cost of Quality Model can be made
to monitor software quality costs (as suggested by MITRE), the author believes greater detail on and adjustments to the cost trends are required to account for differences between the domains. This paper presents a model that incorporates these differences. The Software Cost of Quality Model offers a rationale that addresses the reason able concerns expressed by our hypothetical soft ware manager.
Modeling the Cost of Software Quality
As background for a discussion of the Software Cost of Quality Model, this section deals with the subject of attaining software quality cost data and l ists the software quality cost categories.
Software Quality Cost Data
Whereas the literature has sufficient data to sup port estimates of the costs related to not attaining software quality (e.g., defect and software mainte nance costs), the author has been unable to locate rigorous accounting of costs related to attaining quality (e.g. , testing and defect prevention). This is not surprising, given the relative lack of cost met rics tracked in software development. Capers Jones asserts that fu ll quality costs have been tracked in some projects; in a personal conversation with the author, Jones cited his own work at International Telephone and Telegraph (ITT).7 Other consu lting firms (e.g., Computer Power Group) reported to the author that some clients kept limited metrics of defect costs. In follow-up investigation, however, the author has not fou nd any rigorous accounting of defect appraisal and defect prevention costs in software development.
Consequently, the Software Cost of Quality Model offered in this paper extrapolates two key concepts from Gryna's Revised Cost of Quality Model (shown in Figure 2): (1) moderate invest ments in quality attainment resu lt in a significant
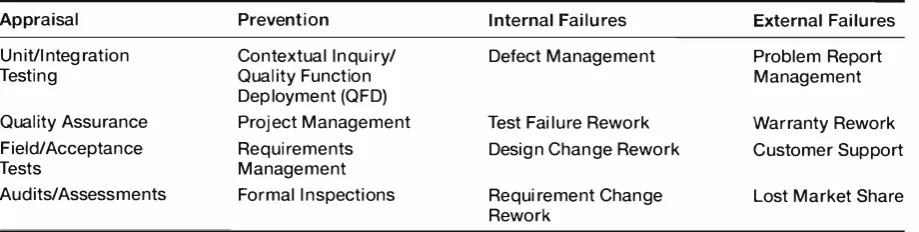
Table 1 Software Quality Cost Categories
Appraisal
Unit/1 ntegration Testing
Quality Assurance Field/ Acceptance Tests
Audits/ Assessments
Prevention
Contextual Inquiry/ Quality Function Deployment (QFD) Project Management Requirements Management Formal Inspections
Digital Technical journal Vol. 5 No. 4 Fall/993
Modeling the Cost of Software Quality
decrease in the cost of not attaining quality, and (2) an emphasis on attaining quality through defect prevention processes results in an overall decrease in the cost of traditional testing activities.
Software Quality Cost Categories
Following the modern trend in the industrial and service industries, the Software Cost of Quality Model subdivides the driving cost elements into four categories: appraisal and prevention (the costs of attaining quality, i.e., the investment), and inter nal fai lures and external failures (the costs of not attaining quality, i.e., the return) 2 ·3·4 Table 1 pro
vides some examples of these elements in software development. The l ist of elements within each cost category is meant to be exemplary, not exhaustive.
Appraisal Costs Traditionally, the costs associ ated with appraisal activities are those incurred by product inspection, measurement, and test to assure the conformance to standards and perfor mance requirements. I n software development, these costs are usually related to the various levels of testing and to audits and assessments of the soft ware development process. Appraisal costs also include costs (e.g., quality assurance) incurred by organizations that provide test support and/or monitor compliance to process standards.
Prevention Costs Wh ile appraisal costs are those used to find defects, prevention costs are those incurred by process improvements aimed at pre venting defects. The examples of prevention costs l isted in Table 1 are the costs that worried our hypo thetical software manager, because for the most part, defect prevention processes in software are not traditional. Such processes are perceived as "front-loaded" processes, which lengthen the ini tial development schedule and threaten the proba bil ity that a project will deliver on the scheduled
Internal Failures
Defect Management
Test Failure Rework Design Change Rework
Requirement Change Rework
External Failures
Problem Report Management
Warranty Rework Customer Support
Lost Market Share
[image:13.592.61.521.611.727.2]Software Process and Quality
target date. Ironical ly, field testing (an appraisal cost) and the subsequent rework of found defects (internal failure costs) are traditional ly accepted by software managers as legitimate yet frustrating tasks in the development cycle. One goal of software defect prevention processes is to reduce (and possi bly eliminate) the need for expensive field testing.
Internal/External Failure Costs Failure costs are primarily due to the rework, maintenance, and management of software defects. Internal failures are software defects caught prior to customer release, whereas external failures are detected after release. Consistent with the initial cost of quality findings in the manufacturing industry data, the majority of quality costs in software are incurred by internal and external failures. The literature indicts the rework from software defects as the most signif
icant driver of all development costs. Independent studies show costs associated with correcting soft ware defects that range from 75 percent of the development effort at General Motors, to an aver age of 60 percent for U.S. Department of Defense projects, to an average of 49 percent, as reported in
a survey by 487 respondents from academia and industry. R.9.IO
[image:14.593.316.533.94.375.2]The Model
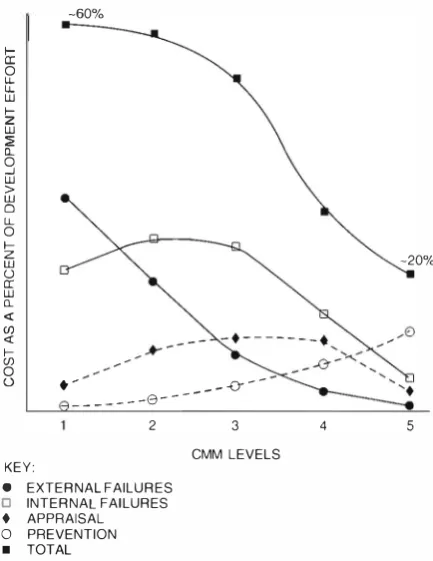
Figure 3 depicts the Software Cost of Quality Model. The curves represent how the quality cost structure changes as a software development environment improves its capability to deliver a high-quality, bug-free product. Whereas the x-axes in Figures 1 and 2 reflect improving process capa bility in an industrial environment, the x-axis in Figu re 3 is based on the Software Engineering Institute's (SEI's) Capability Maturity Model for Software (CMM)H The Software Cost of Quality Model incorporates the CMM, which offers a descriptive road map for improving software devel opment processes. The details of this road map provide a rationale for theorizing the changing qual ity cost structure within the domain of software development.
The Maturing Software Development Process
The CMM is too extensive to describe ful ly in this paper. (Humphrey presents a detailed account ing.12) The central concept of the CMM is that a soft ware development environment has a measurable process capabil ity analogous to industrial process
12
f a: 0 l!. l!. w f z w ::ii a._
0 ...J w > w 0 l!. 0 f z w (.) a: w a._
<( (/) <( f (/) 0 (.)
-60%
.
----e ---
-o---2
KEY:
e EXTERNAL FAILURES
D INTERNAL FAILURES t APPRAISAL 0 PREVENTION
• TOTAL
3
CMM LEVELS 4
Figure 3 Software Cost of Quality Model
-20%
5
capability. In the software domain, process capabil ity can be measured through assessment. The CMM proposes five levels of capability, ranging from the chaotic, ad hoc development environment to the ful ly matured and continual ly optimizing, production-l ine environment.
The SEI estimates through their assessment data that most software development environments are at the initial, chaotic level of capabil ity. The SEI has also declared that although some individual proj ects show the attr ibutes of the highest level of capa bility, no organization measured has demonstrated full maturation. Since no organization has made the journey to full maturation, and since scant data exists on the appraisal and prevention costs as they apply to software development, the Software Cost of Qual ity Model uses CMM Levels l to 5 as the dis crete milestones at which the appraisal, preven tion, and internal and external failure cost trends can be theorized.
Software Cost of Quality Model Assumptions
Before the cost trends in Figure 3 are examined in detail, two data-driven assumptions need to be declared. First, the total cost of quality (the sum of
the costs associated with appraisa l, prevention, internal failures, and external failures) at CMM Level 1 is equal to approximately 60 percent of the total cost of development. This assumption is based pri marily on internal failure cost data taken from the literature and external failure cost data tracked at Digital. The estimate of internal fail ure costs comes from recent data col lected by Capers jones. The data indicates that software rework due to internal failures consumes 30 to 35 percent of the develop ment effort for projects the size of those typical at DigitaJ. 13 The lower range of this figure has been added to the cost of the Customer Support Center (CSC) management of external failures, which an unpublished study by the Atlanta esc estimates to be 33 percent of the development costs (available internally on ly, on TPSYS::Formal_lnspection, Cost of a Software Bug, Note 31 .0). Thus, the estimate of a total cost of qual ity equal to 60 percent of the development cost is based on the sum of the esti mates of just two of the many cost elements, na mely, rework due to internal failures and esc management of external failures.
The second assumption is that the total cost of quality will decrease by approximately two-thirds as the development process reaches fu l l maturity, i.e., CMM Level 5. This assu mption is based on nor mative case-study industrial data cited by Gryna 2 The data details the recorded change in the total cost of quality at the Al lison-Chalmers plant during seven years of its quality improvement program. 14 Table 2 summarizes the reduction i n the total cost of quali ty at Al lison- Chalmers and relates this reduction to a similar change theorized in the Software Cost of Quality Model.
Although it may be unwise to assume that a nor mat ive trend for the manufacturing industry can be appl ied to software development, note that the assumed two- thirds decrease in the total cost of qu ality is more conservative than the estimates of SEI's Dr. Bill Curtis. He claimed return on invest
ments (ROis) in the range of 5: I to 8 : 1 , as an organi zation progresses in process maturity. 15 (Note:
Table 2 Reduction in Total Cost of Qual ity (TCQ)
I n itial TCQ
Improved TCQ TCQ Decrease
All ison-Chalmers (% of Cost of Sales)
4.5 1 .5
67.0%
Digital Teclmical]ournal Vol. 5 No. 4 Fall /993
Modeling the Cost of Software Quality
These claims have received empirical support from Quantitative Software Management [QSM) Associates, who report measured decreases in required effort and overall development cost on the order of 5 : 1 . 16)
The Changing Cost Structure
Given the two grounding assumptions j ust dis cussed, the paper now presents a theoretical view of the changing cost trends between Level 1 and Level 5. The theory is based on the expected returns on investing in process maturity as ou tlined by the CMM. This section examines the details of Figure 3.
CMM Level l
The SEI estimates that 90 percent of the software organ izations today are at Level 1, which is charac terized by an ad hoc, u ndefined, and sometimes chaotic development enviro nment, highly depen dent on heroic individual effort to meet del ivery elates. Little attention is given to fundamental pro cess management in this highly reactive atmo sphere, and rework to correct internal and external fail ures is often perceived as necessary " fire fight ing" to avoid disaster. At this level, the major costs of software quality are due to rework and mainte nance. Testing is sporadic, so appraisal costs are minimal and most defects are experienced by the customers, resulting in expensive warranty costs and loss of market share. The costs associated with defect prevention approach zero.
CMM Leve/ 2
A software organization at Level 2 has instituted the fundamental processes to manage resources, arti facts, and change. Project management, configura tion management, and requirements management are the key processes that characterize a CMM Level 2 development environment that is, at the least, repeatable. ln Figure 3, appraisal and internal fail ure costs increase at this level, primarily due to the
Software Cost of Qual ity Model (% of Cost of Development)
60.0 18.0 67.0%
Software Process and Quality
formation of a quality assurance organization that monitors comp liance to proscribed testing stan dards. Since, at Level 2, the organization applies testing activities more rigorously, more defects are found and reworked internally.
The increased testing activity and additional resources allocated to fix defects cause the appre hension that our hypothetical software manager expressed earlier. The manager experiences fear and uncertainty about being able to fix all the found defects and deliver the product on the scheduled date. Although our hypothetical software manager is probably aware that adherence to rigorous test ing resu lts in fewer defects shipped to the cus tomer, a manager's success is often measured on the abi lity to deliver a product on time. The reduction in external failure costs at Level 2 occurs too late in the process to mitigate the career risk of seriously missing the delivery date.
CMM Level 3
According to the CMM l iterature, the major gains at Level 2 are the creation of repeatable processes that provide the base underpinning of a maturing development environment. Figure 3 illustrates that the investments to improve quality have been primarily in the appraisal category. But at CMM Level 3, the development environment has achieved a point of stabil ity. A defined, documented frame work exists within which the creative act of
soft-v
s ERSION H I PS 1 .0
1
�-, ,
-rr
01 1 98702 03
VERSION 2.0
REVENUE 66%
GREATER THAN
PROJECTED
r
- - - ,_-- - :::...1
,
I
�
-04 0 1 1 988
02 03
II
r - ·
04
ware design can be executed in a controlled manner. Quality attainment now emphasizes invest ing in the prevention activities, such as Contextual Inquiry into customer problems and Formal Inspections of specification and design documents. Such prevention processes are intended to ensure a more accurate understanding of and a greater conformance to customer requirements. Invest ing in prevention results i n a steep decline in the external failure costs and gaining back lost market share.
Our hypothetical software m anager is entit led to be more than skeptical abou t such claims; however, empirical data substantiates them. For example, Figure 4 details the 66 percent i ncrease over pro jected revenue for VAX RALLY version 2.0, a direct resu lt of improvements made to earlier versions improvements suggested by the Contextual Inqu iries conducted with VAX RALLY version 1 .0 customers. 17 Figure 5 clearly demonstrates that Contextual Inqu iry leads not only to increased rev enue but to the higher productivity and lower defect density experienced by POLYCENTER System Census version 1 .0, when compared to four other system management appl ications.18 These applica tions, represented in Figure 5 as A, B, C, and D, were developed without the use of this critical defect prevention process.
While generally considered to be part of the appraisal process, Formal Inspections, when app lied
VERSION 2.0
SHIPS
-- -- -- · - -
.---01 1 989
1
,---
-02 03
- ,
-f- -
--
-04 0 1
1 990
-/ PROJECTED / REVENUE - ·
-I 02
NOTE: The bars represen1 1he relative revenue per quarter; the dotted line represents the linear fit of projected revenue. based on version 1 . 0 periormance. Version 2.0 includes the improvements suggested by Contextual Inquiry.
Figure 4 Effects of Contextual Inquiry on VAX RALLY Revenue
0
C POL YCENTER SYSTEM CENSUS
4
D B
Modeling the Cost of Software Quality
8 1 2 1 6
A
QUALITY
(PRE-RELEASE DEFECTS I ONE THOUSAND NONCOMMENTED SOURCE STATEMENTS)
0 80 1 60
A D c B
240
POLYCENTER SYSTEM CENSUS
320
PRODUCTIVITY
(NONCOMMENTED SOURCE STATEMENTS I PERSON WEEK)
NOTE: POL YCENTER System Census used Contextual inquiry. Applications A, B, C, and D did not use Contextual Inquiry.
Figure 5 Effects of Contextual Inquiry on POLYCENTER System Census Quality and Productivity
to source docu mentation such as specifications and design, are similar to process control monitors. These inspections ensure that critical functionality is not omitted as the development process pro ceeds from the stated requirement for a solution to the specification and design of that solution. The effectiveness of the Formal Inspection process in preventing potential inconsistencies and omissions accounts for its rating as the most efficient defect removal method, as shown in Table 3. 19 Thus, apply ing Formal Inspections as a defect prevention pro cess means fewer defects to test and fix internally and a more satisfied customer using the product. The data in Table 3 is not intended to fully account for the magnitude of the trends at Level 3. Rather, the data offers a rationale for the overall direction of these trends. If a disparity exists between the data and the acceleration of
decreas-Table 3 Defect Removal Efficie ncies
Efficiency
Method (Percent)
Formal I nspections 65 Informal Reviews 45
Unit Testing 25-50
System Testing 25-50
Regression Testing 20-50
Field Testing 30
Beta Testing 25
Digital Technical]ourual Vol. 5 No. 4 Fal/ 1993
ing failure costs i n Figure 3, bear in mind that the model is the more conservative estimator.
CMM Levels 4 and 5
Although it has seen evidence of CMM Levels 4 and 5 in a few discrete projects (e .g., one Japanese proj ect reported to be at Level 5), the SEI reports that it has not yet measured a Level 4 or a Level 5 organi zation. At these higher levels of maturity, the dominant cost of qual ity is due to the prevention elements, primarily from the cost elements of metric-driven continuous improvement and pro cess control. The software process at these levels has become so wel l characterized by metrics that it has achieved a state where development schedules are predictable. Requirements are now understood quantitatively. The costs at tributable to traditional appraisal activities, especially field testing, are dra matically decreasing, since product quality can now be appraised by monitoring the development process as opposed to expensive testing of the product. By Level 5, appraisal and failure costs have dropped to the level expected of a Six Sigma organi zation. The model proposes that the total cost of quality has decreased by approximately two-thirds, which is consistent with the normative industrial data.
Conclusion
This paper is not an endorsement of the SEI's Capability Maturity Model for Software, which is used here to describe d iscrete states within a
Software Process and Quality
maturing software development process. Although the CMM offers a rational, staged approach to achieving a predictable and highly productive development environment, the CMM is not the only road map to improving Digital's software process. For example, the variety of customers served in commercial software development offers special challenges to ensure that these customers' work experiences are brought into the design and devel opment process. The CMM does not detai l Vo ice of the Customer processes, which are practiced increasingly at Digital. In addition, some key pro cesses specified for CMM Levels 3, 4, and 5 (e .g., Formal Inspections and metric-driven Continuous Im provement) are effective in reducing defects. These processes are already used in many of D igital's organizations, even though it is doubtful that any of the software development groups at Digital would be assessed as being beyond CMM Level 2.
The author believes that CMM Level 5 is the goal, regard less of the road map for attainment. The Software Cost of Quality Model explored in this paper offers the same argument for improving pro cess capability that was offered in the manufactur ing industries: the major costs of quality are the waste and the resource loss due to rework, scrap, and the lost market share when products do not possess the quality to address the problems faced by customers. The key to reducing qual ity costs is to invest in defect prevention processes, many of which are detailed by the CMM.
So, the response to the initial concern expressed by our hypothetical software manager is the fol low ing: You will not experience a point of diminishing returns from investing in qual ity-attaining pro cesses. Certainly, there is a steep learning curve, and the short-term gains are not apparent. Given the software life cycle, most of the short-term gains will be experienced after the development is com plete and the product has been shipped.
Since investments in quality, however, are not meant to realize quick, dramatic returns, the defect prevention processes probably offer the most im mediate visible evidence that the overall cost of quality has been reduced. Yet, regardless of whether the investment is made according to the CMM road map or using some other quality attain ment plan, software managers must keep in mind that quality attainment processes require a great deal of hard work. Also, the investment must be constant to achieve the significant, long-term
16
payback, as reflected in the Software Cost of Quality Model.
Refer
ences
1 . ] . J uran and F Gryna, Quality Plann ing and Analysis (New York: McGraw-Hill, 1980).
2. F. Gryna, " Quality Costs," Juran's Quality Control Handbook, 4th eel. (New York:
McGraw-Hill, 1988).
3. ]. Campanella, Principles of Quality Costs, 2d eel. (Milwaukee, WI: ASQC Quality Press, 1990).
4. ]. Atkinson et al., Current Trends in Cost of Quality: Linking the Cost of Quality and Continuous Improvement (Montvale, NJ: National Association of Accountants, 1991).
5. S. Knox, "Combining Taguchi Signal-to-Noise Metrics with Classical Regression for Robust Process Optimization," Technical Report ISB Quality (Marlboro, MA: D igital Equipment Corporation, 1990).
6. E. deGuzman and T. Roesch, "Cost Analysis Provides Clues to Spot Quality Problems," The MITRE Washington Economic A nalysis Cen ter Newsletter (McLean, VA: April 199 3): 2.
7 C. jones, Applied Software Measurement (New York: McGraw-Hill, 1991).
8. B. Boehm, Software Engineering (Redondo Beach, CA: TRW, 1976) .
9. ]. Hager, "Software Cost Reduction Methods in Practice," IEEE Transactions on Software Engineering, vol. 15, no. 12 (December 1989).
10. W Goeller, "The Cost of Software Quality Assurance," 1981 ASQC Quality Congress Tra nsactions, San Francisco, CA (1981): 684 -689
1 1 . M . Paul k, B . Curtis, and M . Chrissis, "Capabil ity Maturity Model for Software," Technical Report CMU/SEI-91-TR-24 (Pittsburgh, PA : Soft ware Engineering Institute, Carnegie-Mellon University, 1991).
12. W Humphrey, Managing the Software Process (Reading, MA: Addison-Wesley, 19S9/1990).
13. E. Yourdon, The Decline ana Fall of the American Programmer (Englewood Cliffs,
N]: Yourclon Press, Prentice-Hall, 1992).
14. 0. Kolacek, "Quality Cost-A Place for Finan cial Impact;' Transactions of the 1976 Annual Conference of ASQc: Milwaukee, \VI (1976): 131.
15. B. Curtis, "The Superior Software Organiza tio n ," Softwa re Process Improvement Net work Meeting, Boston, MA (January 1993).
16. L. Putnam, "The Economic Value of Moving up the SEI Scale," Technical Report QSMTR93-01
Digital Technical journal Vol. 5 No. 4 Fall 199.3
Modeling the Cost of Software Quality
(McLean, VA: Quantitative Software Manage ment, Inc. , 1993).
17. ). Neilsen, Usability Engineering (New York: Academic Press, 1993): 4.
18. S. Knox, Newsletter of Continuous Imp rove
ment for Networked Systems Management, vol. 2 (Maynard, MA: Digital Equipment Cor poration, April 1993).
19. C. Jones, "Software Metrics and Total Quali ty Management," Case Outlook, vol. 6, no. 4
(1992): 1 - 1 1 .
Changing the Rules:
Paul K. Huntwork
Douglas W. Muzzey
Christine M. Pietras Dennis R. W ixon
A Pragmatic Approach to
Product Development
Developing quality software rapidly and at low cost has been an elusive goal. Nevertheless, meeting this goal is essential in today's competitive environment wbere more and better products appear at accelerating rates and customers demand systems tbat support "what users need to do" in a natural and cost effective manner. This paper discusses the processes used by the TeamLinks for Macintosh project team to acbieve customer focus tbroughout the development of a groupware office product. Listening to customers radically resbaped tbe product and led to more rapid decisions, sborter development cycles, higher qualit)J, and greater customer satisfaction.
Where We Started
Product Overview
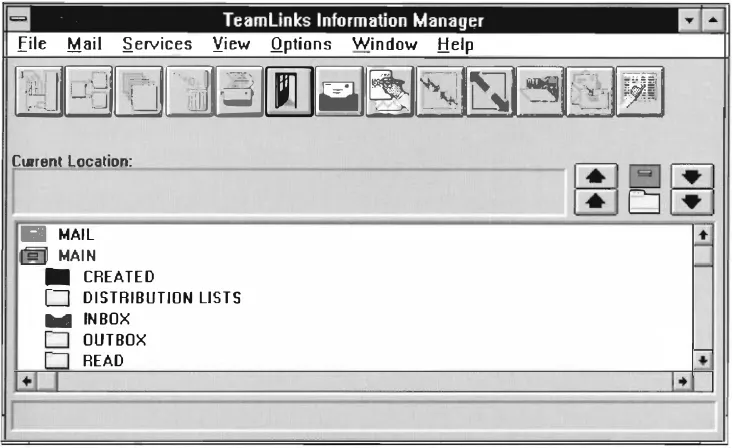
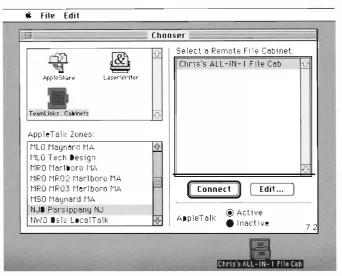
TeamLinks software allows Windows PCs and Macintosh computers to be integrated into enter prise-wide networks. The product u til izes Digital's extensive line of network applications and ser vices, such as electronic mail, file sharing, work flow procedures, and work group applications.
The TeamLinks product also makes use of the latest personal productivity and client-server tech nology as a platform for comprehensive office solu tions. Just as D igital's ALL-IN-1 Integrated Office System (I OS) allows organizations to rapidly develop organization-wide network applications in a time shared environment, TeamLinks software provides capabilities that allow the creation of company wide client-server office applications tailored to meet the needs of any operation.
TeamLinks software provides customers with an intuitive graphical user interface that integrates their powerful personal productivity tools, such as
word processing and spreadsheet applications, into local and wide area networks. This featu re is inde pendent of whether the user's desktop system is a Windows PC or a Macintosh computer.
Product Goals
For enterprise-wide work group computing strate gies to have customer appeal, they must address
18
both PC and Macintosh desktop computers. The introduction of TeamLinks for Windows during the spring/summer of 1992 further highlighted the need to immediately introduce similar functions on a Macintosh platform. The use of inside-outside strategic planning identified three primary factors that required consideration during the develop ment of admissible product del ivery strategies. 1
First, we must satisfy the wants of the potentially available market. Customers require both Windows and Macintosh desktop solutions for their enterprise work group computing. Both the TeamLinks Pro gram Office and customers requested a Macintosh platform that supported the core TeamLinks ser vices of mail, ad hoc workflow, and filing, with product availability within six to nine months.
Second, we must deliver an acceptable solu tion with the available resources. Macintosh users are frequently recognized as demanding consumers of software applications. Although the breadth of expe rience in developing Macintosh products within the group was limited, the development team con sciously planned objectives aimed at satisfying demanding consumers. The team's goals consisted of satisfying customers' basic office needs and hav ing the product recognized as a quality TeamLinks implementation on the Macintosh platform.
Third, we must develop a product within the opportunities and constraints of today's environ ment. In many development environments, the
Changing the Rules: A Pragmatic Approach to Product Development
reality of budgets with minimal and ever-decreas ing resources is rapidly becoming today's normal mode of operation. Changing strategies, require ments, and management infrastructure are also particularly characteristic of current development environments.
Product Strategy
After resolving our initial project goals, we devel oped strategies to satisfy the goals. We chose to establish design partnerships with customers to iteratively obtain comments to use as a basis for refining the project's specific deliverables.
Most problem-solving strategies are simple varia tions of (1) define the problem, (2) develop solu tions, (3) test, and (4) refine the solutions. The TeamLinks project team chose an iterative and con current adaptation of this strategy.
First, we identified our implicit working assump tions. Initially, the project assumed that all com ponents present in the TeamLinks for Windows product would simply be ported to the Macintosh platform and retrofitted with a Macintosh user interface.
Second , we cleve.l.oped prod uct plans based on our initial goals and implicit working assumptions. Iterative design techniques require prototypes that customers may evaluate and comment on. The project's initial product plans were utilized as the first product prototypes for collecting cus
tomer responses.
Third, we verified and refined our plans based on va lidated information. As product prototyping got under way, the team analyzed information from competitive products, industry consultants, and customers. A key consideration for the develop ment team was that throughou t the life cycle of the project, specific product deliverables would be changed as customer opinions became clear. As incoming data evolved into information, the cost and benefits of each change would be carefully weighed against the project's goals.
Product development thus proceeded on two fronts: one formulated in advance, the other cre ated in response to new deve.lopments, customer comments, and experience with successes and fail ures of the plan.
Select the Best Work Model
Since the emergence of the software industry and continuing through the present, the ability of soft ware groups to produce high-quality software has
Digital Technical]oU7·nal Vol. 5 No. 4 Fall 1993
fallen far short of customer needs and demands. In response to this condition, government and aca demic specialists proclaimed a "software crisis" in
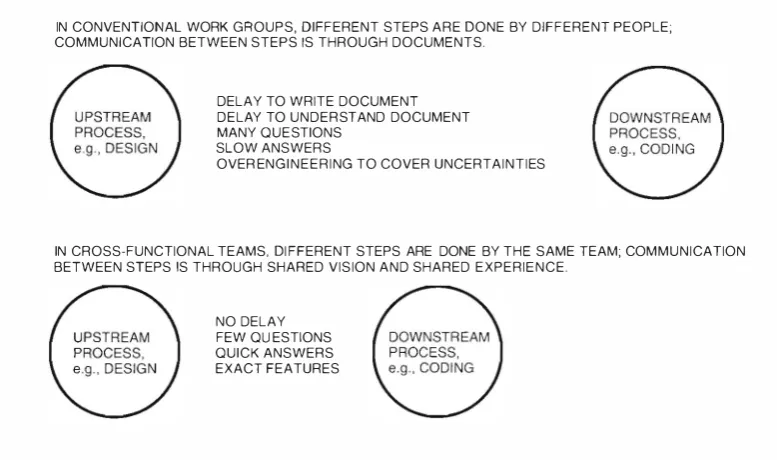
1969 and endorsed a concept of software engineer ing based on authoritative , hierarchical organiza tions and sequential application of specialized functions2 This model of software engineering is still prevalent in textbooks. Ironically, the model was created at a time when the competitive advan tage of total worker participation in cross-functional teams, an outgrowth of Deming's approach to man agement, was being demonstrated in other indus tries -' The cross-functional approach is now widely recognized as a superior method of new product development. Figure 1 shows bow cross-functional teams speed up work. Twenty-four years of the sequential model have not diminished the software crisis. We feel privileged to have been able to apply the cross-functional model to the development of the TeamLinks for Macintosh product. Descriptions of other best practices used by the Team Links team foiJow.
Find Out What Your Customer Needs Determining the needs of our customers involved field research, quantitative research, and design jus t ification through grounding.
Field Research One of the most powerful ratio nales for field research is the realization that effec tive design begins with the discovery of exactly what users and customers want and do. Field research methods are designed to provide such in-depth understanding. These methods emphasize openness to user experience and create a d ialog with users about that experience. Direct contact with users at early stages of design is viewed as an essential step, and the barrier between users and designers has been cited as a significant cause of suboptimal design 4·s
Quantitative Research Given that discovery is the first stage to effective design, the next stage is decision 6 Most l ikely, a team wil l not be able to respond to all user needs. Thus, it needs a system atic and objective way to make decisions. Quanti tative methods provide a basis for decisions because they establish a dimension along which features can be compared .
Grounded Design Unfortunately, many designs
have an insufficient basis. Third-hand information brainstorming, anecdotes from trade shows, an
d
Software Process and Quality
IN CONVENTIONAL WORK GROUPS, DIFFERENT STEPS ARE DONE BY DIFFERENT PEOPLE; COMMUNICATION BETWEEN STEPS IS THROUGH DOCUMENTS.
DELAY TO WRITE DOCUMENT
DELAY TO UNDERSTAND DOCUMENT MANY QUESTIONS
SLOW ANSWERS
OVER ENGINEERING TO COVER UNCERTAINTIES
IN CROSS-FUNCTIONAL TEAMS, DI FFERENT STEPS ARE DONE BY THE SAME TEAM; COMMUNICATION BETWEEN STEPS IS THROUGH SHARED VISION AND SHARED EXPERIENCE.
[image:22.593.109.498.84.314.2]NO DELAY FEW QU ESTIONS QUICK ANSWERS EXACT FEATURES
Figure 1 How Crossjunctional Teams Speed Up Work
speculative talk abou t "what the customer really wants" within an isolated team all contribute to designs that do not meet customer needs and designs that do not reflect customer work. To ground a design means that all aspects of the design are rooted in customer data rather than in specula tion. Providing mechanisms for this grounding is critical to producing an effective design.
Design Your Product Based on What You Learn
Demand pull, customer i nvolvement, and design metaphors all contribute to a customer-focused product design.
Demand Pull Using customer interaction to pull design features out of the development team greatly reduces the number of design decisions and the time required to make these decisions. A customer focus on work essentials and not on "bells and whistles" provides u nambiguous feedback that sup ports direct decisions 7
Customer-driven Design Design is a process of refinement and elaboration embedded in a cycle of creation and evaluation. Customer-driven design i nvolves the evaluation of a tentative design (the creation) with the customer's evolving understand ing of their work vis-a-vis the product.
Design Metaphors Metaphors are an effective way to generate a design from customer work and
20
technical capabi lities. Examples include the "desk top" metaphor that drives much user interface design today. Although often criticized, metaphors have been shown tO be very powerful and funda mental to human thought 8,9, IO
Refine Your Product with Customers Usi ng an iterative approach to product design com bined with prototyping helps refine the product design.
Iterative Requirements The need to break the development of complex software into manageable pieces has Jed to schemes such as "separation of concerns," "top -clown development," and "step-wise refinement." Iterative design addresses this problem with a " basics first" approach. A basic idea is embod
ied in a prototype implementation and reviewed
with customers. The iterative approach a llows solu tions to come into being and quickly converge to finished products u nder the infl uence of user inter action, even while users are d iscovering what they need. Detailed requirement specifications are not necessary to begin implementation, so there is no time Jag between gathering requirements and pro viding solutions. This approach minimizes miscom munication and eliminates obsolete requirements. ll
Prototyping Prototyping supports a customer driven design process, providing customers with an effective medium to respond to current system th inking. 12 For instance, user interface designs
Changing the Rules: A Pragmatic Approach to Product Development
embody a theory abou t the way users work. 1" The most straightforward way to get feedback on the theory is to express it in a prototype. A prototype al lows users to try the system directly instead of translating their work into an unfamil iar symbolic language. 14
What We Did
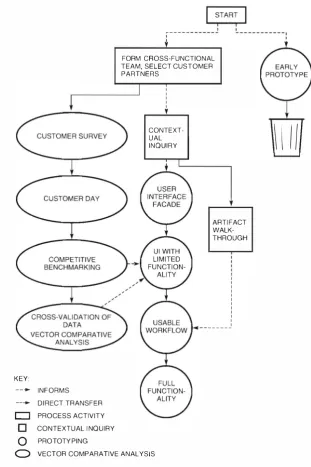
The project team developed customer partnerships early in the project life cycle. Through Contextual Inquiries, focus groups, and artifact wal k-throughs,
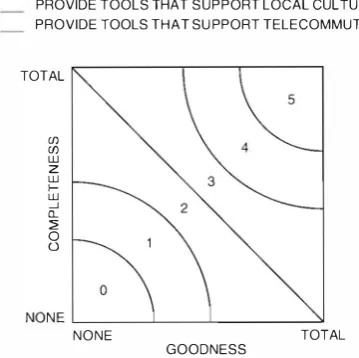
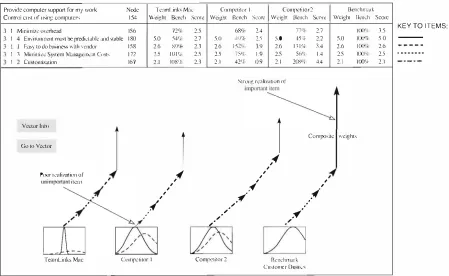
the team internalized customer needs and require ments. The new data helped establish a shared understanding among team members and mani fested itself in a new product design . Vector Com parative Analysis (VCA) data summarized team learnings and provided the fou ndation fo r new designs. Figure 2 diagrams this process.
Find Ou t What Your Customer Needs
Crossjunctional Teams The team comprised
product managers, engineering managers, engineers
�
I
FORM CROSS-FUNCTIONAL TEAM, SELECT CUSTOMER PARTNERS
KEY:
--..- INFORMS
--.. DIRECT TRANSFER
D PROCESS ACTIVITY
0 CONTEXTUAL I NQUIRY
Q PROTOTY PING
I I I I I
'f
CONTEXT UAL INQUIRY
Q VECTOR COMPARATIVE ANALYSIS
ARTI FACT WALK THROUGH
I I
-Figure 2 Overall "Find Out" and "Refine" Activities
Digital Tecbtlical jountal Vul. 5 No. 4 Fall 1993