ENERGY EFFICIENT INTRUSION DETECTION SYSTEM
FOR WIRELESS SENSOR NETWORK USING NEURAL
NETWORK
1SYEDA GAUHAR FATIMA, 2Dr.SYED ABDUL SATTAR AND 3Dr.K ANITHA SHEELA 1
Research Scholar, Department of ECE
Jawaharlal Nehru Technological University, Hyderabad, India
2Professor & Dean, Department of CSE
Academics in Royal College of Technology and Science, Hyderabad
3Co-ordinator, Examination Branch, JNTUH
E-mail: [email protected]
ABSTRACT
In wireless sensor network (WSN), the existing intrusion detection techniques rarely consider energy consumption for judging the node state. Also there is need for increased detection rate. Hence in this paper, we propose an energy efficient intrusion detection system for WSN. Initially the nodes deployed in the network are analyzed for malicious activity based on their residual energy. If the energy consumption of a node is greater than a predicted threshold, it is considered as malicious and the packets emerging from these nodes are said to be abnormal. The abnormal packets are passed through the Back Propagation Network (BPN) to analyze the data misinterpretation. In case, the output of BPN is found to be abnormal, then the attack detection is confirmed and attack type is estimated. By simulation results, we show that the proposed technique is more energy efficient.
Keywords: WSN, Intrusion Detection, Wnergy Efficient, Neural Network
1. INTRODUCTION
1.1 Wireless Sensor Network (WSN)
Wireless sensor network (WSN) has become a very important topic with the rapid development that is vulnerable to a wide range of attacks due to deployment in the hostile environment. A WSN is a large network of resource-constrained sensor nodes with multiple preset functions, such as sensing and processing with number of low-cost, resource limited sensor nodes to sense important data related to environment and to transmit it to sink node that provides gateway functionality to another network, or an access point for human interface. These sensor networks are composed of energy constrained nodes embedding limited transmission, processing and sensing capabilities. Therefore network lifecycle becomes short and hence energy-efficient technique implementation becomes an important requirement for WSN.
The WSN with Coverage and Connectivity have been implemented in many fields like Environment Data Collection where a canonical environmental data collection application is one where a research scientist wants to collect several sensor readings
from a set of points in an environment over a period of time in order to detect trends and interdependencies and then analyze the data. Security Monitoring are composed of sensor nodes that are placed at fixed locations throughout an environment that continually monitor one or more sensors to detect an anomaly. Node Tracking Scenarios used in tracking of a tagged object through a region of space monitored by a sensor network [1][2][3][14].
1.2 Intrusion Detection System (IDS)
Two typical WSN IDS: Collaboration-based
Intrusion Detection (CID) and Routing Tables Intrusion Detection (RTID). Collaboration-based Intrusion Detection (CID) is a continuous Intrusion detection system that detects intrusion during the cluster duty-cycle. Routing Tables Intrusion Detection (RTID) is an event-driven Intrusion detection system. While the attacks are occurring, the IDS will compare the attack data and raise alarms [4][5][6].
1.3 Issues of IDS in WSN
• It is not possible for IDS to have an active full-powered agent inside every node in a sensor network. Each node is totally independent, sending data and receiving control packets from a central system called Base Station, usually managed by a human user. [7]
• Without the IDS in WSN the threats can damage the network and consume large quantity of energy in monitoring suspicious nodes.
• WSNs are composed by numerous low-cost and small devices, and are deployed into an open and unprotected area so they are vulnerable to various types of attacks.
• The network lifetime decreases through utilizing the network’s energy in a inefficient manner by the malicious nodes
1.4 Problem Identification and Solution
In [9] a novel intrusion detection scheme based on the energy prediction in cluster-based WSNs (EPIDS) has been proposed. In this approach, sink node predicts the energy consumption of each sensor node and gathers the residual energy of each sensor node. The sensor nodes check their residual energy with the residual energy found by the sink node through a broadcast message. If EPIDS detects abnormal energy consumed at a node then the node’s ID will be put in a blacklist and it will be removed from the routing table.
The main drawback of this approach is that during the process of finding the malicious node, the only thing considered is the energy consumed by that particular node which may not be sufficient enough to judge a node without considering its past transactions.
In this paper, we propose a Hybrid Intrusion Detection System (HIDS) which consists of anomaly and misuse detection module. This
approach increases the detection rate and decreases the false positive rate.
2. LITERATURE REVIEW
K.Q. Yan et al,.[8] have proposed an Intrusion Detection System (IDS) created in cluster head. The proposed IDS is a Hybrid Intrusion Detection System (HIDS). It consists of anomaly and misuse detection module. The goal is to raise the detection rate and lower the false positive rate by the advantages of misuse detection and anomaly detection. However, a decision-making module is used to integrate the detect results and to report the types of attacks. The advantage of this approach is that the performance of the misuse detection module is evaluated.
Wen Shen et al,.[9] have proposed a novel intrusion detection scheme based on the energy prediction in cluster-based WSNs (EPIDS). The main contribution of EPIDS is to detect attackers by comparing the energy consumptions of sensor nodes. The sensor nodes with abnormal energy consumptions are identified as malicious attackers. The advantage of this EPIDS is it is designed to distinguish the types of denial of service (DoS) attack according to the energy consumption rate of the malicious nodes.
Tran Hoang Hai et al,.[10] have proposed a lightweight intrusion detection framework integrated for clustered sensor networks. And provide algorithms to minimize the triggered intrusion modules in clustered WSNs by using an over-hearing mechanism to reduce the sending alert packets. The advantage of this approach is it can prevent most routing attacks on sensor networks and less energy consumption in intrusion detection than other schemes.
Edith C.H. Ngai et al,.[11] have proposed a novel algorithm for detecting the intruder in a sinkhole attack. The algorithm first finds a list of suspected nodes through checking data consistency, and then effectively identifies the intruder in the list through analyzing the network flow information. The algorithm is also robust to deal with multiple malicious nodes that cooperatively hide the real intruder. The advantage of this approach is its communication and computation overheads are reasonably low for wireless sensor networks.
version of anomaly and misuse detection techniques. In addition, they have also used cluster-based wireless sensor networks to reduce communication and computation costs. The advantage of this scheme is it performs better than other schemes in terms of energy efficiency and high detection rate.
3. PROPOSED SOLUTION
3.1 Overview
In this paper, we propose an energy efficient intrusion detection system for WSN. Initially the nodes deployed in the network are analyzed for malicious activity based on the residual energy. If the energy consumed and residual energy of the node is greater than the predicted threshold, the node is considered as malicious node. Then the packets arriving from the malicious node is normal and abnormal packets. The abnormal packets are converted into binary value and passed through the back propagation network to analyze the data misinterpretation. If the output is detected as abnormal packet, then the attack detection is confirmed and attack type is estimated. Otherwise, there is no detection of attack.
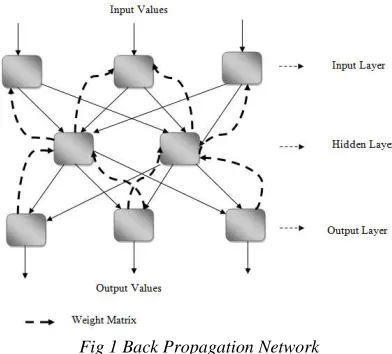
3.2 Back Propagation Network (BPN)
The back propagation network is the most characteristic model of supervised learning used in the neural network. It obtains the training data from the environment that includes input and output variables. BPN analyzes from the input and output variable whether which new input, output variables can be utilized for prediction.
BPN includes several layers which contains many processing units.
• Input layer: This includes the BPN inputs
and corresponds to the initial values of decision.
• Hidden layer: It includes the neurons that
perform weight adjustments of neuron linkages and estimating the appropriate weights. It also comprises of numerous sub-layers for learning the internal reflection and regulations among the inputs and outputs, thereby attaining accurate results.
• Output layer: This includes the BPN
output and corresponds to the ultimate result of training at this training operation.
The time duration for updating the weights and biases of the network until all data are trained and task get complete is termed as epoch. Using these epoch values, BPN continues its training repeatedly by tuning the weights between the layers till the output of the network is equalized to the target value.
The control procedure of BPN involves the following two functions.
• Forward Pass: This runs the neural
network and estimates the error in each neuron existing in the output layer.
• Backward Pass: This process is initiated
[image:3.612.318.514.325.502.2]at the output layer and the errors are transmitted back through the network layer wise. This is performed utilizing the local gradient of each neuron.
Fig 1 Back Propagation Network
3.4 Node States
The sensor nodes operates in the following five states
1. Sleep state (Es): During this state, the sensor nodes do not interact with other nodes. It remains idle.
2. Sensing state (Esen): During this state, the node senses physical parameters such as temperature, atmospheric pressure etc.
3. Computing state (Ecm): The sensor node processes the received data during the computing state.
4. Transmission state (Etx) : This state involves the transmission of data to the sink
Based on the time and energy consumed during these working states, the energy dissipation in sensor nodes can be estimated. (Shown in section 3.5.1)
3.5 Estimation of Metrics
3.5.1 Energy Dissipation
Let S= {S0, S1, S2,…., Sn} be the operational
states of the nodes
Let x and y be the two states of node, (where x, y = 1, 2, 3, 4)
The state of node (Explained in section 3.2) keeps changing during the process of data transmission or reception at time t1. In time
duration tn, the probability that the node changes its
state is denoted using Equation (1) [9]
n xy
P
= P {Sn = y | S0 = x} (1)n xy
P
is computed using the following Chapman-Kalmogorov equations:n xy
P
=∑
= − n
z
i n zy i xz P
P 0
) ( )
( (2)
The time duration T upto which the node stays in the state y is given using the equation (3)
TS =
∑
= T
t n xy
P
1
(3)
The amount of energy dissipated in the subsequent time duration TS is given using Eq (4)
Ed =
∑ ∑
= =
4
1 1
) * (
y T
t y n xy E
P (4)
where Ey represents the energy dissipated in state
y during one TS.
As energy dissipation is concerned with the four states such as sensing, computing, transmission and reception, this count is alone is considered for the computation in Eq (4).
3.5.2 Residual Energy
The residual energy (REi) of each node (Ni) after
one data communication is estimated using following formula. [14]
REi = Eini – (Etx + Erx) (5)
Where Ei = Initial energy of the node
Etx & Erx = energy utilized at the time of
transmission and reception of data.
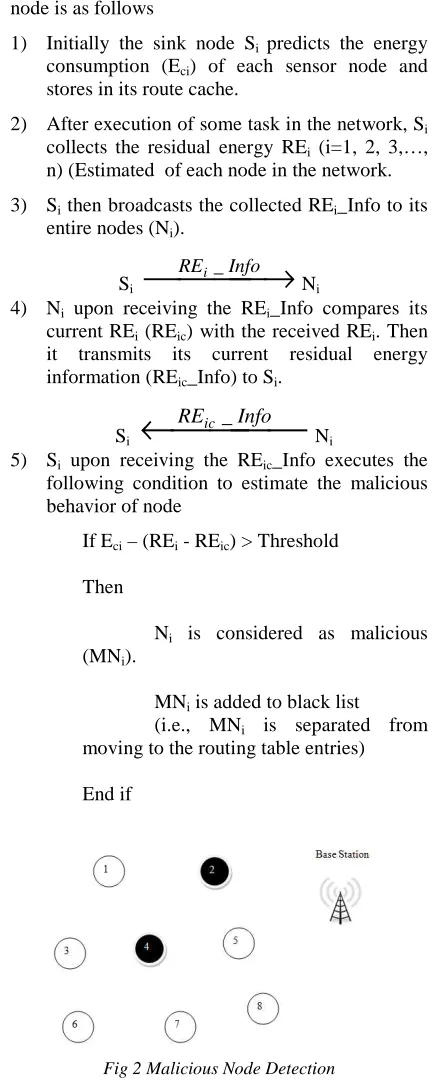
3.6 Detection of Malicious Node
The steps involved in the detection of malicious node is as follows
1) Initially the sink node Si predicts the energy
consumption (Eci) of each sensor node and
stores in its route cache.
2) After execution of some task in the network, Si
collects the residual energy REi (i=1, 2, 3,…,
n) (Estimated of each node in the network.
3) Si then broadcasts the collected REi_Info to its
entire nodes (Ni).
Si
→
Info REi_
Ni
4) Ni upon receiving the REi_Info compares its
current REi (REic) with the received REi. Then
it transmits its current residual energy information (REic_Info) to Si.
Si
←
Info REic_
Ni
5) Si upon receiving the REic_Info executes the
following condition to estimate the malicious behavior of node
If Eci – (REi - REic) > Threshold
Then
Ni is considered as malicious
(MNi).
MNi is added to black list
(i.e., MNi is separated from
moving to the routing table entries)
[image:4.612.308.526.107.652.2]End if
Fig 2 Malicious Node Detection
Fig 2 represents the malicious node detection technique. The node N2 and N4 are detected as
malicious nodes and recorded in the blacklist.
The data packets evolving from the nodes are analyzed whether it exhibits strange or normal behavior based on the node type.
If Ni = MNi
Then
The packet originating from MNi is considered as
abnormal packets
Packets are submitted to Back Propagation Network (BPN) to analyze the misinterpretation. Else
The packet are considered as normal packets
End if
3.7.1 Analysis of Data Misinterpretation
The process of analyzing the data to decide whether it is misinterpreted or not is executed using the following steps.
Let the learning rate be assigned to 0.5 or in the range of (0.1, 1.0). (Assigned during simulation)
Let the values of weights and biases be in the range of (0, 1)
1) Initially, the abnormal data packet is converted to stream binary value and then it is passed through BPN as inputs value.
Process flow: Abnormal data
→
Binary Value→
BPNThis input training data (Binary value) comprises of target value for performing the training.
2) The input layer performs the computation of actual output using feed forward method. The number of processing inputs layer is determined based on selected features for packet.
3) The output of input layer is fed to the hidden layer that estimates the error and performs the output improvement using the back propagation technique. The number of hidden layer is estimated based on average of input and output layers.
4) The training data is learned continually and weights among the layers are adjusted through many epochs.
5) Step 4 is repeated until the output of network is analogous to the target value and the training is absolute.
6) The output of BPN (OB) is compared with the output of malicious detection (OM) to estimate about the intrusion and attack type. This is shown using the following condition.
If (OM = abnormal) & (OB = normal)
Then
No attack detection and it is invalidly classified.
Else if (OM = abnormal) & (OB = abnormal)
Then
Attack has been detected and attack class is identified. (Using the
condition)
Based on the attack detection in the nodes, the attack category is identified by executing the following condition.
a) If Eci
≥
γ
(REi), then the malicious nodeintroduces Hello flood attack.
b) If Eci
≤
REi, then the malicious nodeintroduces selective forwarding attack.
c) If 2(REi)
≤
Eci≤
(γ
-1) REi, then themalicious node introduces Sybil attack.
d) If REi
≤
Eci≤
2 (REi), then the malicious nodeintroduces wormhole attack.
e) If (
γ
-1)REi≤
Eci≤
γ
(REi), then the maliciousnode introduces sinkhole attack.
Where
γ
is a constant.3.6.2 Advantages of this proposed approach
• Since the past of the node is been taken into consideration the intrusion detection will be done more effectively
• And also the energy of the network will increased and utilized in a efficient manner
3.7 Flow chart of the Proposed Approach
Fig 3 Flowchart Of Proposed Approach
4. SIMULATION RESULTS
4.1. Simulation Model and Parameters
We use Network Simulator Version-2 (NS2) [15] to simulate our proposed algorithm. In our simulation, the channel capacity of mobile hosts is set to the same value: 2 Mbps. We use the distributed coordination function (DCF) of IEEE 802.11 for wireless LANs as the MAC layer protocol. It has the functionality to notify the network layer about link breakage.
[image:6.612.93.303.74.308.2]In our simulation, mobile nodes move in a 500 meter x 500 meter region for 25 seconds simulation time. All nodes have the same transmission range of 250 meters. The simulated traffic is Constant Bit Rate (CBR). Our simulation settings and parameters are summarized in table 1
Table 1:
SIMULATION SETTINGS
No. of Nodes 50,100,150 and 200.
Area Size 500 X 500 Mac 802.11 Radio Range 250m Simulation Time 25 sec Traffic Source CBR Packet Size 512 Receiving Power 0.395 Sending power 0.660 Idle Power 0.035 Initial Energy 10.3 J Rate 50,100,150,200
and 250Kb
4.2 Performance Metrics
We evaluate mainly the performance according to the following metrics.
Average Packet Delivery Ratio: It is the ratio
of the number .of packets received successfully and the total number of packets transmitted.
Average Packet Drop: It is the average number
of packets dropped by the misbehaving nodes.
Delay: It is the time taken by the packets to
reach the receiver.
Energy Consumption: It is the amount of
energy consumed by the nodes for the data transmission.
We compare our Energy Efficient Intrusion Detection System (EEIDS) with the HIDS [8] technique.
4.3 Results
A. Based on Nodes
We vary the number of nodes as 50,100,150 and 200, keeping 5% of the total nodes as malicious nodes.
Nodes Vs DeliveryRatio
0.92 0.94 0.96 0.98 1 1.02
50 100 150 200
Nodes
D
e
li
v
e
ry
R
a
ti
o
EEIDS
[image:6.612.108.514.387.721.2]HIDS
Fig 4: Nodes Vs Delivery Ratio
Nodes Vs Drop
0 50 100 150
50 100 150 200
Nodes
P
k
ts EEIDS
HIDS
Nodes Vs Energy
0 2 4 6 8 10
50 100 150 200
Nodes
E
n
e
rg
y
(J
)
EEIDS
[image:7.612.98.525.70.214.2]HIDS
Fig 6: Nodes Vs Energy
Figures 4 to 6 show the results of packet delivery ratio, packet drop and energy consumption for EEIDS and HIDS, respectively, for varying the nodes from 50 to 200. From the figures, it can be observed that EEIDS outperforms HIDS in terms of delivery ratio by 2%, packet drop by 70% and energy consumption by 10%.
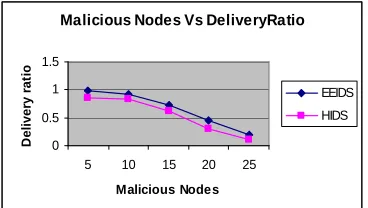
B. Based on malicious nodes
Now we vary the number of malicious nodes from 5 to 25 for 100 nodes.
Malicious Nodes Vs DeliveryRatio
0 0.5 1 1.5
5 10 15 20 25
Malicious Nodes
D
e
li
v
e
ry
r
a
ti
o
EEIDS
[image:7.612.103.287.384.488.2]HIDS
Fig 7: Rate Vs Delivery Ratio
Malicious Nodes Vs Packet Drop
0 5000 10000 15000
5 10 15 20 25
Malicious Node s
P
k
ts EEIDS
HIDS
Fig 8: Rate Vs Drop
Malicious Nodes Vs Energy Consumption
0 5 10 15
5 10 15 20 25
Malicious Nodes
E
n
e
rg
y
(J
)
EEIDS
HIDS
Fig 9: Rate Vs Energy
Figures 7 to 9 show the results of packet delivery ratio, packet drop and energy consumption for EEIDS and HIDS, respectively, for varying the attackers from 5 to 25. From the figures, it can be observed that EEIDS outperforms HIDS in terms of delivery ratio by 24%, packet drop by 39% and energy consumption by 13%.
5. CONCLUSION
In this paper, we have proposed an energy efficient intrusion detection system for WSN. Initially the nodes deployed in the network are analyzed for malicious activity based on the residual energy. If the energy consumed and residual energy of the node is greater than the predicted threshold, the node is considered as malicious node and the packets emerging from these nodes is said to be abnormal. The abnormal packets are through the back propagation network (BPN) to analyze the data misinterpretation. In case, the output of BPN is found to be abnormal, then the attack detection is confirmed and attack type is estimated. Otherwise, there is no detection of attack. By simulation results, we have shown that the proposed technique is more energy efficient.
REFERENCE
[1]. Tapolina Bhattasali, Rituparna Chaki, “A
SURVEY of RECENT INTRUSION
DETECTION SYSTEMS for WIRELESS SENSOR NETWORK”, Advances in Network
Security and Applications, Springer, 2011
[2]. T.Kavitha, D.Sridharan, “Security Vulnerabilities in Wireless Sensor Networks: A Survey”, Journal of Information Assurance
and Security, vol 5, p-031-044, 2010
[3]. Olfa Gaddour, Anis Koubˆaa and Mohamed Abid, “SeGCom: A Secure Group Communication Mechanism in Cluster-Tree Wireless Sensor Networks”, Communications
[4]. Shio Kumar Singh, M P Singh, and D K Singh, “Intrusion Detection Based Security Solution for Cluster-Based Wireless Sensor Networks”,
International Journal of Advanced Science and Technology Vol. 30, May, 2011
[5]. Ioannis Krontiris, Tassos Dimitriou, Thanassis Giannetsos, and Marios Mpasoukos, “Intrusion Detection of Sinkhole Attacks in Wireless Sensor Networks”, Algorithmic Aspects of
Wireless Sensor Networks, Volume 4837, pp
150-161, 2008
[6]. Rung-Ching Chen, Chia-Fen Hsieh and Yung-Fa Huang, “An Isolation Intrusion Detection System for Hierarchical Wireless Sensor Networks”, Journal of Networks, Vol. 5, No. 3, March 2010
[7]. Ruchi Bhatnagar, Dr. A.K. Srivastava and Anupriya Sharma, “An Implementation Approach for Intrusion Detection System in Wireless sensor Network”, International Journal on Computer Science and Engineering
Vol. 02, No. 07, 2453-2456, 2010
[8]. K.Q. Yan, S.C. Wang, S.S. Wang and C.W. Liu, “Hybrid Intrusion Detection System for Enhancing the Security of a Cluster-based Wireless Sensor Network”, Computer Science
and Information Technology (ICCSIT), 3rd IEEE International Conference, 9-11 July 2010
[9]. Wen Shen, Guangjie Han, Lei Shu, Joel Rodrigues and Naveen Chilamkurti, “A New Energy Prediction Approach for Intrusion Detection in Cluster-based Wireless Sensor Networks”, Green Communications and Networking, Springer, Volume 51, pp 1-12,
2012
[10]. Tran Hoang Hai, Eui-Nam Huh and Minho Jo, “A lightweight intrusion detection framework for wireless sensor networks”, Wireless
Communications and Mobile Computing, vol
10, pp-559–572, 2010
[11]. Edith C.H. Ngai, Jiangchuan Liu and Michael R. Lyu, “An efficient intruder detection algorithm against sinkhole attacks in wireless sensor networks”, Computer Communications,
Elsevier, vol 30, pp-2353–2364, 2007
[12]. Abror Abduvaliyev, Sungyoung Lee and Young-Koo Lee, “Energy Efficient Hybrid Intrusion Detection System for Wireless Sensor Networks”, International Conference on Electronics and Information Engineering, 2010
[13]. J. Joy Winston and B. Paramasivan, “A Survey on Connectivity Maintenance and Preserving Coverage for Wireless Sensor
Networks”, International Journal of Research
and Reviews in Wireless Sensor Networks (IJRRWSN), Vol. 1, No. 2, June 2011
[14] Vinh TRAN QUANG and Takumi MIYOSHI, “ Adaptive Routing Protocol with Energy efficient and event clustering for wireless sensor networks”, IEICE transactions, Vol E 91-B, No 9, 2008.
[15] Network Simulator:
http:///www.isi.edu/nsnam/