WRL
Research Report 98/6
Scalable kernel
performance for
Internet servers
under realistic loads
Gaurav Banga
and
Jeffrey C. Mogul
We test our ideas by designing, building, and using real systems. The systems we build are research prototypes; they are not intended to become products.
There are two other research laboratories located in Palo Alto, the Network Systems Lab (NSL) and the Systems Research Center (SRC). Another Digital research group is located in Cambridge, Massachusetts (CRL).
Our research is directed towards mainstream high-performance computer systems. Our prototypes are intended to foreshadow the future computing environments used by many Digital customers. The long-term goal of WRL is to aid and accelerate the development of high-performance uni- and multi-processors. The research projects within WRL will address various aspects of high-performance computing.
We believe that significant advances in computer systems do not come from any single technological advance. Technologies, both hardware and software, do not all advance at the same pace. System design is the art of composing systems which use each level of technology in an appropriate balance. A major advance in overall system performance will require reexamination of all aspects of the system.
We do work in the design, fabrication and packaging of hardware; language processing and scaling issues in system software design; and the exploration of new applications areas that are opening up with the advent of higher performance systems. Researchers at WRL cooperate closely and move freely among the various levels of system design. This allows us to explore a wide range of tradeoffs to meet system goals.
We publish the results of our work in a variety of journals, conferences, research reports, and technical notes. This document is a research report. Research reports are normally accounts of completed research and may include material from earlier technical notes. We use technical notes for rapid distribution of technical material; usually this represents research in progress.
Research reports and technical notes may be ordered from us. You may mail your order to:
Technical Report Distribution
DEC Western Research Laboratory, WRL-2 250 University Avenue
Palo Alto, California 94301 USA
Reports and technical notes may also be ordered by electronic mail. Use one of the fol-lowing addresses:
Digital E-net: JOVE::WRL-TECHREPORTS
Internet: [email protected]
UUCP: decpa!wrl-techreports
To obtain more details on ordering by electronic mail, send a message to one of these addresses with the word ‘‘help’’ in the Subject line; you will receive detailed instruc-tions.
Reports and technical notes may also be accessed via the World Wide Web:
under realistic loads
Gaurav Banga
[email protected]
Department of Computer Science, Rice University,
Houston, TX, 77005
Jeffrey C. Mogul
[email protected]
Compaq Computer Corp. Western Research Lab.,
250 University Ave., Palo Alto, CA, 94301
October 13, 1998
Abstract
UNIX Internet servers with an event-driven architecture often perform poorly under real work-loads, even if they perform well under laboratory benchmarking conditions. We investigated the poor performance of event-driven servers. We found that the delays typical in wide-area networks cause busy servers to manage a large number of simultaneous connections. We also observed that the select system call implementation in most UNIX kernels scales poorly with the number of connections being managed by a process. The UNIX algorithm for allocating file descriptors also scales poorly. These algorithmic problems lead directly to the poor performance of event-driven servers.
We implemented scalable versions of the select system call and the descriptor allocation al-gorithm. This led to an improvement of up to 58% in Web proxy and Web server throughput, and dramatically improved the scalability of the system.
This is an expanded version of a paper that appeared in the Proceedings of the 1998 USENIX Annual Technical
Contents
1 Introduction 1
2 Background 2
2.1 Event-driven servers . . . 2
2.2 select() . . . 2
2.3 ufalloc() . . . 3
3 Problems in select() and ufalloc() 4 4 Scalable select() and ufalloc() 7 4.1 select() . . . 7
4.2 ufalloc() . . . 8
5 Experimental Evaluation 10 5.1 Scalability with respect to connection rate . . . 10
5.2 Scalability with respect to connection count . . . 15
6 Performance of a live system 15 6.1 NetCache configuration . . . 16
6.2 Effect of request rate on CPU load . . . 17
6.3 Profile results . . . 19
6.4 Data cache effects . . . 22
6.5 Performance with caching enabled . . . 22
6.6 Performance with Squid proxy . . . 28
6.7 Summary of live performance results . . . 35
7 Related Work 36
List of Figures
1 select()costs in unmodified kernel . . . 5
2 Two-level ufalloc bitmap . . . 9
3 Squid response times – 1259-byte files . . . 10
4 Squid idle time – 1259-byte files . . . 10
5 Squid response times – 8KB files . . . 11
6 Squid idle time – 8KB files . . . 11
7 CPU share of ufalloc() and select(), Squid Proxy – 1259-byte files . . . 12
8 Response time for thttpd . . . 14
9 Performance of Squid Proxy – Scalability . . . 15
10 CPU costs as a function of request rate: NetCache, caching disabled . . . 16
11 View of short-term request rates, with and without caching . . . 23
12 CPU costs as a function of request rate: NetCache, caching enabled . . . 24
13 CPU costs as a function of request rate: Squid 1.1.20Mod . . . 31
14 Breakdown of kernelselect()costs for NetCache and Squid . . . 34
List of Tables
1 Example profile for unmodified kernel . . . 62 Example profile for modified kernel . . . 13
3 Statistics for NetCache live tests, caching disabled . . . 17
4 Linear regressions: full 1-day data sets: NetCache, caching disabled . . . 18
5 Linear regressions: above 20 requests/second, NetCache, caching disabled . . . 18
6 Profile of unmodified kernel on live proxy: NetCache, caching disabled . . . 20
7 Profile of modified kernel on live proxy: NetCache, caching disabled . . . 21
8 Statistics for live tests: NetCache, caching enabled . . . 23
9 Linear regressions: full 1-day data sets: NetCache, caching enabled . . . 25
10 Profile of unmodified kernel on live proxy: NetCache, caching enabled . . . 26
11 Profile of modified kernel on live proxy: NetCache, caching enabled . . . 27
12 Profile of modified kernel on live proxy: Squid 1.1.20 . . . 29
13 Profile of modified kernel on live proxy: Squid 1.1.20Mod . . . 30
14 Statistics for live tests: Squid 1.1.20Mod . . . 31
15 Linear regressions: full 1-day data sets: Squid 1.1.20Mod . . . 32
1
Introduction
Many Web servers and proxies are implemented as as single-threaded event-driven processes. This approach is motivated by the belief that an event-driven architecture has some advantages over a thread-per-connection architecture [Ous96], and that it is more efficient than process-per-connection designs, including “pre-forked” process-per-process-per-connection systems. In particular, event-driven servers have lower context-switching and synchronization overhead, especially in the con-text of single-processor machines.
Unfortunately, event-driven servers have been observed to perform poorly under real conditions. In a recent study of Digital' s Palo Alto Web proxies, Maltzahn et. al. [MRG97] found that the Squid (formerly Harvest) proxy server[CDN+
96, Squ] performs no better than the older CERN proxy[LNBL96]. This is surprising, because the CERN proxy forks a new process to handle each new connection, and process creation is a moderately expensive operation. This result is also in sharp contrast with the study by Chankhunthod et al.[CDN+
96], which concluded that Harvest is an order of magnitude faster than the CERN proxy.
Maltzahn et. al. [MRG97] attribute Squid' s poor performance to the amount of CPU time Squid uses to implement its own memory management and non-blocking network I/O abstractions. We investigated this phenomenon in more detail, and found out that the large delays typical of wide-area networks (WANs) cause Squid to have a large number of simultaneously open connections. Unfortunately, the traditional UNIX implementations of several kernel features used by event-driven single-process servers do not scale well with the number of active descriptors in a process. These are the select system call, used to support non-blocking I/O, and the kernel routine that allocates a new file descriptor. (We refer to the descriptor-allocation routine as ufalloc(), as it is named in Digital UNIX, although other UNIX variants use different names, e.g., fdalloc().) A system running the Squid server spends a large fraction of its time in these kernel routines, which is directly responsible for Squid' s poor performance under real workloads.
We designed and implemented scalable versions of select() and ufalloc() in Digital UNIX, and evaluated the performance of Squid and an event-driven Web server in a simulated WAN environment. We observed throughput improvements of up to 43% for the Web server, and up to 58% for Squid. We observed dramatic reductions in CPU utilizations at lower loads. We also evaluated these changes on a busy HTTP proxy server, which handles several million requests per day.
covers related work and and offers some conclusions.
2
Background
In this section we present a brief overview of the working of a typical event-driven server. We will also describe classical implementations ofselect()andufalloc(). This will provide necessary background for the discussion in the following sections.
2.1
Event-driven servers
An event-driven server typically has a single thread which manages all connections to the server. The thread uses theselect()system call to simultaneously wait for events on these connections.
When a call toselect() returns, the server' s main loop invokes event handlers for each of the ready descriptors. These handlers perform a variety of tasks depending on the nature of the partic-ular event. For example, when a socket being used to listen for new connections becomes ready, the corresponding handler callsaccept()to return a file descriptor for the new connection. Hand-lers invoked when a connection becomes ready for reading or writing perform the actual read or write to the appropriate descriptor. The execution of handlers may cause the addition or removal of descriptors from the set being managed by the server.
Event-driven servers are fast because they have no locking or context switching overhead. The same thread manages all connections, and all handlers are executed synchronously. A single-threaded server, however, cannot exploit any true concurrency in the stream of tasks. Thus, on multiprocessor systems, event-driven servers have as many threads as processors. Examples of event-driven servers include Squid[CDN+
96, Squ] and its commercial version NetCache[Net], Zeus[Zeu], thttpd[tht] and several research servers[BDR97, KEGW96, PDZ97].
2.2
select()
The select system call allows a user process to wait for events on a set of descriptors. A process can indicate interest in three types of events on a descriptor: events that make a descriptor readable, those that make it writable, and exception events. This information is passed to the kernel using three bitmaps. In each bitmap the kth bit indicates interest in events of that type for the kth
descriptor. These bitmaps are value-result parameters, and the returned bitmaps indicate the sets of ready descriptors. Stevens[Ste90] describes theselect()interface in detail.
related to the multithreaded nature of the Digital UNIX kernel. Thus our discussion is fully ap-plicable to 4.3BSD and most BSD-derived implementations. Also, we discuss howselect()works for descriptors that represent sockets, but our discussion and algorithms can be trivially extended to include descriptors that refer to other kinds of objects, such as vnodes. (Vnodes are kernel data structures used to represent files and devices.)
In Digital UNIX, the select() function in the kernel starts by creating internal data structures containing summary information about sockets that are marked in at least one input bitmap. Sub-sequently,select()callsdo scan(), which callsselscan()to check the status of each of the entities (vnodes or sockets) corresponding to the selected descriptors.
For each selected socket, selscan() enqueues a record referring to the current thread on the
select queue of the socket. This is done so that the thread can be identified as waiting inside
select()for events on the socket.selscan()then callssoo select()for each socket, which checks to see if the condition that the process is interested in (i.e. the socket is readable, writable, or has pending exceptions) is true. If none of the conditions that the user process is selecting on are true, thendo scan()goes to sleep waiting for any of these to become true.
Note that the linear search inselscan()covers every socket of potential interest to the selecting process, independent of how many are actually ready. Thus, the cost is proportional to the number of file descriptors involved in the call toselect(), rather than to the number of events discovered by the call.
When a network packet comes in, protocol processing may cause a condition on whichdo scan() is blocked to become true. The thread that performs protocol processing for an incoming packet calls select wakeup(), which wakes up all threads that are blocked indo scan() awaiting this condition.
A thread that is woken up indo scan() callsselscan(), which calls soo select()for all the sockets that the corresponding call toselect()specified in its three bitmaps. do scan()also calls undo scan()to remove this thread from select queues of the selected sockets.
2.3
ufalloc()
The kernel functionufalloc()is called to allocate a new file descriptor for a process. This function is called as a result of the open(),socket(),socketpair(), dup(),dup2() and accept()system calls.
cost of this search is roughly proportional to the number of open file descriptors, although it might complete before checking all of the possible descriptor table slots.
3
Problems in select() and ufalloc()
As we observed in section 1, Maltzahn et. al. [MRG97] found that the Squid proxy server per-forms no better than the older CERN proxy under real workloads, contradicting the study by Chankhunthod et al.[CDN+
96], which concluded that Harvest is an order of magnitude faster than the CERN proxy. Indeed, a simple LAN-based experiment using a simulated client load does show a big performance difference between Squid and the CERN proxy.
In an attempt to explain this peculiar result, we tried to understand why Squid' s performance under real load is so much worse than under ideal conditions. One factor that is different in the two scenarios is that under real load Squid manages a much larger number of simultaneous connections than in a LAN-based test scenario. This is because of much larger delays experienced in WANs. Because WAN environments have larger round-trip times (RTTs), and are more likely to exhibit packet losses, HTTP connections tend to last much longer in WAN environments than in simple LAN environments. Therefore, for a given connection arrival rate, a WAN-based HTTP server will have more open connections than a server in a LAN environment.
Richardson' s measurements of Digital' s Palo Alto Web proxies [Ric97] show between 30 and 950 simultaneously open connections, depending on time of day. Richardson' s measurements also show that while the median response time is about 250 msec., the mean is 2.5 seconds: some connections stay open for a very long time. The large ratio of mean to median holds over a wide range of response sizes (although the 10:1 ratio only holds when all response sizes are considered together). This implies that at any given time, most of the open connections are cold (idle for long intervals), and only a few are hot.
Following this intuition, we tried to evaluate the effect of a large number of cold connections on Squid performance. We used DCPI [AB+
97] to profile a system running the Squid proxy under a carefully designed request load. To simulate the effect of large WAN delays, we set up a dummy HTTP client process on a client machine. This process opened a large number (100-2000) of connections to the Squid server but subsequently made no requests on these connections. We refer to this process as the load-adding client. Another process on the client machine simulated a small number (10-50) of HTTP clients, which repeatedly made HTTP requests of the proxy. Each request retrieved a 1259-byte response. We used the scalable client (S-Client) architecture from Banga and Druschel [BD97].
12.3) equipped with 192MB of physical memory. The server operating system was Digital UNIX 4.0B, with the latest patches that were available at the time. The client machine was a 333Mhz AlphaStation 500 (same cache configuration as above, SPECint95 9.82) with 640MB of physical memory, running DUNIX 3.2C. The Squid version used was Squid-1.1.11. The client and server were connected using a 100Mbps FDDI network.
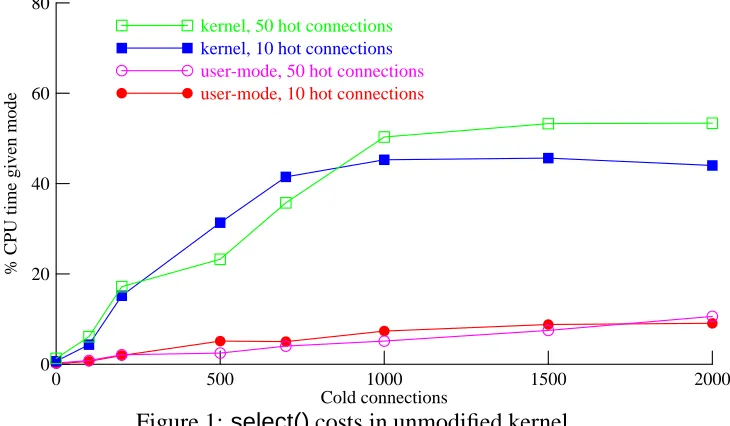
This experiment indicates that up to 53% of the system' s CPU time is being spent insideselect() (and its various components –selscan(), soo select(),etc.). Up to 11% of the CPU is being spent by the user process in collating information from the bitmaps returned byselect().
Our detailed results are shown in Figure 1. The x-axis represents the number of cold connections. Curves are plotted, for both 10 hot connections and 50 hot connections, showing the percentage of CPU time spent in kernel-mode functions related toselect(), and the percentage of CPU time spent in the user-modeselect()loop.
0 500 1000 1500 2000
Cold connections 0
80
20 40 60
% CPU time given mode
user-mode, 10 hot connections
user-mode, 50 hot connections
kernel, 10 hot connections
[image:10.612.130.495.332.545.2]kernel, 50 hot connections
Figure 1: select()costs in unmodified kernel
Figure 1 shows that the costs of both the kernel select() implementation and the user-mode select()loop rise significantly with increasing numbers of cold connections. Also, these costs are relatively independent of the number of hot connections, up to about 1000 cold connections.
amortized over a larger number of interesting events. Thus, the total CPU cost ofselect(), which is proportional to the number ofselect()s per second times the cost of eachselect, tends to level off.
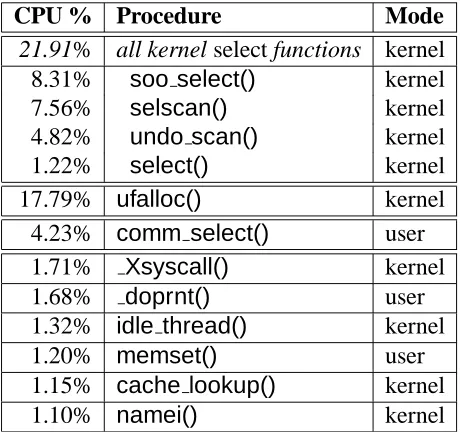
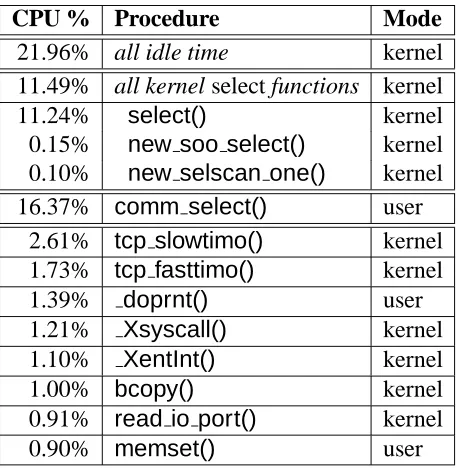
These numbers were generated with a request load of about 100 requests/second. At higher rates, select()is still important, butufalloc()also consumes significant CPU time, because of its linear search algorithm. A typical DCPI profile for the system above, with 750 cold connections, 50 hot connections, and 220 new connections/second, is shown in Table 1.
CPU % Procedure Mode
21.91% all kernel select functions kernel 8.31% soo select() kernel
7.56% selscan() kernel
4.82% undo scan() kernel
1.22% select() kernel
17.79% ufalloc() kernel
4.23% comm select() user 1.71% Xsyscall() kernel
1.68% doprnt() user
1.32% idle thread() kernel
1.20% memset() user
1.15% cache lookup() kernel
1.10% namei() kernel
[image:11.612.190.420.273.489.2]750 cold connections, 50 hot connections, 220 requests/second
Table 1: Example profile for unmodified kernel
4
Scalable select() and ufalloc()
In this section we describe our design for scalable versions of select() and ufalloc(). We also describe our prototype implementation of these designs in Digital UNIX.
4.1
select()
Consider an event-driven server process waiting for activity on any of a few thousand sockets. Recall from Section 2 thatselect()always performs a full scan through all of these sockets, either to find those few that are currently ready, or to indicate that a thread is waiting for events on each of the sockets.
A full scan is also performed after the protocol code processes an incoming packet and calls se-lect wakeup()to unblock a thread waiting insideselect(). The full scan is performed even though only a few of the sockets are actually ready. This wasted effort is expended because, between the call to select wakeup()and the invocation ofdo scan(), we throw away the information about the identity of the socket that has become ready.selscan()then does a significant amount of work to rediscover the set of ready sockets.
The key idea of our design is to preserve information about the change in the state of a socket betweenselect wakeup()anddo scan(). We use this information to prune both the initial scan, and the scan after theselect wakeup(), to inspect only those sockets that need inspection. These are the sockets either about which we have no prior information, or for which we have state-change hints from the protocol-processing layer.
Each call toselect() specifies a SELECTING set for the thread, which is used to compute the new values of the READY and INTERESTED sets. select()uses the HINTS and READY sets to prune its initial scan. It checks only those sockets which are in the SELECTING set and either:
1. are not in the old INTERESTED set, or 2. are in the old READY set, or
3. are in the HINTS set
Mathematically, we can express the computation of these sets as:
INTERESTED new
=SELECTING[INTERESTED old
READ Y new
=C(INTERESTED new
\(INTERESTED old
[READ Y old
[HINTS))
whereC expresses the computation of checking the status of descriptors in its argument set.
The computation ofC' s argument set above appears to have complexity proportional to the size
of the SELECTING set. We took care to optimize this computation and its data-cache footprint. The resulting code has a very small cost relative to other parts ofselect().
The set returned fromselect()is:
READ Y to user
=SELECTING\READ Y new
A descriptor must be removed from the INTERESTED sets of all threads in a process at some point between the time that the descriptor is closed and the time that it is next allocated by any thread in the process.
For each socket, we record the set of processes that have a reference to the socket. In the protocol processing code, when a packet comes in for a socket,sowakeup()records a hint in the HINTS sets of each of the threads in the referencing processes for which this socket is present in the INTERESTED set of the thread. sowakeup()also wakes up all such threads that are blocked inselect(). After a thread is woken up inselect(), it scans only those sockets in its HINTS set.
4.2
ufalloc()
0
0
1
1
0
1
2
3
1
1
1
1
4
5
6
7
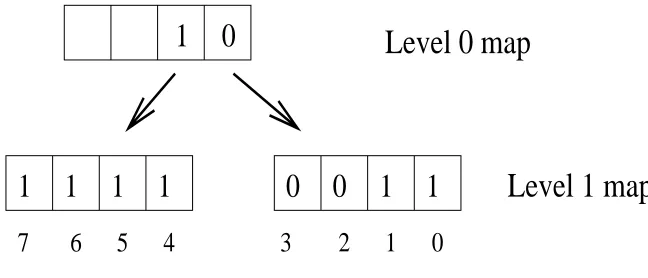
Level 0 map
Level 1 map
[image:14.612.142.466.158.297.2]0
1
Figure 2: Two-level ufalloc bitmap
single bitmap; each bit in this bitmap describes the allocation state of one file descriptor. One-valued bits in this bitmap correspond to allocated descriptors. The level-1 bitmap is stored as an array of nodes.
Each bit in the level-0 bitmap describes the state of an entire level-1 node. One-valued bits in this bitmap correspond to level-1 nodes with no zero bits; a zero-valued bit in the level-0 bitmap corresponds to a level-1 node with at least one zero bit.
Figure 2 shows an example of such a tree. For simplicity, this figure depicts the nodes as 4-bit integers, although our actual implementation uses 64-bit integers. We use the Alpha' s little-endian bit-order in this example. The example tree shows that descriptors 0, 1, and 4 through 7 are allocated, while descriptors 2 and 3 are free.
When a process wants to allocate a new file descriptor, the level-0 bitmap is searched for the first zero bit. The index of this bit is used as an index into the array of level-1 nodes, and the indexed node is then searched to find the first zero bit. Efficient algorithms exist for finding the first zero bit in a word, but we have found that a simple linear search is sufficiently fast, since the dominant cost on modern CPUs is the number of data-cache misses, not the number of instructions executed. When a descriptor is deallocated, the appropriate bits are cleared in both bitmaps. This leads to a constant-time cost for deallocation.
0 200 400 600 800 Requests per second
0 70
10 20 30 40 50 60
Response time (msec)
Old ufalloc, old select
New ufalloc, old select
New ufalloc, new select
[image:15.612.84.303.141.324.2]Naive benchmark
Figure 3: Squid response times – 1259-byte files
0 200 400 600 800
Requests per second 0
70
10 20 30 40 50 60
% CPU idle time
Old ufalloc, old select
New ufalloc, old select
New ufalloc, new select
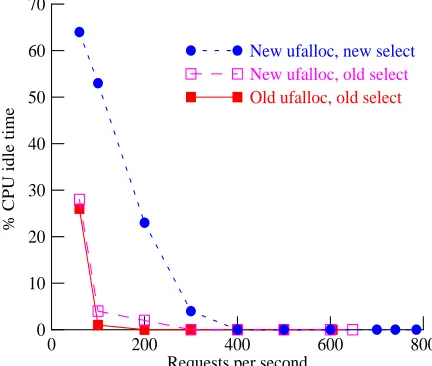
Figure 4: Squid idle time – 1259-byte files
5
Experimental Evaluation
We evaluated the effects of our implementation ofselect()andufalloc()on the performance of two event-driven Internet servers: the Squid proxy, and the thttpd [tht] Web server (we used a modified version of thttpd with numerous performance improvements [PDZ97]). These experiments were performed using the same server and client systems describe in Section 3. We also measured the effect of our changes on the performance of Digital' s Palo Alto proxies.
5.1
Scalability with respect to connection rate
The S-Client architecture introduced by Banga and Druschel [BD97] allows the generation of high HTTP request rates, using a small number of client machines. We used S-Clients to vary the load on the server. At the lowest load, the server is underutilized; at the higher loads, the server is the bottleneck.
For each request rate, we ran two kinds of benchmarks. In the naive benchmark, we used only enough S-Clients to generate the desired request rate. In the more realistic benchmark, we also used a load-adding client, to simulate the presence of long-delay connections. The load-adding client was run with 750 infinitely slow connections. (We show the effect of varying the number of slow connections in Section 5.2.)
[image:15.612.323.539.144.327.2]for the Web. In other experiments, we used a 1259-byte file; the shorter file size places more emphasis on per-connection overheads.
For our experiments using the Squid proxy server, we arranged things so that each request re-ceived by the proxy would generate an “If-Modified-Since” message from the proxy to the origin server, but the actual data would be served from the proxy' s cache. The origin server ran on identical hardware (a 400Mhz AlphaStation 500), using the thttpd server program; we ensured that the origin server was never the bottleneck.
[image:16.612.87.541.443.649.2]Figure 3 shows how the response time of the Squid proxy varies with request rate, for 1259-byte files. The results for all kernels on the naive benchmark are effectively identical; for the realistic benchmark, we plot different curves for the different kernels. For each curve, the final point shows the “saturation throughput” for the given kernel; beyond this point, increasing the offered load did not increase throughput. This figure clearly shows that the presence of adding slow connections in the realistic benchmark drastically reduces the throughput achieved with the unmodified kernel relative to the naive benchmark. It also shows that our new implementations ofselect()andufalloc()solve this performance problem. The performance of the fully modified kernel is nearly independent of the presence of many slow connections.
Figure 4 shows the effect of the new versions ofselect()andufalloc()on server CPU idle time, also for 1259-byte files. At lower request rates, where the server is underutilized, our modifica-tions greatly increase idle time for the realistic benchmark. The increase in idle time reflects the improved scalability of the system in the presence of cold connections.
0 100 200 300 400 500 600
Requests per second 0
80
20 40 60
Response time (msec)
Old ufalloc, old select
New ufalloc, old select
New ufalloc, new select
Naive benchmark
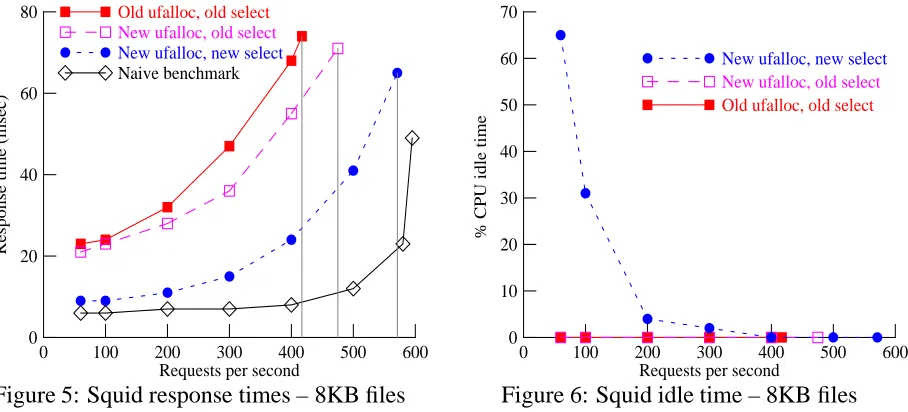
Figure 5: Squid response times – 8KB files
0 100 200 300 400 500 600
Requests per second 0
70
10 20 30 40 50 60
% CPU idle time
Old ufalloc, old select
New ufalloc, old select
New ufalloc, new select
Figure 6: Squid idle time – 8KB files
fully modified kernel provides a higher saturation request rate than the original kernel, and yields lower response times at all request rates. However, the new kernel' s performance on the realistic benchmark does not come quite as close to the performance of the naive benchmark; this may be due to data-cache collisions between the larger packets and the kernel' s data structures. In these tests, as Figure 6 shows, the unmodified kernel showed no idle time for all request rates, while the new kernel showed some idle time up to 300 requests/sec.
0 100 200 300 400 500 600 700 800 900 1000
Requests per second 0
100
20 40 60 80
% CPU time
other
other select
ufalloc
[image:17.612.95.529.243.469.2]ufalloc old select new ufalloc/ new ufalloc/ new select
Figure 7: CPU share of ufalloc() and select(), Squid Proxy – 1259-byte files
We used DCPI to obtain CPU time profiles of the server. Figure 7 shows the fraction of CPU time used inselect()and inufalloc(), for various request rates, using 1259-byte files. (The results for tests using 8192-byte files are analogous.) In each group of three bars, the leftmost bar represents the unmodified kernel, the center bar represents the kernel with the newselect(), and the rightmost bar represents the kernel with new versions of both select() and ufalloc(). At rates above 600 requests per second, each bar is independently labelled. The top section of each bar shows the CPU time spent inufalloc(), and the middle section shows the CPU time spent in select(). The bottom section of each bar (“others”) shows the CPU time used for all other components of the server, including user-mode code. Idle time is not shown; it corresponds to the space above the bar, if any.
When the server is underutilized, at rates below about 200 requests per second, the CPU pro-files show that the newselect()provides an additional performance impact: although we have not changed the implementation of any code covered by the “others” part of the profile, and the total throughput has not changed, the CPU costs of the “others” components has been reduced, relative to the unmodified kernel. We attribute this to better data-cache behavior, because the newselect() has a much smaller data-cache footprint than the original implementation. The modifiedufalloc() may also have a similar effect on cache performance. The improved data-cache footprint of se-lect()is probably responsible for some of the throughput gains in the server-bound configurations.
CPU % Procedure Mode
21.96% all idle time kernel 11.49% all kernel select functions kernel
11.24% select() kernel
0.15% new soo select() kernel 0.10% new selscan one() kernel 16.37% comm select() user
2.61% tcp slowtimo() kernel 1.73% tcp fasttimo() kernel
1.39% doprnt() user
1.21% Xsyscall() kernel
1.10% XentInt() kernel
1.00% bcopy() kernel
0.91% read io port() kernel
0.90% memset() user
[image:18.612.191.420.287.521.2]750 cold connections, 50 hot connections, 220 requests/second
Table 2: Example profile for modified kernel
its input bitmaps, thus requiring additional user-mode work to create these bitmaps on each call. These costs cannot be eliminated with the current interface. In a separate publication [BDM98], we propose a new, scalable interface to replaceselect().
Table 2 shows a profile of the modified kernel, made under the same conditions as the profile of the original kernel shown in Table 1. The new kernel spends 22% of the time in the idle loop, compared to almost no idle time for the original kernel. The original kernel spent about 22% of the CPU inselect()and its subroutines, and 18% of the CPU inufalloc(). The modified kernel spends 11% of the CPU inselect(), and virtually none inufalloc(). However, the busiest function in the system is now the user-levelcomm select()function, using 16% of the CPU. The almost 28% of the CPU together consumed by the kernelselect()and user-modecomm select()functions is a result of the poorly scaling bitmap-basedselect()programming interface.
0 400 800 1200 1600 2000 2400 2800
Requests per second 0 35 5 10 15 20 25 30
Response time (msec)
Unmodified kernel
New ufalloc, old select
New kernel
Naive benchmark
1259-byte files
0 200 400 600 800 1000
Requests per second 0 70 10 20 30 40 50 60
Response time (msec)
Unmodified kernel
New ufalloc, old select
New kernel
Naive benchmark
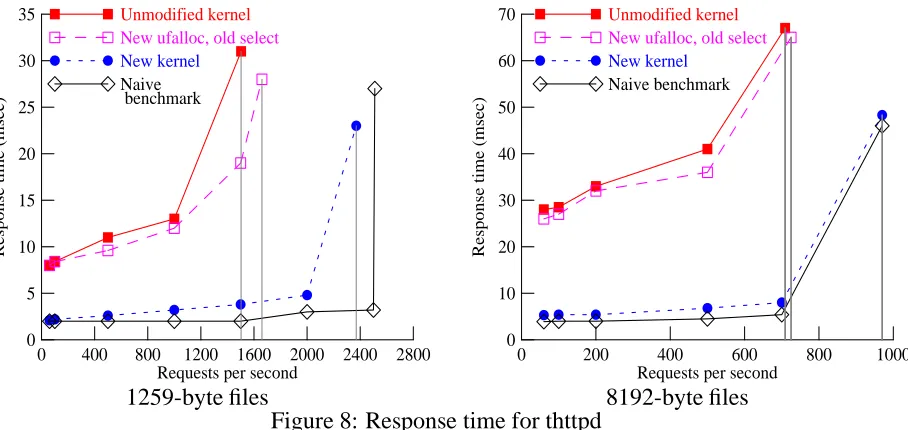
[image:19.612.88.542.312.527.2]8192-byte files Figure 8: Response time for thttpd
5.2
Scalability with respect to connection count
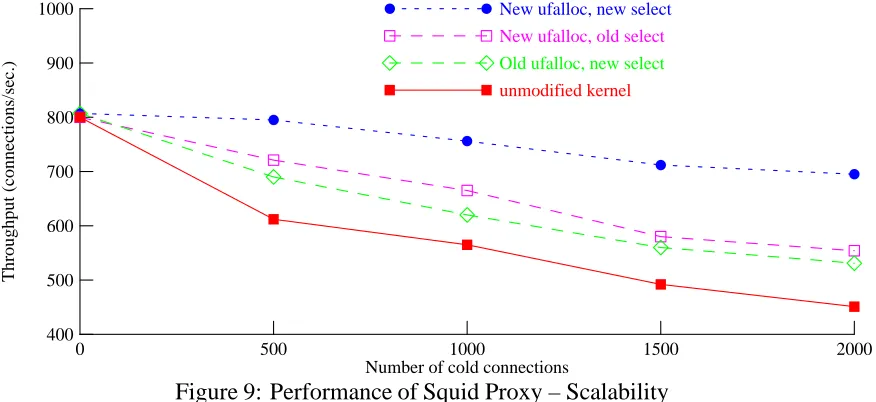
To demonstrate that our implementations ofselect()andufalloc(), unlike the original code, does scale well as the number of cold connections increases, we performed another series of experi-ments. In these experiments, we varied the number of connections from the load-adding client, between 0 and 2000 connections, and then increased the request rate until the server was saturated.
0 500 1000 1500 2000
Number of cold connections 400
1000
500 600 700 800 900
Throughput (connections/sec.)
New ufalloc, new select
New ufalloc, old select Old ufalloc, new select
unmodified kernel
[image:20.612.95.533.236.437.2]Figure 9: Performance of Squid Proxy – Scalability
Figure 9 shows that the throughput of the original kernel drops by 44% as the number of of cold connections increases from zero to 2000. The figure also shows that the kernel with our scalable ufalloc() has a somewhat smaller dependency on the number of cold connections, and for the kernel with our implementations of bothselect()andufalloc(), its throughput drops by only 14% over the same range. We believe that the remaining dependency results from the user-level costs of the programming interface forselect().
6
Performance of a live system
Digital Equipment Corporation operates a Web proxy system, in Palo Alto, California, that serves a large fraction of Digital' s internal users. During a typical weekday, the system handles as many as 2.6 million HTTP requests, from at least 5570 individual client hosts.
0 10 20 30 40 50 60 Mean requests/second
0 100
20 40 60 80
CPU % in given mode
Idle, old
Kernel, old
Idle, new
[image:21.612.91.530.145.345.2]Kernel, new
Figure 10: CPU costs as a function of request rate: NetCache, caching disabled
either the unmodified kernel or our modified kernel, each for an entire calendar day (midnight to midnight, Pacific Time), and collected extensive monitoring information.
We ran trials both using Squid, and using the NetCache proxy [Net] from Network Appliance, Inc. The NetCache trials are described first, in sections 6.1 through 6.5. The Squid trials are described starting in section 6.6.
6.1
NetCache configuration
For the trials using NetCache, we used version 3.1.2c-OSF of the NetCache software. Like Squid, NetCache was based on the Harvest Cache software, although NetCache and Squid have since evolved separately. Because caching tends to reduce the number of simultaneous network connec-tions, during our first set of trials we operated this software with caching disabled. For various reasons, this does not significantly increase response time as seen by the users. In Section 6.5, we show results for the NetCache server with caching enabled.
Date Kernel Requests Max. Peak version handled alloc. req. fds rate
1998-04-16 old 2581113 107
[image:22.612.179.433.159.236.2]1998-04-23 new 2602448 755 116 Table 3: Statistics for NetCache live tests, caching disabled
6.2
Effect of request rate on CPU load
The operating system maintains counts of the number of clock interrupts that occur in each system mode (user-mode, kernel-mode, and idle). During the course of each trial, we logged these counters every 15 minutes, which allowed us to reconstruct the mean time spent in each mode during the 15 minutes prior to each log entry. The proxy software creates a timestamped log entry for each HTTP request it receives, so we can also count the number of requests handled in each 15 minute period, and then compute the mean request rate over that period.
Figure 10 shows how CPU idle time, and CPU kernel-mode time, vary as a function of the mean request rate. Each point on the scatterplot represents one 15-minute sample. The circles correspond to idle time; the squares correspond to kernel-mode time. The filled marks show performance with the old versions of bothselect()andufalloc()(the trial of 1998-04-16). The open marks show the performance of the new implementations (the trial of 1998-04-23).
We then computed linear regressions for each set of samples. The regression lines are shown in Figure 10; the numeric results are given in Table 4. (User-mode regressions are given in the table, but not shown in the figure.) Each sample set includes 96 points (24 hours of 15-minute samples). The correlation between kernel-mode time and request rate is quite close; the correlation for idle time is not quite as good, probably because of some outliers caused by daily “housekeeping” tasks done during periods of low request rate. Because the outliers all occur at low request rates (that is, late at night), we recalculated the regressions after excluding samples taken at rates below 20 requests/second. These regressions, shown in Table 5, show higher correlation coefficients for idle time and user-mode time.
The regressions for idle time and kernel-mode time show significantly steeper slopes for the unmodified kernel, compared to those for the new implementations ofselect()andufalloc(). The regressions for user-mode time suggest that the new kernel performs slightly better, perhaps be-cause of better data-cache utilization, but the difference might not be significant.
Date Kernel CPU Slope Corr. version mode coeff.
1998-04-16 old idle -1.67 -0.96 1998-04-23 new idle -1.34 -0.92 1998-04-16 old kernel 1.09 0.98 1998-04-23 new kernel 0.85 0.99 1998-04-16 old user 0.58 0.77 1998-04-23 new user 0.49 0.66
[image:23.612.183.424.195.342.2]N = 96
Table 4: Linear regressions: full 1-day data sets: NetCache, caching disabled
Date Kernel CPU Slope Corr. version mode coeff.
1998-04-16 old idle -1.69 -0.97 1998-04-23 new idle -1.46 -0.98 1998-04-16 old kernel 1.02 0.96 1998-04-23 new kernel 0.85 0.99 1998-04-16 old user 0.68 0.97 1998-04-23 new user 0.65 0.99
N = 54
[image:23.612.183.425.466.613.2]the unmodified kernel, and 69 requests/sec. for the new implementation. Using the truncated data sets (Table 5), the calculated X-intercepts are 57 and 68 requests/sec., respectively. This suggests that the modified kernel might support a peak request rate about 19% higher than the unmodified kernel, in this application. However, we caution against using the X-intercept to predict the actual peak request rate, since in other trials (see, for example, Figure 12) we found that the system can indeed process requests at mean rates above the X-intercept.
Note that our samples were averaged over 15-minute intervals. The actual one-second peak rates experienced during these trials (see Table 3) were 107 requests/sec. for the unmodified kernel, and 116 requests/sec. for the modified kernel. Clearly, the systems can support rates higher than the extrapolation of idle time implies. The main significance of our performance improvements may be not the increase in peak throughput, but the decrease in queueing delay (and response time) at high throughputs.
6.3
Profile results
We obtained CPU-time profiles, using DCPI, for the proxy server during periods of heavy load, for both the original kernel (Table 6) and our modified kernel (Table 7). Each profile covers a period of exactly one hour. The tables include all procedures accounting for at least 1% of the non-idle CPU time.
The first column in each profile shows the fraction of CPU time spent in each function or group of procedures. As the first row in each table shows, even during periods of heavy load, some time is spent in the kernel' s idle thread and its children. Therefore, the second column shows the fraction of non-idle CPU time spent in all non-idle procedures; this is a more useful basis for comparing the two kernels. Note that the profiles include a mixture of kernel-mode and user-mode procedures.
The modified kernel spends 30% of the non-idle CPU time inselect()and related procedures, compared to almost 40% spent in such procedures by the unmodified kernel. However, kernel-mode select() processing is still a significant burden on the CPU. As in Figure 2, considerable time is spent in the user-mode commSelect() procedure (Squid and NetCache apparently use slightly different names for the same procedure). These observations support our belief that the bitmap-basedselect()programming interface leads to unnecessary work, and probably to signific-ant capacity misses in the data caches.
In experiments with simulated loads, we observed that NetCache on our kernel calls select() about 7 times as it does on the unmodified kernel. We believe this is because our fasterselect() causes a NetCache thread to return fromselect()with usually only one ready descriptor1
. Before
1
CPU % Non-idle Procedure Mode CPU %
10.77% all idle time kernel 89.23% 100.00% all non-idle time kernel 35.27% 39.53% all select functions kernel 13.51% 15.14% selscan kernel 12.56% 14.08% soo select kernel 7.48% 8.38% undo scan kernel
1.64% 1.83% select kernel
12.64% 14.17% commSelect user 1.74% 1.95% all TCP functions kernel 1.49% 1.67% malloc-related #1 user 1.39% 1.56% malloc-related #2 user 1.09% 1.22% mutex unblock user 1.03% 1.16% read io port kernel
0.95% 1.07% bcopy kernel
0.94% 1.05% memGrep user
Profile on 1998-04-16 from 10:00 to 11:00 PDT mean load = 54 requests/sec.
[image:25.612.180.431.248.534.2]peak load ca. 98 requests/sec
CPU % Non-idle Procedure Mode CPU %
16.29% all idle time kernel 83.71% 100.00% all non-idle time kernel 25.11% 30.00% all select functions kernel 11.23% 13.42% new soo select kernel 7.73% 9.24% new selscan one kernel
5.67% 6.77% select kernel
0.04% 0.05% new undo scan kernel 15.33% 18.32% commSelect user
2.70% 3.23% all TCP functions kernel 2.56% 3.05% in pcblookup kernel 1.09% 1.30% mutex unblock user
1.01% 1.21% bcopy kernel
1.00% 1.19% read io port kernel 0.97% 1.16% malloc-related #1 user
0.93% 1.12% memGrep user
0.91% 1.09% malloc-related #2 user Profile on 1998-04-23 from 10:00 to 11:00 PDT
[image:26.612.174.436.240.535.2]mean load = 55 requests/sec. peak load ca. 116 requests/sec
the next event arrives, other NetCache threads callselect()to discover this event again. In the un-modified kernel, each call toselect()takes longer, and returns multiple events. This may account for the heavy use ofselect()in Table 7.
In this application, even the unmodified kernel spends very little time in ufalloc() (0.20%). However, the modified kernel spends even less time inufalloc()(0.03%). For this proxy, the total number of open file descriptors is relatively small. However, one might expect this fraction to become more significant at higher request rates.
We are not entirely sure what caused the significant increase in time that the modified kernel spends inin pcblookup. This may be the result of an unfortunate collision in the direct-mapped data caches.
We note that in this real-world environment, for both versions of the kernel, just over 1% of the non-idle CPU time is spent in all kernel-related data movement (thebcopy()). Even less time is spent computing checksums. A moderate amount of time (between 2% and 3%) is spent in TCP-related functions (which have been highly optimized in Digital UNIX). These measurements reinforce the emphasis placed by Kay and Pasquale[KP93] on “non-data touching processing over-heads”; however, they failed to recognize that the poor scalability of select() would ultimately dominate the other costs.
6.4
Data cache effects
We have speculated in several places that our kernel modifications affect data cache utilization. DCPI allows us to estimate the mean cycles per instruction (CPI) for each procedure in a profile, and to estimate the fraction of dynamic stalls caused by data-cache misses. We found that the CPI for the user-modecommSelect()procedure declined from 1.69 to 1.62 as a result of our kernel changes, mostly because of fewer data-cache misses.
We also found that the CPI forin pcblookup()increased from about 1.28 to 11.15 as an apparent result of our kernel changes, even though we did not change the code for this kernel procedure. This suggests that we somehow created a particularly unlucky collision in the data caches between the data structures forin pcblookup()and those forselect().
6.5
Performance with caching enabled
We ran similar trials using NetCache with caching enabled. Table 8 shows some statistics for each of the trials.
Date Kernel Requests Max. Peak version handled alloc. req. fds rate
1998-05-08 old 1959078 228
[image:28.612.180.433.159.237.2] [image:28.612.97.529.345.547.2]1998-05-05 new 2255685 2380 244 Table 8: Statistics for live tests: NetCache, caching enabled
Figure 11 shows the logged request rate per second, for one second intervals between 11:00:00 and 11:05:00 (PDT) during the trials of 1998-04-23 (caching disabled) and 1998-05-05 (caching enabled). Timestamps for requests are taken from the log entries written by the proxy server, not from external observation.
0 30 60 90 120 150 180 210 240 270 300
Seconds since 11:00:00 0
200
50 100 150
Requests/second
Caching disabled (04-23) Caching enabled (05-05)
Figure 11: View of short-term request rates, with and without caching
From Figure 11, it appears that when caching is enabled, the server is blocking for periods of many seconds, then processing a burst of requests. (It is not clear whether request processing per se is blocking, or whether the delay is actually in the generation of log entries.) When caching is disabled, the request rate is far smoother.
flushed to disk at 30-second intervals. This policy has long been known to be suboptimal [Mog94] (and should be fixed in a future release of Digital UNIX), but the extremely long delay periods experienced in this case suggest that the disk subsystem used for the cache has been improperly configured; it simply cannot absorb all of the random writes being generated. (Although Digital UNIX supports a journaled file system, which should absorb many more writes per second, the proxy was configured to use the traditional “Berkeley Fast File System” for cache storage.)
The increased burstiness of request processing could explain some of the increase in value for the maximum number of allocated file descriptors seen, in Table 8, when caching is enabled. Since some requests are being delayed for long intervals, and since the proxy server can presumably accept new network connections while it is waiting for disk I/O, the maximum number of requests in progress is likely to increase as a result of lengthy disk delays.
The use of caching also directly increases the number of allocated file descriptors, because NetCache stores each cached object in a separate file. Especially during periods of delayed file I/O, the server might have many such files open at once. However, we have not directly measured the number of such descriptors.
0 10 20 30 40 50 60
Mean requests/second 0
100
20 40 60 80
CPU % in given mode
Idle, old
Kernel, old
Idle, new
Kernel, new
[image:29.612.97.530.373.577.2]Figure 12: CPU costs as a function of request rate: NetCache, caching enabled
Date Kernel CPU Slope Corr. version mode coeff.
1998-05-08 old idle -2.31 -0.98 1998-05-05 new idle -1.87 -0.97 1998-05-08 old kernel 1.21 0.98 1998-05-05 new kernel 0.79 0.96 1998-05-08 old user 1.10 0.93 1998-05-05 new user 1.08 0.96
[image:30.612.184.423.157.303.2]N = 96
Table 9: Linear regressions: full 1-day data sets: NetCache, caching enabled
of 1998-05-05).
Compared to Figure 10 (for NetCache with caching disabled), Figure 12 suggests that our kernel changes have a similar effect on CPU time consumption whether or not caching is enabled; this is probably because the caching component of NetCache uses relatively little CPU time. This conclusion is supported by the linear regressions shown in Table 9, but since the use of caching seems to reduce the CPU-time efficiency of the entire system, the slopes are considerably steeper than they are in Table 4 (for NetCache with caching disabled). With our modified kernel and NetCache, the idle-time X-intercept with caching disabled is at 69 requests/sec, but drops to 49 requests/sec when caching is enabled. (Remember that the X-intercept is not a good predictor of the actual peak request rate, as is clear from Figure 12.)
Tables 10 and 11 show DCPI profiles for, respectively, the unmodified and modified kernels, both running NetCache with caching enabled. Again (as for the caching-disabled trials, shown in Tables 6 and 7), the modified kernel results in significantly less time spent in the kernel' sselect() functions. Overall, in these profiles, the caching-enabled systems spend less of their time in these functions than do the caching-disabled systems, perhaps because they sustained lower mean re-quest rates. (The lower rates could be a consequence of lower offered load; they do not necessarily reflect poorer proxy performance.)
CPU % Non-idle Procedure Mode CPU %
35.86% all idle time kernel 64.14% 100.00% all non-idle time kernel 15.74% 24.54% all select functions kernel 6.26% 9.76% selscan kernel 5.19% 8.10% soo select kernel 3.38% 5.27% undo scan kernel
0.86% 1.34% select kernel
10.97% 17.10% commSelect user 1.67% 2.61% pmap zero page kernel 1.20% 1.88% all TCP functions kernel
1.15% 1.79% strcmp user
0.88% 1.37% mutex unblock user
0.86% 1.34% bcopy kernel
0.76% 1.18% read io port kernel
0.70% 1.09% memGrep user
0.69% 1.08% malloc-related #1 user 0.69% 1.07% malloc-related #2 user Profile on 1998-05-08 from 12:00 to 13:00 PDT
[image:31.612.178.432.231.560.2]mean load = 36 requests/sec. peak load ca. 210 requests/sec
CPU % Non-idle Procedure Mode CPU %
48.40% all idle time kernel 51.60% 100.00% all non-idle time kernel 6.34% 12.29% all select functions kernel 2.59% 5.01% new soo select kernel
1.85% 3.59% select kernel
1.52% 2.94% new selscan one kernel 0.01% 0.02% new undo scan kernel 7.20% 13.95% commSelect user 2.16% 4.18% malloc-related #1 user 2.01% 3.89% all TCP functions kernel 1.84% 3.56% malloc-related #2 user 1.52% 2.94% in pcblookup kernel
1.08% 2.10% strcmp user
0.89% 1.72% mutex unblock user
0.86% 1.68% bcopy kernel
0.85% 1.65% malloc-related #3 user 0.79% 1.53% read io port kernel
0.74% 1.43% memset user
0.74% 1.43% memGrep user
0.64% 1.23% tcp slowtimo kernel
0.62% 1.19% memcpy user
0.61% 1.18% malloc-related #1 user
0.58% 1.12% str grep user
Profile on 1998-05-25 from 12:00 to 13:00 PDT mean load = 43 requests/sec.
[image:32.612.174.435.186.594.2]peak load ca. 214 requests/sec
software uses theselect()system call when caching is enabled.
6.6
Performance with Squid proxy
For the trials using Squid, we started with version 1.1.20 of the Squid software. All of our Squid trials were run with caching disabled.
As noted, Squid and NetCache share a common ancestor, and apparently they use similar tech-niques to wait for events. With Squid, we had the advantage of public access to the source code, so we were able to investigate its behavior in greater detail.
We first obtained a DCPI profile of Squid running on our modified kernel, shown in Table 12. Over 30% of the non-idle CPU is spent in the user-modecomm select()function. Note that this is similar to the profile for NetCache, shown in Table 7 (NetCache uses the namecommSelect(), apparently for the same function). In the Squid profile, the effect is more pronounced, although this might be because of the substantially lower request load during this trial.
Using DCPI, we were able to discover the exact reasons whycomm select()was consuming so many cycles. The main problem came from excessive data-cache misses, incurred because before every call toselect(), the procedure walks through an array of large data structures, indexed by file descriptor. This activity not only spends cycles withincomm select(), but also tramples on most or all of the contents of the data cache, resulting in excessive cache misses for other procedures.
A relatively minor modification to the algorithm in comm select() allowed us to eliminate almost all of the cache misses [Mog99]. We also found that the procedure, when scanning the bitmaps returned by select(), was using an inefficient technique; we replaced it by a faster, al-beit somewhat less portable, mechanism. As a result, we eliminated essentially all of the CPU cycles spent incomm select(); see Table 13. Not coincidentally, these changes eliminated a large fraction of the data-cache misses incurred by the entire system, which probably improves the per-formance of other functions as well.
We will refer to this modified Squid as version 1.1.20Mod, and used it for all of our subsequent trials.
The profile for Squid 1.1.20Mod shows that a significant fraction of the user-mode time is now spent in fivemalloc-related functions (due to the malloc()algorithm used in Digital UNIX, it is not possible to disentangle the time spent as a consequence of callingfree().) We elected not to attack this particular issue, because we understand that a forthcoming version of Squid has already greatly reduced its use ofmalloc(), by maintaining its own pools for certain dynamically-allocated data structures.
We then ran full-day trials of Squid 1.1.20Mod with both the unmodified and modified kernels. Table 14 shows statistics for these two trials.
CPU % Non-idle Procedure Mode CPU %
65.80% all idle time kernel 34.20% 100.00% all non-idle time kernel 8.42% 24.63% all select functions kernel
6.20% 18.14% select user
1.21% 3.54% new soo select kernel 0.96% 2.80% new selscan one kernel 0.01% 0.04% new undo scan kernel 10.30% 30.12% comm select user
1.23% 3.60% all TCP functions kernel 1.20% 3.52% malloc-related #1 user 1.12% 3.28% malloc-related #2 user 0.70% 2.05% in pcblookup kernel 0.60% 1.76% malloc-related #3 user 0.45% 1.31% malloc-related #5 user 0.27% 0.79% malloc-related #4 user
0.32% 0.95% bcopy kernel
Profile on 1998-07-16 from 11:00 to 12:00 PDT mean load = 17 requests/sec.
[image:34.612.174.435.241.546.2]peak load ca. 73 requests/sec
CPU % Non-idle Procedure Mode CPU %
65.43% 100.00% all non-idle time kernel 34.57% all idle time kernel 16.02% 24.49% all select functions kernel 9.42% 14.40% select kernel 3.71% 5.67% new soo select kernel 2.82% 4.31% new selscan one kernel 0.03% 0.04% new undo scan kernel 5.37% 8.21% malloc-related #1 user 4.35% 6.64% malloc-related #2 user 4.10% 6.27% in pcblookup kernel 2.93% 4.47% malloc-related #3 user 2.88% 4.40% all TCP functions kernel 1.46% 2.23% malloc-related #5 user 1.34% 2.06% malloc-related #4 user
0.94% 1.44% memCopy user
0.92% 1.41% memset user
0.88% 1.35% bcopy kernel
0.84% 1.28% read io port kernel
0.72% 1.10% doprnt user
0.36% 0.54% comm select user Profile on 1998-09-09 from 11:00 to 12:00 PDT
[image:35.612.174.435.206.582.2]mean load = 56 requests/sec. peak load ca. 131 requests/sec
Date Kernel Requests Max. Peak version handled alloc. req. fds rate
1998-09-15 old 2242373 1581 121
[image:36.612.176.439.207.286.2]1998-09-09 new 2591284 1714 139 Table 14: Statistics for live tests: Squid 1.1.20Mod
0 10 20 30 40 50 60 70
Mean requests/second 0
100
20 40 60 80
CPU % in given mode
Idle, old
Kernel, old
Idle, new
Kernel, new
[image:36.612.98.529.414.615.2]Date Kernel CPU Slope Corr. version mode coeff.
1998-09-15 old idle -1.69 -0.96 1998-09-09 new idle -1.26 -0.92 1998-09-15 old kernel 1.05 0.94 1998-09-09 new kernel 0.73 0.95 1998-09-15 old user 0.64 0.85 1998-09-09 new user 0.54 0.80
[image:37.612.183.423.156.306.2]N = 96
Table 15: Linear regressions: full 1-day data sets: Squid 1.1.20Mod
request rate. Each point on the scatterplot represents one 15-minute sample. The circles correspond to idle time; the squares correspond to kernel-mode time. The filled marks show performance with the old versions of both select() and ufalloc()(the trial of 1998-09-15). The open marks show the performance of the new implementations (the trial of 1998-09-09). The new kernel clearly outperforms the original kernel in these trials. The idle-time X-intercept for the unmodified kernel is 55 requests/sec, while the X-intercept for the modified kernel is 83 requests/sec, an improvement of 51%.
This is a much larger improvement than for NetCache, with or without caching. We suspect that by eliminating the large amount of user-mode CPU time spent in the comm select() function, our modified version of Squid puts more emphasis on the performance of the kernel (and thus on the benefits of a more efficient kernel). Additionally, by eliminating a particularly nasty source of data-cache misses, our changes tocomm select()indirectly improve the performance of other data-intensive functions (such asselect()) by improving their cache-hit rates.
Table 15 show linear regressions for CPU time as a function of request rate, for Squid 1.1.20Mod running on both kernels. The table shows significant improvements in the kernel-mode and idle-time slopes. It also shows a small improvement in the slope of the user-mode regression, perhaps due to reduced data-cache interference between theselect()functions and the user-mode compu-tations.
Table 16 shows a DCPI profile for Squid 1.1.20Mod running on the unmodified kernel. Com-pared to Table 13, the profile for the modified kernel, the unmodified system spends a far larger fraction of the non-idle CPU time in the kernelselect()functions.
CPU % Non-idle Procedure Mode CPU %
89.27% 100.00% all non-idle time kernel 10.73% all idle time kernel 38.96% 43.64% all select functions kernel 13.83% 15.50% soo select kernel 12.33% 13.81% selscan kernel 10.11% 11.32% undo scan kernel
2.51% 2.81% select kernel
5.87% 6.57% malloc-related #1 user 4.51% 5.05% malloc-related #2 user 3.48% 3.89% pmap zero page kernel 3.13% 3.51% malloc-related #3 user
1.68% 1.88% memCopy user
1.53% 1.72% malloc-related #5 user 1.46% 1.64% all TCP functions kernel 1.28% 1.43% malloc-related #4 user
0.85% 0.96% memset user
0.75% 0.84% bcopy kernel
0.23% 0.26% comm select user Profile on 1998-09-15 from 11:00 to 12:00 PDT
[image:38.612.183.430.223.565.2]mean load = 48 requests/sec. peak load ca. 106 requests/sec
even though during the profiled periods, the system with that kernel processed a lower mean request rate (48 vs. 56 requests/sec) and peak request rate (106 vs. 131 requests/sec). This explains the appearance of the pmap zero page()function in the profile for the unmodified kernel, soaking up almost 4% of the non-idle CPU time. When the kernel spends a significant amount of time in the idle loop, it puts this time to use by zeroing the contents of free pages. When these pages are later allocated to virtual address spaces or files, the kernel then does not have to spend the time to zero their contents.
However, when the system spends little time in the idle loop, it soon runs out of pre-zeroed free pages, and pages must then be zeroed when they are allocated. This causes additional delay for the consumers of these pages [RBH+
95]. So the increase in idle time provided by our kernel modifications not only improves latency directly, by decreasing the time to perform theselect() system call; it also improves latency indirectly.
0 5 10 15 20
% non-idle CPU time 0
5
Squid 1.1.20Mod Netcache 3.1.2c-OSF
select
[image:39.612.96.527.350.547.2]new_soo_select new_selscan_one
Figure 14: Breakdown of kernelselect()costs for NetCache and Squid
The profiles in Tables 7 and 13 imply that Squid and NetCache use theselect()system call in different ways. Figure 14 illustrates this difference, for trials using the modified kernel. NetCache causes the kernel to spend significantly more time innew selscan one()andnew soo select(), while Squid causes the kernel to spend significantly more time in theselect()function. While this difference might be partly the result of different request patterns during the two trial periods, we believe that it may actually reflect algorithmic differences between Squid and NetCache.
when select()returns a non-empty bitmap, comm select()iterates through this bitmap and in-vokes handlers for ready descriptors. Because it might take some time to get through this set of handlers (they might even block, in some cases), during this loopcomm select()frequently calls comm select incoming()to see if any requests have arrived on several special descriptors. One is used for accepting new HTTP connections; the others are used for inter-cache communication in a caching hierarchy. Thus, comm select incoming() invokes theselect() system call with a very small bitmap (and, we believe, usually does not find any ready descriptors as a result). This might explain why Squid spends proportionately more time in the kernel' sselect()function than NetCache, and less time in thenew selscan one()andnew soo select()functions.
Without access to the NetCache sources, we cannot verify this analysis. However, we note that the DCPI profile for NetCache does not include any functions with a name, or execution frequency, similar to that ofcomm select incoming()from the Squid profile. We suspect that Squid' s calls to comm select incoming()are unnecessarily frequent, and hence Squid is spending too much time in the kernel' sselect()function. If so, it might be possible to eliminate another 10% or so of the CPU time spent in the kernel on Squid' s behalf. We also note that the multithreaded design of NetCache, discussed in Section 6.3, may affect its use of theselect()system call.
6.7
Summary of live performance results
We obtained measurements from live proxy systems to verify that our concerns about scaling are indeed important, and to better understand the details of how real-world proxies actually perform. The central assumption behind the work presented in this paper is that real-world Web servers and proxies, unlike systems benchmarked in LAN environments, must manage a very large number of file descriptors. Our measurements confirm this; we saw peak per-process file descriptor counts as high as 2380 (and even higher on days when transient network conditions led to periods of no progress).
We expect the peak descriptor counts seen by a given to grow as Web traffic increases, espe-cially since faster CPUs and better proxy software will allow a single system to handle larger user populations.
Given that a real-world proxy server must manage lots of open connections, it is not surprising that an event-driven server (such as NetCache or Squid) would spend a lot of time in theselect() system call. Our DCPI profiles bear this out; with the original implementation of select(), we found that during a typical period of heavy load, NetCache spent about 40% of the system' s non-idle CPU cycles inselect(), and our improved version of Squid spent 44% of the non-idle cycles inselect().
Even with our improved implementation ofselect(), NetCache still spends 30% of the non-idle cycles in that part of the kernel, and Squid spends 25% of the non-idle cycles there. So while we have made major improvements in the efficiency of select(), it is still an impediment to scaling; replacing it with a different programming interface remains the most appealing solution.
We found that, unlike in our benchmark-based tests, the cost ofufalloc()does not seem to be a major problem for the live proxy systems. This may be a consequence of our use, in the benchmark tests, of a fixed set of “cold” connections; in real life, the pattern of descriptor allocation might be considerably different. However, our modified version ofufalloc()did perform significantly better than the original, even if the absolute numbers are relatively small.
By correlating measured request rates with the amount of CPU time spent in various modes, we were able to demonstrate that, overall, our kernel changes provide a significant improvement in the efficiency of the proxy server system. This should lead to a higher maximum throughput, and lower per-request latency, although we have not measured either value directly.
We learned from the DCPI profiles that Squid 1.1.20 spends a lot of time using an inefficient algorithm for constructing the input bitmaps for the select() system call, and also is not very efficient at scanning the result bitmaps. By making some simple changes to these algorithms, we were able to eliminate virtually all of this cost, improving the performance of Squid. This result suggests that although the use of bitmaps in the select() programming interface is not the best possible design, it is relatively unimportant compared to other aspects of theselect()interface.
The DCPI profiles for NetCache 3.1.2c-OSF suggest that it, too, uses the same inefficient al-gorithms as in Squid 1.1.20. However, the profiles also suggest that NetCache and Squid make use of select()in somewhat different ways, and Squid might be able to learn a few tricks from NetCache.
7
Related Work
mechanisms, especially by replacing BSD' s linear-time PCB lookup algorithm [MD93, Sol], and by changing certain kernel parameter values. Vendors also provided tuning guides for systems being used as Web servers [DEC98].
In response to observations about the large context-switching overhead of process-per-connection servers, recent servers [CDN+
96, Net, Squ, tht, Zeu] have used event-driven architectures. Meas-urements of these servers under laboratory conditions indicate an order of magnitude performance improvement [CDN+
96, SS96].
Maltzahn et. al. [MRG97] reported the poor performance of Squid under real conditions. Fox et al. [FGC+
97], in describing the Inktomi system, also briefly mention that their event-driven front-ends spend 70% of their time in the kernel, and attribute this to the state-management overhead of a large number of simultaneous connections. However, neither of these papers analyzed the reason for this phenomenon in any detail.
8
Conclusion
We presented a detailed analysis of the effect of WAN delays on the performance of event-driven servers, and showed that linear scaling in theselect() andufalloc()implementations leads to ex-cessive kernel CPU consumption.
We described scalable versions ofselect()andufalloc(), and evaluated their impact on the per-formance of event-driven servers. We showed that these changes improve the perper-formance of Web servers and proxies on realistic benchmarks, and on a live proxy, without harming performance on naive benchmarks.
Our results show the need for a new, scalable interface to replaceselect(). We are currently working to develop this.
Acknowledgments
References
[AB+
97] Jennifer Anderson, Lance M. Berc, et al. Continuous profiling: Where have all the cycles gone? In Proceedings of the Sixteenth ACM Symposium on Operating System
Principles, pages 1–14, San Malo, France, October 1997.
[BD97] Gaurav Banga and Peter Druschel. Measuring the Capacity of a Web Server. In
Proceedings of the 1997 USENIX Symposium on Internet Technologies and Systems,
pages 61–71, Monterey, CA, December 1997.
[BDM98] Gaurav Banga, Peter Druschel, and Jeffrey C. Mogul. Better operating system fea-tures for faster network servers. In Proceedings of the Workshop on Internet Server
Performance, pages 69–79, Madison, WI, June 1998. To appear in ACM
SIGMET-RICS Performance Evaluation Review 26(3), December 1998.
[BDR97] Gaurav Banga, Fred Douglis, and Michael Rabinovich. Optimistic Deltas for WWW Latency Reduction. In Proceedings of the 1997 USENIX Technical Conference, pages 289–303, Anaheim, CA, January 1997.
[CDN+
96] Anawat Chankhunthod, Peter B. Danzig, Chuck Neerdaels, Michael F. Schwartz, and Kurt J. Worrell. A Hierarchical Internet Object Cache. In Proceedings of the 1996
USENIX Technical Conference, pages 153–163, San Diego, CA, January 1996.
[DEC98] Digital UNIX Tuning Parameters for Web Servers.
http://www.digital.com/info/internet/document/ias/tuning.html, 1998. [FGC+
97] Armando Fox, Steven D. Gribble, Yatin Chawathe, Eric A. Brewer, and Paul Gauth-ier. Cluster-based scalable network services. In Proceedings of the Sixteenth ACM
Symposium on Operating System Principles, pages 78–91, San Malo, France, October
1997.
[KEGW96] M. Frans Kaashoek, Dawson R. Engler, Gregory R. Ganger, and Deborah A. Wallach. Server Operating Systems. In Proceedings of the 1996 SIGOPS European Workshop, pages 141–148, Connemara, Ireland, September 1996.
[KP93] Jonathan Kay and Joseph Pasquale. The Importance of Non-Data Touching Pro-cessing Overheads in TCP/IP. In Proceedings of the ACM Communications
Archi-tectures and Protocols Conference (SIGCOMM), pages 259–268, San Francisco, CA,