Munich Personal RePEc Archive
Public Capital, Internal Rate of Return
and Growth Accounting
Mas, Matilde
Instituto Valenciano de Investigaciones Económicas, Universitat de
València
2005
Online at
https://mpra.ub.uni-muenchen.de/15821/
PUBLIC CAPITAL, INTERNAL RATE OF RETURN AND GROWTH ACCOUNTING
Matilde Mas*
(Universitat de València & Ivie)
Abstract
The note raises some methodological problems derived from the presence of public
capital. It follows closely Jorgenson and Landfeld (2004) proposal of modifying Gross
Value Added and Gross Operating Surplus figures provided by National Accounts,
since public capital services are underestimated. Making use of the Spanish data we
conclude that Spanish NA figures underestimate GVA and GOS in approximately 4%
and 9% respectively with the gap increasing since the middle of the nineties. However, the rates of growth are not that different. Finally, growth accounting results show
slightly higher contributions of capital and TFP to output growth when the alternative
approach is applied.
*
In this paper we address some issues related with publicly owned capital goods.
Jorgenson and Landfeld (2004) addressed the main problems in the following terms:
“While the existing accounts do treat government expenditures on capital goods as
investment, they include only a partial value for the services of government capital by
counting the value of depreciation on government capital (no value is included for the
services of nonprofit capital)…The present treatment of government capital implicitly
assumes that the net return to government capital is zero, despite a positive opportunity
cost” And they continue, “the net return to the capital stock must (be) estimated and
added to depreciation to develop a service value. This estimation raises conceptual
issues relating to the appropriate opportunity cost and empirical issues in estimating this
cost” (pg. 12).
The above paragraph summarizes the main issues, with the following important
implications:
1. The Gross Operating Surplus (GOS) figures provided by National Accounts
(NA) are underestimated because the value of capital services provided by
public capital is not fully considered.
2. Consequently the value of output is also underestimated in NA figures, affecting
both its level and rate of growth.
3. If the endogenous approach is used when computing the rate of return, points 1
and 2 above will have, at least potentially, consequences on:
- The implicit rate of return
- The input shares
- The growth accounting results
4. If the exogenous approach is adopted, only point 2 above will have
consequences on the growth accounting exercise.
In this note we explore the above issues using the Spanish data. Section 1 presents the
general framework; section 2 focuses on the internal rate of return determination;
section 3 sketches some growth accounting implications; section 4 summarizes the data;
1. General Framework
Assuming we have information on the Volume Index of Capital Services (VICS) for the
n available assets we define Kj,t as the VICS of asset j at time t. Let’s consider that the
ownership of Kj,t is divided between the private sector (Kpj,t) and the public sector (Kgj,t).
Thus, Kj,t = Kpj,t+ Kgj,t.
The value of the capital services (CSj,t) provided by asset j is given by:
CSj,t = qj,t Kj,t-1 = qj,t Kpj,t-1 + qj,t Kgj,t-1 [1a]
Where qj,t is the rental price, or user cost, of the capital services provided by asset j at
time t. In [1a] we are assuming that the value of the capital services provided by the
asset is independent of who owns it, the private or the public sector. This approach
follows Nordhaus´ (2004) basic principle for measuring non-market activities.
According to this principle: “Non-market goods and services should be treated as if they
were produced and consumed as market activities. Under this convention, the prices of
non-market goods and services should be imputed on the basis of the comparable
market goods and services” (pg. 5).
Alternatively, we might wish to assume that the value of capital services provided by a
given asset depends on who owns it. In that case, expression [1a] can be written as:
, , 1 , , 1
*
, j t j t j t j t
p p g g j t
CS q K q K
− −
= + [1b]
In practice, the user cost expression can adopt different versions (see Harper, Berndt
and Wood (1989)). For the present purpose we follow Jorgenson and Landfeld (2004)
and assume that the user cost, or rental price of asset j at time t, excluding the tax
treatment term (due to lack of data), is given by
pj,t being the acquisition price of a new asset j; rt the nominal rate of return (assumed to
be common for all assets); πj,t the rate of change of pj,t; and δj the depreciation rate of
asset j.
Equation [2a] does not make any distinction between private and public capital. But, of
course, other options are open. Moulton (2004), following Slater and Davies (1998),
mentions four general ways of estimating the rate of return of government fixed capital:
a) an econometric determination; b) the use of a pre-determined rate such as the rate set
by the U.S. Office of Management and Budget (OMB); c) the rate of return for
comparable private business activities; or d) the interest rate at which governments
borrow. If we introduce in equation [2a] different nominal rates of return for private and
public capital the corresponding user costs will also be different. For the privately
owned asset j the rental price will be given by:
qpj,t = pj,t-1[rpt - πj,t + (1+πj,t) δj] [2b]
Similarly for public assets
qgj,t = pj,t-1[rgt - πj,t + (1+πj,t) δj] [2c]
Jorgenson and Landfeld (2004) recommend the use of the same r´s for private and
public assets, as in [2a]. In pg. 35 they mention: “For government, the imputed rate of
return is set equal to the average of corporate, non-corporate, and household rates of
return…”. When the tax treatment is ignored, as in our case, the Jorgenson and Landfeld
recommendation lead us to use the same rate of return for both assets.
The next problem is to define a procedure for the rate of return calculations. This topic
2. On the Rate of Return
As it is well known, there are two general ways of computing the rates of return in a
growth accounting exercise: endogenous and exogenously. The exogenous approach
assumes that the r´s in [2a] – [2c] should be somehow related to observed market’s
nominal rates of interest. On its part, the endogenous approach, making use of some
additional assumptions (i.e. constant returns to scale, competitive markets and
optimizing behavior), obtains the r´s through equalizing the aggregate value of capital
services to the Gross Operating Surplus figures from the National Accounts (GOSNA).
The internal rate of return can be obtained by solving for rt in [3]
(
)
, , 1 , 1 , 1 , , 1
NA
t j t j t j t t j t j t j j t
j j
GOS =
∑
q K − =∑
p − r −π + +π δ K − [3]Here we will not go into the pros and cons of both approaches but simply notice that
options a), b) and d) suggested by Moulton (2004) imply the use of an exogenous rate of
return, while option c) is compatible with the endogenous approach.
Let’s consider now the problems posed by the presence of public goods. Common to the
exogenous and the endogenous approach is the fact that most frequently the available
statistics do not allow the distinction between assets owned by the private and public
sectors, being grouped under the same heading, usually “other constructions”. This is
not too problematic when the exogenous approach is adopted since in this case
(
)
(
)
, , 1
, , 1 , 1 , 1 , , , 1 , 1
,
1
j t j t
j j
p g p g
j t j t j t j t t j t j t j j t j t
j j
CSj t q K
q K K p r K K
−
− − − − −
= =
= + = − + − +
∑
∑
∑
∑
π π δ [4]In this case, we are implicitly following Nordhaus (2004) basic principle for measuring
non-market activities since we are applying the same rental price to an asset regardless
of who owns it.
However, things are different when the endogenous approach is adopted. The difficulty
from Jorgenson and Landfeld. According to NA, Gross Operating Surplus, GOSNA
(conceptually equivalent to aggregate CS in the endogenous approach) is computed as:
, , 1 , 1 , 1
NA p p g
t j t j t j j t j t
j j
GOS =
∑
q K − +∑
δ p −K − [5]Where qpj,t is the rental price of the services provided by the private capital given by
[2b]. Thus, the flow of capital services provided by private and government capital is
valued differently according to NA. Private capital has a positive net return. The return
of Public capital is limited to the rate of gross capital consumption. Researchers usually
do not take into account the way NA compute GOS, or the distinction between private
and public capital. Thus, they compute the rate of return, r, from an equation like [6]
(
)
, , 1 , 1 , 1 , 1 , , 1 , 1
NA p g p g
t j t j t j t j t t j t j t j j t j t
j j
GOS =
∑
q K − +K − =∑
p − r −π + +π δ K − +K − [6]An Alternative Approach
Jorgenson and Landfeld (2004) makes two amendments to the previous presentation.
First they recommend the use of both approaches, endogenous and exogenous, and
secondly, they compute the endogenous rate of return once the NA figures have been
revised.
Let’s start with the first amendment (and ignoring taxes for lack of information).They
define the rate of return for all sectors1 of the economy as the weighted average of the
rate of interest, it, and the internal rate of return, ρt, with weights, βt, representing the
debt/capital ratio of corporations as given by [7] 2:
r t -πj,t =βt[it - πj,t] + [1 - βt][ρt - πj,t] [7]
1
According to tax considerations Jorgenson and Landfeld (2004) compute four different rates of return, one for each of the following sectors of the economy: 1. The non-tax sector; 2. Households; 3. Non-corporate business; and 4. Corporate business.
2
Equation [7] can be written as:
rt = βt it + [1 - βt]ρt [8]
Transforming equation [2a] into:
qj,t = pj,t-1[βt it + (1 - βt)ρt - πj,t + (1+πj,t) δj] [9]
Thus, the rental price of capital depends on the nominal (exogenous) rate of interest, it,
and the internal rate of return, ρt, both assumed common to all assets and sectors in the
economy. With this amendment, the standard calculation of the internal rate of return
will be computed by solving for ρtin equation [10].
(
)
(
)
, 1 1 , 1 , , 1 , 1
NA p g
t j t t t t t j t j t j j t j t
j
GOS =
∑
p − βi + −β ρ π− + +π δ K − +K − [10]The second amendment concerns the computation of ρt in the alternative approach. Its
implementation requires separate estimates of private and public capital. If they are
available, we can subtract public capital consumption from GOSNA in equation [5] and
compute the internal rate of return, ρtfrom [11]
(
)
(
)
, 1 , 1 , , 1
, 1 , , , 1
1 1
NA g p
t j j t j t j t j t
j j
p j t t t t t j t j t j j t j
GOS p K q K
p i K
− − −
− −
− = =
= + − − + +
∑
∑
∑
δ
β β ρ π π δ [11]
Once ρt has been computed in [11], and assuming the same rental price for public or
private capital, qj,t in [9], we can revise the GOSNA figures, adding the services provided
by public capital and deducting its capital consumption:
, , 1 , 1 , 1
R NA g g
t t j t j t j j t j t
j j
3. Growth Accounting Implications
As already indicated, the explicit recognition of the provision of capital services by
public goods affect the value, and growth rates, of two of the variables involved in any
growth accounting exercise: value added and capital input. In this section we detail the
specific formulation for both variables. The results of the exercises are presented in
section 5
Value Added
YNAl,t represents nominal value added of branch l at time t according to National
Accounts (NA). Yl,t is the nominal value added according to our alternative approach.
Equation [13] defines Yl,t as
Yl,t = YNAl,t + ∑ qj,t Kgj,t-1 - ∑δj pj,t-1 Kgj,t-1 [13]
With qj,t given by [9] and ρt in [9] given by [11]. Real value added (y) is computed
using NA deflators:
yl,t = Yl,t / pNAl,t ; pNAl,t = YNAl,t / yNAl,t [14]
yNAl,t and yl,t denote real value added according to NA and the alternative approach
respectively; NA, l t
p is the deflator for branch l value added according to NA.
Equation [15] below provides the growth rate of real value added for the alternative
approach. Substituting for the NA figures gives the rate of growth for the standard
approach.
[
]
, ,, ,
, ,
1 1
ln t ln t T 0, 5 l t l t T ln l t ln l t T l t l t T
l l
Y Y
y y y y
T T Y Y
−
− −
−
− = + −
∑
∑
∑
[15]Capital Input
CSj,l,t = pj,t-1[βt it+ (1-βt) ρt -πj,t + (1+πj,t) δj ] [Kpj,l,t-1 + Kgj,l,t-1] [16]
Where ρt is computed from [10] in the standard approach and from [11] in the
alternative approach.
[
]
, , , , , , , ,
, , , ,
1
ln ln
1
0, 5 j l t j l t T ln ln
j l t j l t T
j l j l
t t T
j l t j l t T j l
CS CS
CS CS
K K
T
K K
T
−
−
−
−
+
∑ ∑ ∑ ∑
− =
∑ ∑ −
[17]
Equation [17] provides the growth rate of aggregate capital input according to both
approaches. The results are presented in section 5 but, previously, section 4 describes
briefly the data.
4. The data
Fundación Banco Bilbao Vizcaya Argentaria (FBBVA) and the Instituto Valenciano de
Investigaciones Económicas (Ivie) elaborate the Spanish capital database on a yearly
basis. The methodology follows the one proposed by the OECD in two Manuals:
Measuring Capital and Measuring Productivity. The details can be found in Mas, Pérez
and Uriel (2005a,b). The Volume Index of Capital Services, VICS, are constructed using
a Winfrey S-3 Retirement Function and a Hyperbolic Age-Efficiency Function. The
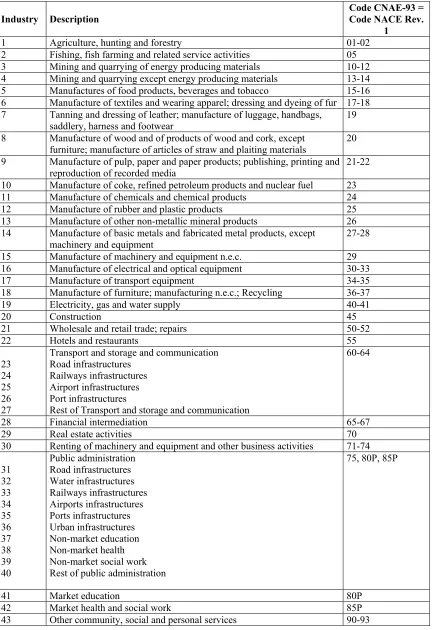
period covered is 1964-2002. The FBBVA-Ivie estimates consider 43 industries and 18
asset types. Table 1 presents the classification of industries and table 2 the 18 asset
Table 1. Classification of industries.
Industry Description
Code CNAE-93 = Code NACE Rev.
1
1 Agriculture, hunting and forestry 01-02
2 Fishing, fish farming and related service activities 05 3 Mining and quarrying of energy producing materials 10-12 4 Mining and quarrying except energy producing materials 13-14 5 Manufactures of food products, beverages and tobacco 15-16 6 Manufacture of textiles and wearing apparel; dressing and dyeing of fur 17-18 7 Tanning and dressing of leather; manufacture of luggage, handbags,
saddlery, harness and footwear
19
8 Manufacture of wood and of products of wood and cork, except furniture; manufacture of articles of straw and plaiting materials
20
9 Manufacture of pulp, paper and paper products; publishing, printing and reproduction of recorded media
21-22
10 Manufacture of coke, refined petroleum products and nuclear fuel 23 11 Manufacture of chemicals and chemical products 24 12 Manufacture of rubber and plastic products 25 13 Manufacture of other non-metallic mineral products 26 14 Manufacture of basic metals and fabricated metal products, except
machinery and equipment
27-28
15 Manufacture of machinery and equipment n.e.c. 29 16 Manufacture of electrical and optical equipment 30-33 17 Manufacture of transport equipment 34-35 18 Manufacture of furniture; manufacturing n.e.c.; Recycling 36-37
19 Electricity, gas and water supply 40-41
20 Construction 45
21 Wholesale and retail trade; repairs 50-52
22 Hotels and restaurants 55
23 24 25 26 27
Transport and storage and communication Road infrastructures
Railways infrastructures Airport infrastructures Port infrastructures
Rest of Transport and storage and communication
60-64
28 Financial intermediation 65-67
29 Real estate activities 70
30 Renting of machinery and equipment and other business activities 71-74
31 32 33 34 35 36 37 38 39 40 Public administration Road infrastructures Water infrastructures Railways infrastructures Airports infrastructures Ports infrastructures Urban infrastructures Non-market education Non-market health Non-market social work Rest of public administration
75, 80P, 85P
41 Market education 80P
42 Market health and social work 85P
43 Other community, social and personal services 90-93
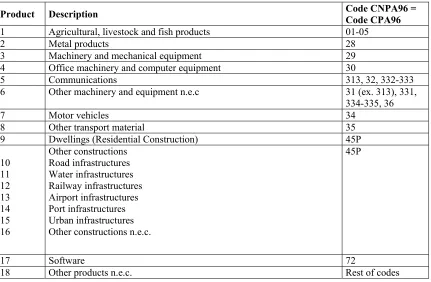
Table 2. Classification of Assets
Product Description Code CNPA96 =
Code CPA96
1 Agricultural, livestock and fish products 01-05
2 Metal products 28
3 Machinery and mechanical equipment 29
4 Office machinery and computer equipment 30
5 Communications 313, 32, 332-333
6 Other machinery and equipment n.e.c 31 (ex. 313), 331, 334-335, 36
7 Motor vehicles 34
8 Other transport material 35
9 Dwellings (Residential Construction) 45P
10 11 12 13 14 15 16
Other constructions Road infrastructures Water infrastructures Railway infrastructures Airport infrastructures Port infrastructures Urban infrastructures Other constructions n.e.c.
45P
17 Software 72
18 Other products n.e.c. Rest of codes
The information is available for every year in a matrix format with the values for each
industry in columns and for the 18 assets in rows. The FBBVA-Ivie database makes a
clear distinction between assets owned by the private sector (Kpj,t) and those owned by
the public sector (Kgj,t). The last ones correspond to the columns under the heading
“Public Administration” in table 1 which consists of ten different branches.
The information for the variables GOSNA and YNA comes from the Spanish National
Accounts released by the Spanish Instituto Nacional de Estadística (INE). The Bank of
Spain provides the data for the nominal interest rates, it, and the ratio βt. For the first
one we have used the medium and long-term loans to enterprises rates, and for the
second the ratio external funds/(external funds+equity) from a survey published every
5. Results
Graph 1 compares the internal rates of return computed according to the standard
approach (equation [10]) and the alternative approach (equation [11]). While the time
profiles are practically the same the level is, as expected, higher in the alternative than
in the standard approach.
1985 1986 1987 1988 1989 1990 1991 1992 1993 1994 1995 1996 1997 1998 1999 2000 2001 2002 -5%
0% 5% 10% 15% 20% 25% 30%
Standard Alternative GRAPH 1.
Internal Rate of Return [ρ]. Standard vs. Alternative Approach
Sources: INE, FBBVA-Ivie and own calculations
Graph 2 plots the ratios between the GVA and GOS figures according to the two
approaches. The GVA data for the alternative approach is obtained from equation [13]
and those for GOS from [12]. As can be seen the NA underestimate the GVA figures by
approximately 4%, and the GOS figures by 9%. In both cases the gap has increased
since the middle of the nineties.
However, these differences in levels are lower in terms of growth rates (see graphs 3 &
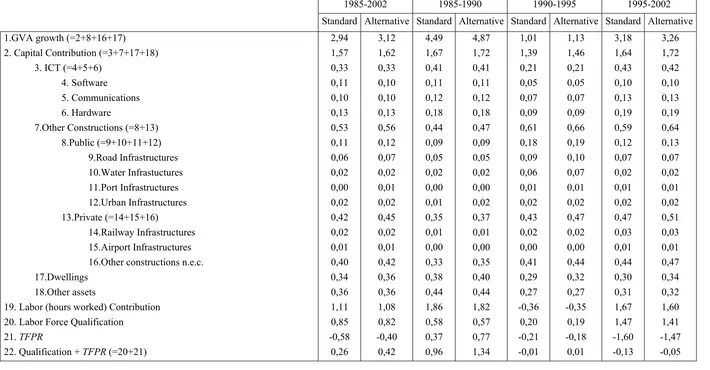
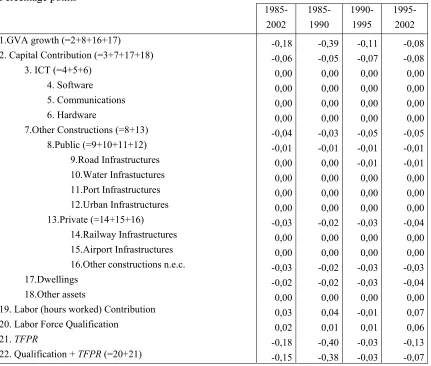
4). As a consequence, table 3 shows the different estimates that we get from carrying
out the growth accounting exercise from each approach. Table 4 makes explicit the
underestimation of GVA growth, the contribution of capital and of TFPR. These
1986 1987 1988 1989 1990 1991 1992 1993 1994 1995 1996 1997 1998 1999 2000 2001 2002 2,0%
2,5% 3,0% 3,5% 4,0% 4,5% 5,0% 5,5% 6,0%
Standard Alternative
GRAPH 4.
Growth Rates of Capital. Standard vs. Alternative Approach
Sources: INE, FBBVA-Ivie and own calculations
1987 1988 1989 1990 1991 1992 1993 1994 1995 1996 1997 1998 1999 2000 2001 2002 -2%
-1% 0% 1% 2% 3% 4% 5% 6%
Standard Alternative
GRAPH 3.
Growth Rates of Gross Value Added. Standard vs. Alternative Approach
Sources: INE, FBBVA-Ivie and own calculations
1986 1987 1988 1989 1990 1991 1992 1993 1994 1995 1996 1997 1998 1999 2000 2001 2002 0,88
0,90 0,92 0,94 0,96 0,98
GOS / GOS Y / Y
GRAPH 2.
Gross Value Added and Gross Operating Surplus Ratio. National Accounts / Alternative Approach
Sources: INE, FBBVA-Ivie and own calculations
Table 3. Growth Accounting. Alternative vs. Standard Approach.
Percentages
1985-2002 1985-1990 1990-1995 1995-2002
Standard Alternative Standard Alternative Standard Alternative Standard Alternative
1.GVA growth (=2+8+16+17) 2,94 3,12 4,49 4,87 1,01 1,13 3,18 3,26
2. Capital Contribution (=3+7+17+18) 1,57 1,62 1,67 1,72 1,39 1,46 1,64 1,72
3. ICT (=4+5+6) 0,33 0,33 0,41 0,41 0,21 0,21 0,43 0,42
4. Software 0,11 0,10 0,11 0,11 0,05 0,05 0,10 0,10
5. Communications 0,10 0,10 0,12 0,12 0,07 0,07 0,13 0,13
6. Hardware 0,13 0,13 0,18 0,18 0,09 0,09 0,19 0,19
7.Other Constructions (=8+13) 0,53 0,56 0,44 0,47 0,61 0,66 0,59 0,64
8.Public (=9+10+11+12) 0,11 0,12 0,09 0,09 0,18 0,19 0,12 0,13
9.Road Infrastructures 0,06 0,07 0,05 0,05 0,09 0,10 0,07 0,07
10.Water Infrastuctures 0,02 0,02 0,02 0,02 0,06 0,07 0,02 0,02
11.Port Infrastructures 0,00 0,01 0,00 0,00 0,01 0,01 0,01 0,01
12.Urban Infrastructures 0,02 0,02 0,01 0,02 0,02 0,02 0,02 0,02
13.Private (=14+15+16) 0,42 0,45 0,35 0,37 0,43 0,47 0,47 0,51
14.Railway Infrastructures 0,02 0,02 0,01 0,01 0,02 0,02 0,03 0,03
15.Airport Infrastructures 0,01 0,01 0,00 0,00 0,00 0,00 0,01 0,01
16.Other constructions n.e.c. 0,40 0,42 0,33 0,35 0,41 0,44 0,44 0,47
17.Dwellings 0,34 0,36 0,38 0,40 0,29 0,32 0,30 0,34
18.Other assets 0,36 0,36 0,44 0,44 0,27 0,27 0,31 0,32
19. Labor (hours worked) Contribution 1,11 1,08 1,86 1,82 -0,36 -0,35 1,67 1,60
20. Labor Force Qualification 0,85 0,82 0,58 0,57 0,20 0,19 1,47 1,41
21. TFPR -0,58 -0,40 0,37 0,77 -0,21 -0,18 -1,60 -1,47
22. Qualification + TFPR (=20+21) 0,26 0,42 0,96 1,34 -0,01 0,01 -0,13 -0,05
Table 4. Growth Accounting Results Differences. Standard minus Alternative.
Percentage points
1985-2002
1985-1990
1990-1995
1995-2002
1.GVA growth (=2+8+16+17) -0,18 -0,39 -0,11 -0,08
2. Capital Contribution (=3+7+17+18) -0,06 -0,05 -0,07 -0,08
3. ICT (=4+5+6) 0,00 0,00 0,00 0,00
4. Software 0,00 0,00 0,00 0,00
5. Communications 0,00 0,00 0,00 0,00
6. Hardware 0,00 0,00 0,00 0,00
7.Other Constructions (=8+13) -0,04 -0,03 -0,05 -0,05
8.Public (=9+10+11+12) -0,01 -0,01 -0,01 -0,01
9.Road Infrastructures 0,00 0,00 -0,01 -0,01
10.Water Infrastuctures 0,00 0,00 0,00 0,00
11.Port Infrastructures 0,00 0,00 0,00 0,00
12.Urban Infrastructures 0,00 0,00 0,00 0,00
13.Private (=14+15+16) -0,03 -0,02 -0,03 -0,04
14.Railway Infrastructures 0,00 0,00 0,00 0,00 15.Airport Infrastructures 0,00 0,00 0,00 0,00 16.Other constructions n.e.c. -0,03 -0,02 -0,03 -0,03
17.Dwellings -0,02 -0,02 -0,03 -0,04
18.Other assets 0,00 0,00 0,00 0,00
19. Labor (hours worked) Contribution 0,03 0,04 -0,01 0,07
20. Labor Force Qualification 0,02 0,01 0,01 0,06
21. TFPR -0,18 -0,40 -0,03 -0,13
22. Qualification + TFPR (=20+21) -0,15 -0,38 -0,03 -0,07
Sources: INE, FBBVA-Ivie and own calculations
6. Conclusions
The note raises some methodological problems derived from the presence of public
capital. It follows closely Jorgenson and Landfeld (2004) proposal of modifying Gross
Value Added and Gross Operating Surplus figures provided by National Accounts,
since public capital services are underestimated. As a consequence, the internal rate of
return computed by the standard endogenous approach is also underestimated. Making
use of the Spanish data we conclude that Spanish NA figures underestimate GVA and
GOS in approximately 4% and 9% respectively with the gap increasing since the middle
of the nineties. However, the rates of growth are not that different. Finally, growth
accounting results show higher output growth and also higher contributions of capital
REFERENCES
Harper, M.J., Berndt, E.R. and D.O. Wood (1989): “Rates of Return and Capital
Aggregation Using Alternative Rental Prices” in D.W. Jorgenson and R. Landau (eds)
Technology and Capital Formation, MIT Press.
INE (several years): Contabilidad Nacional de España, Instituto Nacional de
Estadística, Madrid.
Jorgenson, D. W., Ho M. S., and Stiroh, K.J. (2004): “Growth of U.S. Industries and
Investments in Information Technology and Higher Education”, Draft June 21.
Jorgenson, D.W. and Landfeld, J.S. (2004): “Blueprint for Expanded and Integrated
U.S. Accounts: Review, Assessment, and Next Steps”, paper presented at the
Conference on Research in Income and Wealth, New Architecture for the U.S. National
Accounts, Washington D.C., April 16-17.
Mas, M., Pérez, F. and E. Uriel (2005a): “Capital Stock in Spain, 1964-2002. New
Estimates” in Mas, M. and P. Schreyer (eds.) Growth, Capital and New Technologies,
FBBVA, Bilbao, forthcoming.
______ (2005b) El Stock y los Servicios del Capital en España (1964-2002). Nueva
Metodología, FBBVA, Bilbao.
Moulton, B.R. (2004): “The System of National Accounts for the New Economy: What
Should Change?”, The Review of Income and Wealth, Series 50, Nº 2, June, 261-278.
Nordhaus, W.D. (2004): “Principles of National Accounting for Non-Market
Accounts”, paper presented at the Conference on Research in Income and Wealth, New
Architecture for the U.S. National Accounts, Washington D.C., April 16-17.
OECD (2001a): Measuring Productivity, Measurement of Aggregate and Industry-level
______(2001b): Measuring Capital, OECD Manual, Paris
Slater, C.M. and M.H. David (eds) (1998): Measuring the Government Sector of the
U.S. Economic Accounts, Committee on National Statistics, National Research Council,