Munich Personal RePEc Archive
Wage Mobility in Europe. A
Comparative Analysis Using restricted
Multinomial Logit Regression
Pavlopoulos, Dimitris and Muffels, Ruud and Vermunt,
Jeroen-K.
October 2005
Online at
https://mpra.ub.uni-muenchen.de/229/
Wage Mobility in Europe. A Comparative Analysis Using
Restricted Multinomial Logit Regression
Dimitris Pavlopoulos * Ruud Muffels ** Jeroen K. Vermunt ***
* Corresponding author. Tilburg Institute for Social and Socio-Economic Research (TISSER), Tilburg University, P.O. Box 90153,
NL – 5000 LE Tilburg, [email protected]
** Tilburg Institute for Social and Socio-Economic Research (TISSER), Tilburg University and Institute for Labour Studies (OSA)
*** Department of Methodology and Statistics, Tilburg University
The scientific research programme of the Institute for Labour Studies (OSA) is
based on current and planned labour research of the Tilburg University participants CentER (Faculty of Economics and Business Administration),
WORC (Faculty of Social and Behavioural Sciences), CentER for Applied
Research and of the labour researchers of Utrecht University.
The OSA working paper series intends to disseminate results of research
conducted under the heading of the OSA scientific programme. OSA working
papers may include views on policy, but any opinions expressed are those of the
author(s) and not those of the Institute.
Wage Mobility in Europe. A Comparative Analysis Using Restricted
Multinomial Logit Regression*
Dimitris Pavlopoulos, Prof. Dr. Ruud Muffels* & Prof. Dr. Jeroen K. Vermunt**
Abstract
In this paper, we investigate cross-country differences in wage mobility in Europe
using the European Community Household Panel. The paper is particularly focused
on examining the impact of economic conditions, welfare state regimes and
employment regulation on wage mobility. We apply a log-linear approach that is very
much similar to a restricted multinomial logit model and much more flexible than the
standard probit approach. It appears that regime, economic conditions and
employment regulation explain a substantial part of the cross-country variation. The
findings also confirm the existence of an inverse U-shape pattern of wage mobility,
showing a great deal of low and high-wage persistence in all countries.
Keywords: wages, wage mobility, wage dynamics, multinomial logit regression, log-linear models, welfare states
JEL classification: J31, C19
* We would like to thank Didier Fouarge, Wilfred Uunk and Trudie Schils for their useful comments
and suggestions. This paper was benefited by comments of the participants the EPUNet 2005
conference in Colchester and by comments of the participants of the Labour Group of
CENTER/Tilburg University.
*
TISSER-Tilburg Institute for Social and Socio-Economic Research, **Department of Methodology
and Statistics, Tilburg University, the Netherlands. Correspondence to: [email protected] ,
1. Reviewing the measures of income and wage mobility
Different responses are to be expected when individuals are asked what changes in
wages or incomes they would like to experience over time: some people would just
wish to see their income rise in absolute levels (absolute mobility); another group
would like to see its income improved compared to other people (relative mobility);
others prefer their income to be stable and not to be too volatile (income risk).
Following these differences in individual preferences, numerous definitions of wage
mobility have been developed. These definitions correspond to different theories
about the way income or wage changes affects the well-being of individuals (Fritzell,
1990).
According to standard economic theory, people are assumed to be primarily
interested in the absolute changes of their (real) income. However, Hirsch (1995)
suggested that even if someone cared only for the purchasing power of his own
income, his rank in the distribution still matters, as it determines his ability to acquire
“positional” (goods whose assigned value depends on how many other possess them)
or status goods. Hence, the relative position of an individual in the distribution,
referred to as ‘relative positional’ mobility, matters more. Other researchers, such as
Duesenberry (1967) and Easterlin (1974) believe also that since preferences are
endogenous, people tend to adapt them in view of what others have and want (the
“keeping up” with the Joneses’ aspect). The idea of “relative deprivation”, according
to which people always evaluate their income or living conditions in comparison to
the conditions of their peers, was introduced by sociologists such as Runciman
his(her) income remains stable while the income of the individuals (s)he compares
him or herself with deteriorates. Psychologists such as Brickman et al. (1978),
however, argue that individual income gains tend to diminish due to the rapid
adjustment of people’s preferences to the new situation and due to raising their
expectations about the future. Therefore, they suggest that no gain in happiness or
social welfare will occur in the end.
Most studies on wage mobility involve measures that include all the three
aforementioned sorts of mobility (absolute mobility, relative mobility and income
risk). Nevertheless, in many studies it is not always clear why these measures are
selected (Headey and Muffels, 2003). As we want to compare wage mobility at the
macro or country level, we have transformed these measures of individual mobility
into measures of overall mobility in the society. At the aggregate level, absolute
individual mobility translates into economic growth; relative individual mobility into
income inequality or income dispersion, and income risk into income stability or
income security. Fields (2000), dealing with macro-level mobility, argues that
changes in the overall wage distribution might change the ranking of the individual in
the distribution without changing his absolute level of income. In metaphorical terms,
this is the question of what matters more: “changing rooms or rooms changing”
addressed by Fields (2000) and Van Kerm (2001). The type of rank mobility, where
individuals exchange their income positions while total income and overall income
dispersion remain the same, is known as “exchange” mobility. “Exchange” mobility
has to be distinguished from “structural” mobility that refers to the growth in absolute
income of all people or to the mobility emerging from the increase in the income
dispersion (Markandya, 1982; Markandya, 1982; Markandya, 1984; Fields and Ok,
the individual case, in a growth component (equal changes in the income of all
people) and a dispersion or inequality component (a change in the dispersion without
a change in the aggregate income of all people, Van Kerm, 2001).
2. Which mobility measure is most appropriate for the issue under study
The question now is what sort of mobility measure is most appropriate for the issue
under study. This paper investigates the role of macro-economic conditions, regime
type and labour market institutions in explaining cross-country differences in wage
mobility. These labour market institutions are shaped according to policies whose aim
is to raise the growth component and to reduce the dispersion and risk component of
wage mobility in a country. For this reason, relative positional mobility, which is
defined as the year-to-year change in the decile ranking, is chosen as our mobility
measure. The advantage of the measure is that it really takes into account all three
sorts of mobility components explained above: absolute (growth), relative (dispersion)
and exchange mobility, although we cannot disentangle them. This can be shown with
the following example:
Consider the case of a group of four people having wages in year 1 equal to
2,000, 3,500, 4,500 and 5,000 euros, respectively. Suppose that in year 2, the
individual that ranks originally highest in the wage distribution, has still a wage of
5,000 euros in year 2, but the secondly, thirdly and fourthly ranked individual in the
original distribution, have now wages of 6,900, 7,100 and 8,000 euros, respectively.
Thus, the highest ranked individual in year 1 has now lowest rank in the wage
distribution of year 2. In this example we could decompose the mobility into a
Year 1 Year 2
Initial
ranking
Growth Dispersion Exchange
Final
ranking
1 2,000 5,000 5,000 8,000 4
2 3,500 6,500 6,900 6,900 2
3 4,500 7,500 7,100 7,100 3
4 5,000 8,000 8,000 5,000 1
The growth component is the equal absolute change in income with 3,000 euros for all
people. The dispersion component results from a transfer of 400 euros from individual
3 to individual 2 and the exchange component is just an exchange of rank between
individual 4 and 1 without a change in the aggregate income.
The inability to decompose mobility into a growth, dispersion or exchange
component has likely to do with the fact that we only observe the rank change but not
how it emanates from changes in the underlying components. Moreover, since we
only measure rank changes, we cannot examine whether there is more upward or
more downward mobility in a particular country. For the same reason, our measure of
relative positional wage mobility renders little information about whether an increase
in it leads to an increase or decrease of levels of wage inequality. It informs us,
however, about the extent, at least in relative terms, of wage risk and wage volatility
people experience and hence, about the overall level of wage stability. The more
High rates of immobility therefore, signal a high persistence of wage inequality levels
over time.
Our measure of positional mobility
Our aggregate positional mobility measure is based on the year-to-year transitions of
working individuals across deciles of the wage distribution within each country1. Our
aim is particularly to explain the 10×10 table (Table 1), where cells represent
frequencies. The index for the rows denotes the decile position in year 1, while the
index for the columns represents the decile position in year 2. In a society with perfect
mobility (PM) all cells per row have the same value (
10
10
1 , ,
∑
=
= j j i
k i
x
x , for each
10 ,..., 1
=
k ), while in a perfectly immobile society (PI) all off-diagonal elements of
the table are zero (xij =0, if i≠ j). In our analysis, individuals whose destination
state differs up to one decile from the origin state are considered immobile, because a
transition of one decile could be the result of a light level of churning in the wage
distribution (see Table 1).
[Insert Table 1 about here]
Outline of the paper
The paper is organized as follows. In Section 3 the literature on the subject is
reviewed and some hypotheses about the dissimilarities in wage mobility patterns
1
In order to test for the sensitivity of our analysis with respect to the clustering of incomes in deciles
we repeated our analysis by clustering incomes in 20 categories. Results showed that country
across countries and welfare regimes are formulated. In section 4 the data and
sampling from the European Community Household Panel is discussed. Section 5
begins with commenting on the results of the estimation of the standard probit
regression. Further on, section 5 presents the results of the log-linear based restricted
multinomial logit model, which are compared to the probit regression outcomes. Two
models are estimated; the first one with country and another with regime type along
with selected macro-economic and institutional indicators. The models are evaluated
by comparing the parameter estimates, the fit indices and the explanatory power.
Finally, the business cycle and time effects are investigated with respect to their
contribution in explaining the observed country and regime type differences. The
main conclusions of the study as well as the issues for further research are discussed
in the last section of the paper.
3. Theory and research on wage mobility patterns across countries: hypotheses
Literature on wage mobility is rather poor compared to the amount of studies on
income mobility. Furthermore, studies on wage dynamics focus more on the issues of
wage growth, wage inequality and the volatility of wages over time rather than on
wage mobility as such. From a policy point of view, this is not surprising as
politicians are generally more concerned with fostering economic growth, reducing
inequality and increasing stability and security than with increasing wage mobility per
se. However, wage mobility seems to become a more important issue in both
economics and policy making. Politicians confronted with a sluggish labour market
contributes to a more competitive and efficiently operating labour market, which may
in turn raise productivity levels and therewith growth. (Table 2).
[Insert Table 2 about here]
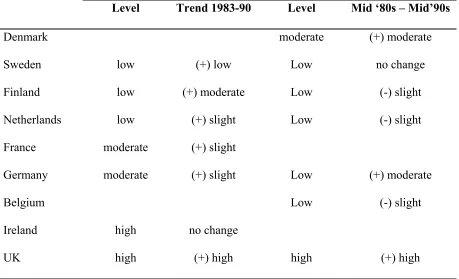
Apart from wage mobility, wage dispersion should be also investigated, as except for
the northern European countries, evidence to date suggests that from the mid 1980s
until the mid 1990s wage inequality has risen steadily, although at a different level, in
many Western countries. Specifically, from the mid 1980s on, wage inequality has
showed a diverse pattern; it increased strongly in the UK and in Portugal (Cardoso,
1998; 2004), but showed moderate increases in continental countries and no increases
or even decreases in Scandinavian countries (Gottschalk and Joyce, 1998; Aaberge,
2002; Acemoglu, 2003).
There are three leading theories for the explanation of these changes in the
wage patterns: the increased international trade and increased migration suggesting
that non-sheltered sectors in the US and in Europe face increased international
competition by less developed (low wage) countries, which has an adverse
downsizing effect on the wages of the low-skilled workers in these sectors (Borjas and
Ramey, 1995) ; the rapid skill-biased technological change, which explains the
increase in the dispersion of wages by the introduction and rapid spread of new
technologies and the resulting increase in the demand of high skilled workers at the
expense of their low skilled peers (Acemoglu, 2003; Acemoglu, 2003); the process of
deregulation or removal of labour market regulations and institutions that allows
wages to adjust more adequately and rapidly to market changes. This process of
swiftly to ongoing changes. The tendency in policy to promote flexibilisation by
removing institutional barriers to mobility is contented to account for the differences
in both the trends and the levels of wage inequality between the US, the UK and the
continental European countries (Blau and Kahn, 1996).
Gottschalk and Smeeding (1997) argue that much of the change in earnings
inequality occurred at the bottom of the distribution due to the sharp increase of the
skill premium for the better skilled. As Acemoglu (2002; 2003) has argued, the skill
premium happened to be much larger in the US than in Europe, because in Europe
supply responded more swiftly to the demand shifts caused by the process of
skill-biased technological change than in the US. Lee (1999) suggests that the erosion of
the minimum wage levels might account for the increase in wage inequality. It is
apparent, however, that this variety of causes is hardly examined in empirical
research, probably due to the lack of datasets and yardsticks to measure these complex
processes.
Dominant perspectives in economic theory argue that the ongoing changes in
the economy and in the labour market have resulted in a higher level of wage mobility
over time that has dampened the short-term shocks in wage inequality. Although
individuals are less income secure in the medium and long-term than they were in the
past as wages are more volatile, workers also possess more opportunities for moving
into a better-paid job. Ultimately, it is an empirical question how overall wage
mobility, in terms of wage growth and wage dispersion, is balanced against less
income security and stability. Nevertheless, whatever the balance is, there will be
winners and losers in this process dependent on the demand and supply relationships,
Recent studies show that increases in wage inequality are indeed not the result
of short-term shocks in the wage distribution. Dickens (2000) concludes that they
reflect a long-term increase in the wage disparities across individuals. He finds
evidence of high and increasing (since the 1970s) levels of immobility, especially
among the low-paid, in the UK. Burkhauser et al. (1997) conducted a comparative
study of earnings mobility in the US and Germany in the 1980s. Although, the welfare
systems and the labour markets of the two countries differ significantly, they find “a
great deal of persistence” and a similar pattern of mobility in these two countries.
Buchinsky and Hunt (1999) reached the same conclusion for the US, the country with
the most liberal labour market. Cappellari (2002), using panel data from the Survey on
Households Income and Wealth of the Bank of Italy, finds high levels of immobility
among the low paid Italian workers. Buchinsky et al. (1998) corroborate these results
for the French workers.
Comparative research
It is apparent that the literature concerning wage mobility patterns lacks a sufficient
amount of cross-country comparative studies. In the 1990s, much of the comparative
research in Europe was based on the LIS (Luxembourg Income Study) – a dataset that
contains data for various countries. This dataset includes data for different time
periods per country, although within the 1980s and the 1990s. The main disadvantage
of LIS is that it consisted of repeated cross-section data rather than panel data. As
researchers had no panel data – at least not for the majority of the countries – they
needed to restrict their analyses to one component of wage mobility only, i.e. wage or
earnings inequality. Later on, although panel data became available for a longer
and the UK2. Finally, with the establishment of the European Community Household
Panel (ECHP) a new and rich panel data source became available, covering 15
member states of the European Union. Despite of the fact that the ECHP started only
in 1994 and covered a relatively short period of eight years, up to 2001, we make use
this dataset as it covers a larger number of countries than any other longitudinal
dataset. For this reason, it is a much more powerful tool for examining the impact of
different institutional settings on wage mobility than any hitherto available.
The role of institutional constraints
There is a growing literature suggesting that labour market institutions and
employment protection regulations account for the dissimilar mobility patterns in the
labour market of different countries. Even when the institutions do not seem to differ
considerably across countries, the dissimilarities emerge more outspokenly across
particular clusters of countries. Countries with a more flexible labour market due to
relatively low levels of employment regulation, such as the UK and Ireland, are
believed to exhibit much more job and wage mobility than strongly regulated
countries such as the Southern European countries, namely Greece, Italy, Portugal and
Spain. This classification of countries according to the level of regulation seems to
coincide remarkably well with Esping-Andersen’s regime type classification (1990)
that was based on his socio-political account of welfare state policies during the 1960s
and 1970s and the degree of de-commodification (the level of public interference) by
which these policies set themselves apart from each other. Translated into the labour
2
Apart from these long-running national panels, some more national datasets, such as the Luxembourg
(PSELL) and Belgium panel (PBSH), were developed since the mid and late 1980s, but they were
market this de-commodification notion concerns the degree to which the labour
market is governed by laws, regulations (minimum pay, employment protection
regulations, collective wage bargaining, union density etc.) and public interventions
preventing the labour market from operating as a free market. Therefore, we will
examine to what extent the level of regulation contributes to explaining the
cross-country differences in wage mobility in Europe. In the employment report of (2003),
the European Commission already pointed out that the wage distributions of EU
member states seem to vary considerably due to differences that prevail among them
with respect to different kinds and levels of employment protection.
More concisely, we contend that countries characterized by a low public
interference and loose levels of employment protection legislation, denoted as liberal
regimes by Esping-Andersen, are likely to attain higher levels of job and wage
mobility. Southern European countries are believed to exhibit low levels of wage
mobility due to the strictness of their employment protection legislation and despite
the low union density. The segmented labour market of Southern European countries
safeguards primarily the position of workers in the internal labour market. Likewise,
low levels of wage mobility are expected in the continental European countries due to
their strongly regulated labour market, high union density and strict compliance with
collective wage bargaining. In Scandinavian regimes, notwithstanding the high union
density and the high level of compliance with collective wage bargaining, wages seem
to be more flexible than in the strongly regulated continental countries, although still
less flexible than the lowly-regulated labour markets of the liberal countries (Muffels
and Fouarge, 2002; Muffels and Luijkx, 2004).
Furthermore, we contend that in countries with high levels of minimum wages
wage mobility will be observed in the lower part of the wage distribution. On the
contrary, in countries with no or low levels of minimum wages, such as in the UK, we
expect higher levels of wage mobility at the lower ends of the distribution.
There are various ways to study the impact of institutional constraints; one is
to use the “regime type” approach and to examine the role of ”country clusters” in
explaining wage mobility patterns. Another is to start from the institutions and
regulations themselves and to examine to what extent they might have a bearing on
the observed mobility patterns. In the second approach, the effects of institutional
differences in terms of minimum wages, employment protection regulations, union
density, contract compliance and the wage bargain on wage mobility patterns are
observed. In this paper we also use the EPL-index as constructed by the OECD, which
is a direct measure for the strictness of employment protection regulation in a
country3. We would have preferred to include separate measures for minimum wage
levels, union density and contract compliance at the industrial sector level, had we
reliable sources to do so.
3
The OECD (2004) developed an index to measure the strictness of the Employment Protection
Legislation (EPL) in the various countries based on criteria concerning legislation on regular
employment, temporary employment and collective dismissal’. However, the OECD itself raised
doubts about the validity of the index because labour markets might react markedly different to the
introduction of similar policy measures and legislation. For example, the relaxation of restrictions
concerning fixed term employment in Spain and in Germany in the 1980s had rather dissimilar effects
on the labour markets in these two countries. The index does not also take into account the important
role of the informal sector in Southern Europe operating as a buffer against income losses due to
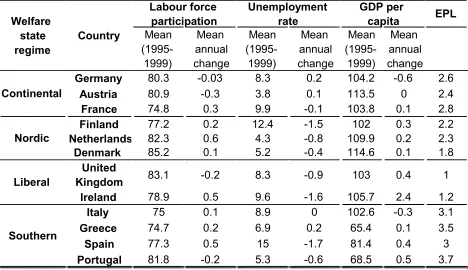
Macro-economic conditions and time
A further aim of our paper is to scrutinize the extent by which wage mobility is
affected by the business cycle. Therefore, we control for differences in the stage of the
business cycle across countries. To do that efficiently, we included several indicators
such as the unemployment rate, the yearly change of GDP per capita and the labour
force participation rate for males aged 16-64 (Table 3).
[Insert Table 3 about here]
Although we use it as an indicator for the level of wage regulation in a country and for
the extent that this regulation affects mobility patterns, “regime type” is still not a
static concept. The classification of a country to a specific regime type might change,
as wage regulations enacted through policies might shift over time. Due to these
changes in policies and to the response of labour markets to them, regimes tend to
converge or diverge over time. Therefore, it is important to study the evolution of
cross-country differences over time.
Job and employment characteristics
A third topic covered in the paper is to what extent prevailing cross-country
differences in wage mobility are associated with differences in the job and
employment structure. Workers in the public sector face usually lower job turnover
rates and experience relatively smaller wage changes, either upward or downward,
than private sector workers. The more workers are employed in the public sector the
lower wage mobility tends to be in a country. Workers with higher skills and
growth. In contrast, low educated workers are usually employed in low skilled jobs
with little opportunities to improve their wage prospects. Therefore, the more the
distribution of education and the reward to skills differ across countries the more the
wage mobility patterns tend to diverge.
4. Data, main concepts and descriptive analysis
We use the European Community Household Panel (ECHP), which has been designed
by EUROSTAT for income study purposes. It is a longitudinal database that contains
comparable socio-economic data for individuals and households from 15 European
countries for eight years, namely from 1994 to 2001. It includes information for
approximately 60,000 households and 130,000 individuals per wave (EUROSTAT,
2001). ECHP data were collected by the “National Collection Data Units” according
to a centrally designed questionnaire. However, some countries (Austria and Finland)
lack data for the first or for the first two waves, as they stepped in later. Due to
artifacts in the income data we excluded Belgium and Luxembourg. Sweden was also
excluded, as the ECHP database includes repeated cross-section rather than panel data
for this country. The first wave of ECHP (1994) was excluded from our analysis as, in
the view of EUROSTAT, the income data for the first wave (1994) are much less
robust than the data for the consecutive waves, also due to learning effects in dealing
with longitudinal data sources. Hence, our sample consists of 7 waves and 12
countries.
The sample is restricted to male wage earners between 25 and 55 years old,
appearing in the dataset for at least two subsequent years and declaring paid
reason for restricting our analysis to male employees is that females tend to have more
career breaks and more intermittent periods of temporary or permanent lay-off for
very different reasons than males (e.g. caring obligations). Thus, we cannot include
women in our analysis without controlling for the factors responsible for their
different career paths, which goes beyond the scope of this paper. We excluded men
younger than 25 years because most of them are in some kind of education. Men older
that 54 years are also excluded from the sample as they often participate in early
retirement schemes or reduce voluntarily working hours. Furthermore, due to our
focus on wage earners we excluded the self-employed and the unemployed. Finally,
in order to eliminate measurement error, individuals with extremely high and
extremely low wage incomes were excluded from our sample4.
Our basic unit of analysis is the working individual in the household and our
main economic variable is total income from employment. This is the total personal
net labour income after deduction of taxes and social contributions, with the reference
year being the year prior to the survey. In order to construct our sample, we rank the
wage income of individuals according to their decile position within a country and we
examine the transitions between decile positions in year t and t+1. Our sample
population consists of 12,709 individuals for the first pair of years (1995-1996),
13,746 for the second (1996-1997), 13,193 for the third (1997-1998), 15,379 for the
fourth (1998-1999), 14,533 for the fifth (1999-2000) and 14,173 for the last
(2000-2001)5.
4
Specifically, we excluded individuals having less than 10% and more than 3,000% of the median
wage income.
5
From now on the time points of our analysis will correspond to the year from which the data come
from. For example when we refer to time point 1998-1999 data come from wave 7 (1999-2000) of the
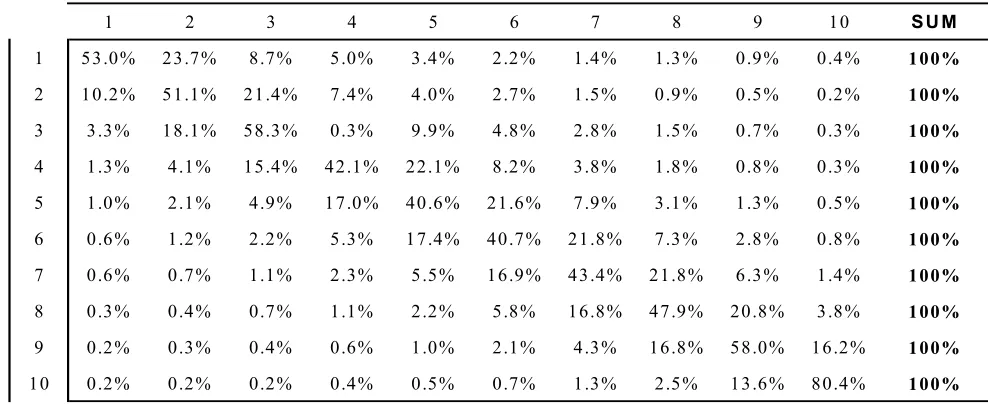
Descriptive analysis
A rough overview of the decile transitions workers experience can be observed
in Table 4. This table presents origin-destination transitions pooled across countries
and time periods. Observations seem to be concentrated along the main diagonal
especially at the corners of the table. As we move away from the diagonal,
frequencies become significantly lower. Therefore, the main finding of this table is
the significant amount of persistence, especially at the low and high wage strata. Low-
and high-wage earners seem to be experiencing hardly any wage change in a one-year
period.
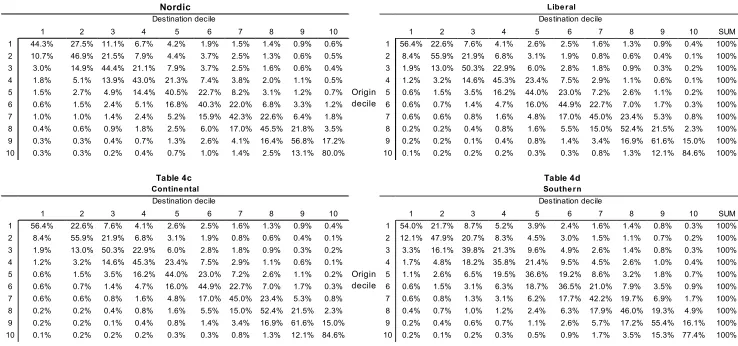
The relevant tables by welfare regime (Tables 4a-4d) reveal some interesting
differences. Contrary to our expectations, wage earners in the Nordic countries
(including the Netherlands) are apparently more mobile than average, while workers
from the lowly regulated (liberal) countries, are seemingly less mobile than average.
In the Southern welfare regimes immobility rates appear lower than average at least in
the higher income strata.
[Insert Table 4 and Tables 4a-4d about here]
The data that we use in our analysis consists of a separate observed transition table per
country (12 countries), time (6 time points: 1994-1995 up to 1999-2000), sector (2
sectors: private and public), and education (3 groups: lower than high school, high
school and higher education) combination. As information on two countries is missing
for the first time point and on one country for the second time point, we have in total
these transition matrices, deciles were defined per country and time period
combination, which means that same definition applies across education and sector
groups (within country-time combinations).
5. Models for explaining wage mobility patterns according to the transition
matrices
A simple probit analysis
The method for analyzing the 414 10-by-10 transition tables needs to allow the
detection of differences in relative positional wage mobility patterns across a large
number of tables. The method should therefore be able to detect differences across
countries (or regimes), time points, education groups and employment sectors in the
tendency of individuals to move more than one decile in the wage distribution. Below
we present a log-linear variant of the multinomial logit regression model that can be
used for this purpose, but first we perform a simpler analysis, using a standard probit
regression model that can serve as a benchmark for the other models. The
dichotomous outcome variable indicates whether a change of more than one decile
occurred or not. Country, time, time-country interaction, education and sector are used
as categorical predictors in this probit regression.
[Insert Table 5 about here]
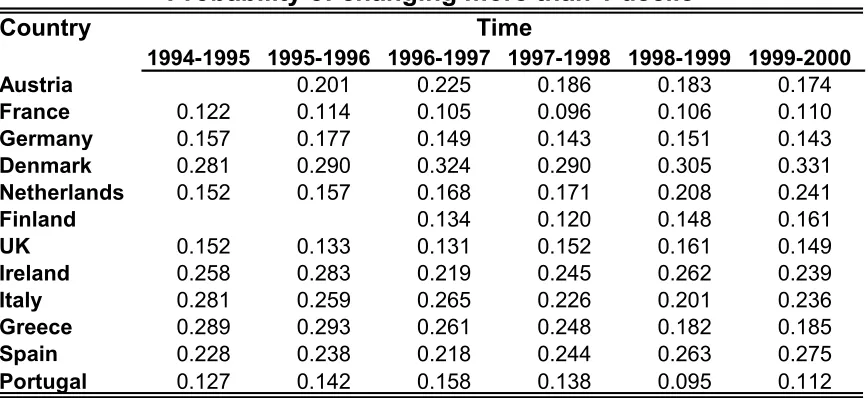
Rather than reporting all the details about the obtained parameter estimates,
we summarize the main results in Table 5 as represented by the estimated average
combinations of country and time period. As can be seen, the highest probability of
changing more than one decile in the wage distribution is found initially for Denmark,
Italy and Greece, while the lowest rates are found for Portugal and France. Within the
period of reference, however, the rank of countries changes: at the end of this period,
Denmark, Ireland and Spain rank first while Portugal, France and Germany come last.
By summing up the results with respect to welfare regimes, we observe that in
southern European countries individuals face high (with the exception of Portugal)
and decreasing (with the exception of Spain) levels of wage mobility. Nordic
countries present either high (Denmark) or initially low but strongly increasing (the
Netherlands and Finland) rates of wage mobility. Estimates for countries of the
continental regime are situated somewhere in the middle (except for France that ranks
lower) but they are uniformly decreasing. For the lowly regulated labour markets of
the UK and Ireland we get contradicting results as Ireland has very high levels of
wage mobility, while the UK has unexpectedly significantly lower levels. In both
countries however, the probability of changing more than one decile does not change
significantly during the reference period.
A restricted multinomial logit analysis
A limitation of this rather simple probit regression analysis is that all types of
transitions are pooled; that is, it does account neither for the origin state from which a
transition takes place, nor for the size or the direction of a transition. The analysis
could be refined by doing a separate analysis per origin state and per direction of the
move, and by taking into account the size of the move, for example, by means of an
ordered probit model. This would, however, require many separate regressions. For
analysis. This method includes the application of a variant of the multinomial logit
model that makes use of log-bilinear restrictions from the log-linear analysis field.
We specify a multinomial logit model for the probability that an individual is
in a particular destination (D) state (decile) given his origin (O) state (his state in the
previous year) and the subgroup (G) to which he belongs. This probability will be
denoted by P
(
D=d |O=o,G= g)
. With the term subgroup we mean one of theaforementioned 414 time, country, education, and sector combinations. The basic
structure of the multinomial logit model we use is
(
)
(
)
(
)
∑
= + + = = = = 10 1 | | | | | | | | exp exp , | i G OD g oi G D g i G OD g od G D g d g G o O d D P β β β βThis model contains two types of regression parameters: βdD|g|G and βodOD|g|G. The
term βdD|g|G is an intercept term for the destination state D=d that may differ across
subgroups. The other parameter - βodOD|g|G- captures the strength of the
origin-destination association that may also differ across subgroups. In our application, the
term of main interest is this origin-destination association term. This size of this term
indicates the amount of mobility (the smaller the association between the origin and
destination state, the more mobility). What we are especially interested in is how
much the size of this term varies across subgroups defined by country, time, sector,
and education. However, if we would not further restrict the βodOD|g|G term, we would
have to estimate and interpret 81 (=9*9) association parameters for each of the 414
tables, which is, of course, not meaningful. For such situations, where there is a large
number of association parameters (here 81) that vary across large numbers of
for specifying parsimonious higher-order interaction terms. These methods involving
the use of bilinear decompositions have been applied among others in the analysis of
mobility tables (Hout, 1983; Luijkx, 1994; Vermunt, 1997; Goodman and Hout, 1998;
Goodman and Hout, 2001). In our case, the following bilinear decomposition is
used:βodOD|g|G =aodOD +bodOD ⋅φgG. This decomposition implies that the various tables have
a common component aodOD, which serves as a kind of intercept or overall mean
association term. The other component bodOD ⋅φgGcaptures the differences in the
origin-destination associations across tables, where the parameters bodOD can be regarded as
“slopes” of the explanatory variables’ effects; they indicate in which parts of the
mobility table the largest differences across subgroups occur. The term φgG is a
scaling factor indicating whether mobility is higher or lower than average in a
particular subgroup. In other words, differences in mobility across tables are
described by a single coefficient per table. For reasons of normalization, we have to
impose a location and a scaling restriction on the φgG parameters. Here, we will use
0 =
∑
g G g
φ and
∑
( )
2 =1 gG g
φ , which implies that the φgG parameters are centered and
restricted to have a sum of squares of 1. For our analysis, we made use of the program
LEM (Vermunt, 1997).
[Insert Table 6 about here]
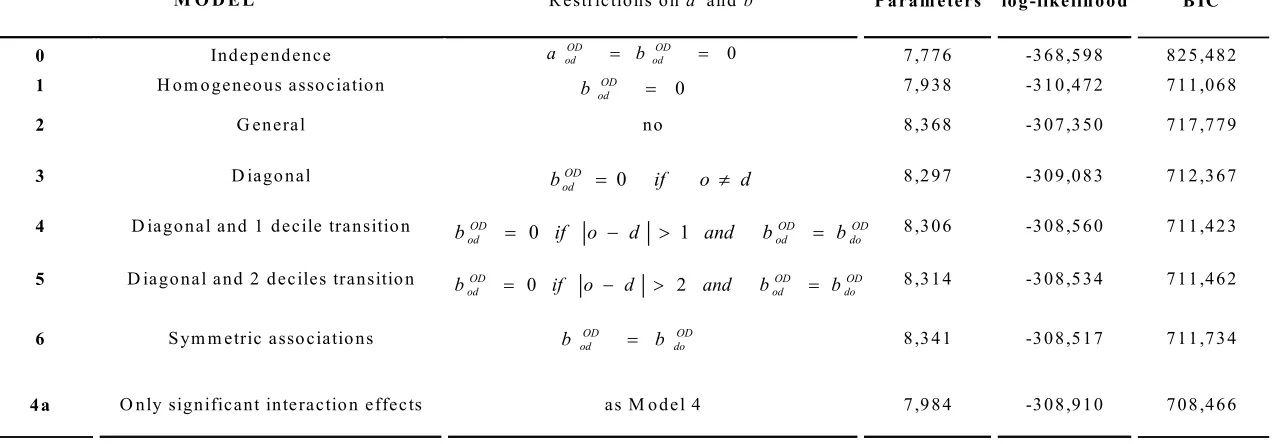
Table 6 illustrates the values of the log-likelihood function and the BIC
obtained by the various models that were estimated. The first two models serve as
zero, which yields a model in which the destination state is assumed to be independent
of the origin state. Model 1 assumes that bodOD is equal to zero for each o-d
combination, yielding a homogeneous association model. Comparison of the
log-likelihood and BIC values of Models 0 and 1 shows that the origin and destination
states of individuals in the wage distribution are strongly correlated. Model 2, in
which we use the bilinear decomposition described above, fits much better than
Model 1 in terms of the log-likelihood, indicating that the origin-destination
association is not equal across tables. In Models 3 to 6, we use several simplifying
assumptions for the term bodOD. Among these models, the model that fits best
according to the BIC criterion, Model 4, contains only nonzero bodOD parameters for
the main diagonal and the first subdiagonals, while the subdiagonal parameters are
also restricted to be symmetric (equal for upward and downward moves across the
two same states). This model does not only present the best fit to the data according to
the statistical indices, but it is also straightforward in its interpretation; Model 4
captures country differences in immobility (i.e., in the probability of changing at most
one decile), which makes the results somewhat comparable with the results obtained
by the probit regression. The added value of the multinomial logit analysis is its
ability to discern cross-country differences in various parts of the wage distribution.
Nevertheless, Models 2-6 fit worse than the homogeneous model (Model 2) in
terms of the BIC. This is probably due to the large number of parameters included in
these models. Therefore, a more parsimonious version of Model 4 (Model 4a) was
employed in which insignificant predictor effects have been omitted6. Model 4a fits
much better than the homogeneous model in terms of log-likelihood and BIC values.
Findings for model 4a seem to establish the existence of differences in
origin-destination association between tables defined by the predictors.
[Insert Table 7 about here]
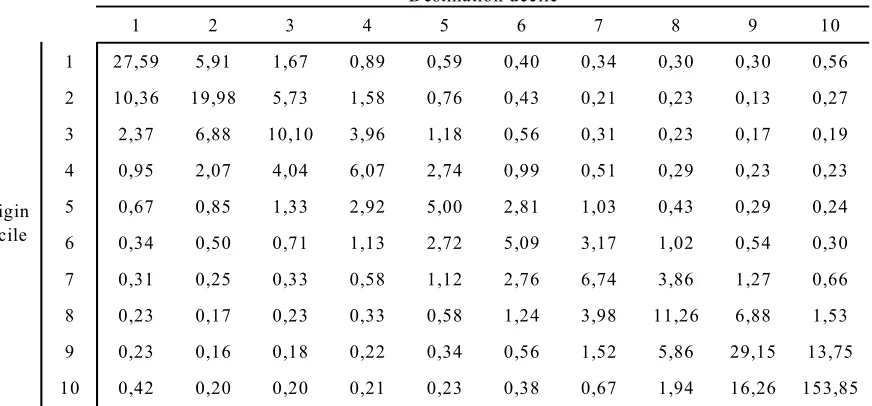
Results of the multinomial logit regression
Table 7 reports the overall association terms – in their multiplicative form exp( OD) od
a –
as obtained with Model 4. The numbers indicate how much more likely the
“transition” concerned is compared to the perfect mobility situation. Perfect mobility
is defined as the situation in which the origin and destination states are independent of
one another. As can easily be seen, observations tend to be concentrated along the
main diagonals, indicating large immobility. Moreover, even if the huge parameter
estimates for cells (1,1) and (10,10), which may be the result of ceiling effects, are
ignored, the bottom right and the upper left part of the table still contain the largest
coefficients. This indicates that the highest levels of immobility emerge in the lower
and especially in the higher parts of the wage distribution. For example, an individual
being in the second lowest decile of the wage distribution in year t is almost 20 times
more likely to remain in the same decile in year t+1 than expected under perfect
mobility. In contrast, workers with wages in the middle part of the wage distribution
are more likely to change their position in a one-year period. However, transitions of
more than one decile are rather rare in the whole range of the distribution. Our results
demonstrating that both low- and high-paid employees will almost surely retain their
rank in the wage distribution in the subsequent year and that workers in the middle
income classes face limited chances of improving or worsening their position are
Guillotin et al., 1998; Buchinsky, Fougere et al., 1998; Cappellari, 2000; Dickens,
2000; Hofer and Weber, 2002).
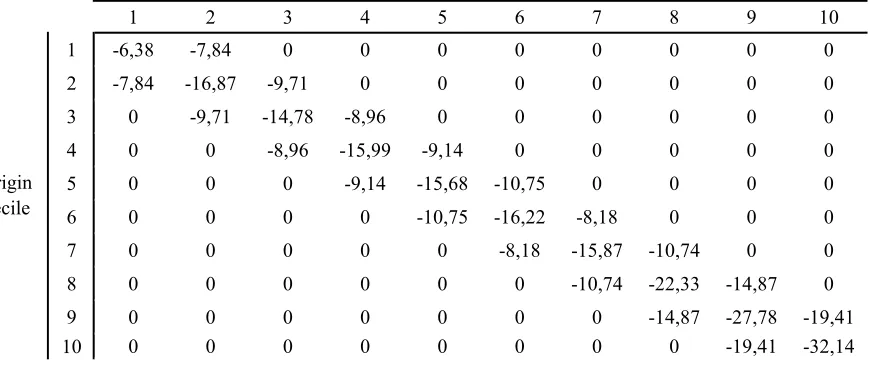
[Insert Table 8 about here]
The next question that has to be addressed is how much the pattern presented in Table
7 differs across countries and whether these cross-country differences evolve with
time and vary across personal and job characteristics. In Table 8 the estimates for the
OD od
b coefficients obtained with Model 4 are presented. Each of the coefficients that
was not a priori fixed to zero takes on a negative value; therefore these coefficients
denote the tendency towards more mobility. This implies that a positive G g
φ value
corresponds to more wage mobility than average in the table concerned. The pattern
of the estimates for bodOD shows that differences across subgroups (countries, time
points, education and sector groups) are largest with respect to the mobility in the
higher (-32.14) than in the lower (-6.38) wage deciles.
[Insert Table 9 about here]
The 414 G g
φ coefficients obtained with Model 4 describe the differences across
countries, time points, education groups, and sectors of employment. However, the
interpretation of all G g
φ coefficients is still unfeasible due to their large number.
Therefore, G g
φ coefficients were subjected to a further analysis in order to discern
which of the main and interaction effects included among them, are worth to be
(ANOVA) was performed, the results of which are reported in Table 9. The first result
is that the higher-order interaction terms are of little importance as the model with
main effects and two-way interaction effects explain 77.6% of the variance in the G g
φ
terms. Secondly, country is by far the most important factor in the explanation of
mobility differences across tables (its main effect accounts for 51.3% of the total
variance). This might be an important result as it shows that it is not so much the
common trends and structural factors explaining the dissimilarities in wage mobility
but foremost the particular country characteristics indicating the relevance of
institutional, socio-economic (education, demography, employment structure) and
also cultural explanations. Moreover, we find that differences between the mobility
patterns in the public and private sector are important determinants of the observed
variance (5.3%). Although the time effect is not significant, the country-time
interaction component is and it explains about 8.7% of the variation. Similar are the
findings for education; even though no direct education effects are found, the country
– education interaction effect explains a significant part of the overall variance (4.6%)
indicating that differences in the education systems across countries constitute part of
the explanation. This might resemble the impact of the knowledge economy and the
positive effects investments in higher education exert on levels of wage mobility and
therefore on economic performance. Also sector and the country-sector interaction
explain a noticeable part of the variance. Again this might point to the significant
impact the employment structure might exert on the wage mobility patterns.
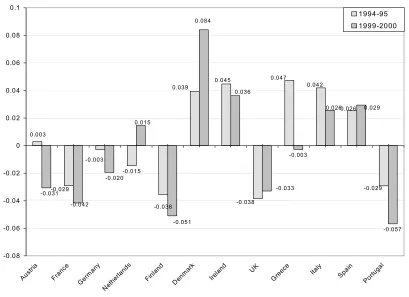
Figure 1 depicts the mean value of G g
φ per country in the first and in the last
time point. As can be observed, there is no clear pattern that could associate
cross-country differences with welfare state regimes. The hypothesis that in less regulated
countries individuals experience higher levels of wage mobility is confirmed in the
case of Ireland but has to be rejected in the case of the prototype lowly regulated
country in Europe, the UK, where wage mobility seems to be much lower than
expected and also lower than in most other EU countries. This is probably due to the
fact that the Irish economy experienced a major boost during the 1990s. The
difference in economic performance between Ireland and the UK is clearly depicted in
table 3. In most southern European countries, which – according to the OECD’s EPL
index – have a rather high level of employment protection, wage mobility seems to be
higher than we predicted. Given their segmented labour market, this might point to a
high level of in-firm wage mobility in these countries. However, Portugal, exhibits the
lowest level of wage mobility of all European countries. Except for Portugal and the
UK, low levels of wage mobility are found for France and Finland, which are
classified as belonging to the strongly regulated continental regimes or, as Finland, to
the rather flexible Nordic countries. Finland therefore seems not to fit particularly
well in this Nordic picture, probably due to a much less flexible labour market than its
peers in this cluster and due to its underperforming economy during this period. The
picture for Denmark, as being part of the Nordic cluster with one of the highest levels
of wage mobility, confirms our prior conjectures with respect to this regime. This
might be explained by the fact that the Danish labour market seems to be particularly
successful in combining high levels of flexibility, while safeguarding simultaneously
appropriate levels of income and work or employment security through active and
regimes of Austria and Germany seem to position themselves somewhere in the
middle of the league table of countries according to the level of regulation and the
balance of flexibility and income and work security that they were able to attain. A
similar position is taken by the Netherlands that we classified as also belonging to the
Nordic cluster, with medium levels of regulation and a fairly favourable balance
between wage flexibility and income and work security..
In Figure 1, it can be seen that the ranking of countries with respect to the
levels of wage mobility varies during the observation period. In the strongly regulated
countries wage mobility decreases (steeply in Germany and Austria), whereas in the
Nordic countries, with the exception of Finland, that exhibit a better record in
balancing mobility and income security goals, a significant increase in the levels of
wage mobility can be observed. What we might learn from this is that the better
countries are capable of creating a flexible labour market with safeguarding
appropriate levels of income and work security (income stability) the better their
economic and employment record tends to be. Further to this, it appears that the more
regulated the labour market is, as the results for the Southern European countries, with
the exception of Spain show, the more likely it is to suffer from a lower wage mobility
growth, or even worse to be confronted with steeply declining mobility rates. In lowly
regulated regimes of the UK and Ireland, on the other hand, there is yet no clear and
strong pattern, as in Ireland we observe a decrease in wage mobility whereas in the
UK an increase took place but starting from rather low levels of mobility.
As Figure 2 illustrates, the estimates for the sector of employment confirm our
prior expectations: Individuals working in the private sector experience higher levels
of wage mobility than individuals working in the shielded public sector. Moreover,
these differences increase during the observation period. However, comparing the
sector effects across countries, some unexpected outcomes emerge: although wage
mobility is lower in the public sector than in the private sector in most countries, this
is not the case for Ireland, which belongs to the lowly regulated (liberal) cluster.
Though we expect high rates of wage mobility in particularly the private but also the
public sector in the UK, we observe markedly less mobility in the public than in the
private sector. For the southern European countries our conjectures are confirmed, as
the public sector exhibits much more immobility than the private sector. In the highly
regulated continental and rather flexible Nordic cluster the levels of wage mobility in
the private sector always exceeds the levels in the public sector.
[Insert Figure 3 about here]
Figure 3 demonstrates that the impact of education levels differs across
countries. Highly skilled employees exhibit more wage mobility than their less
educated peers in France, Germany, the Netherlands, Finland, the UK and Greece. In
contrast, lower levels of education qualifications are associated with more wage
mobility in Austria, Italy, Spain and especially in Denmark. No clear pattern is found
in Ireland and Portugal. These results indicate that we have to be cautious to draw far
reaching conclusions on the basis only of these partial analyses, as levels of education
are not very well measured in surveys and are very difficult to compare due to the
[Insert Figure 4 about here]
Educational effects, however, do not only vary across countries but also
between sectors of employment. Figure 4 suggests that higher education is rewarded
in terms of more wage mobility in the public sector but not in the private.
These macro-level analysis however tend to confirm the findings of
micro-level analyses of many other researchers showing that investments in human capital
formation pay off in terms of raising the employment opportunities, career
opportunities and wage prospects but seemingly, though not unconditional, also in
terms of higher wage mobility.
[Insert Table 10 about here]
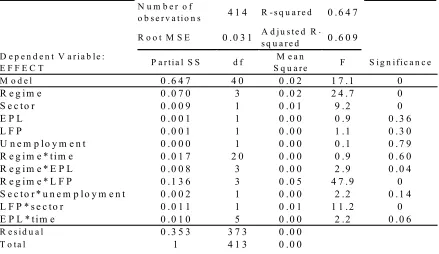
Testing for the effects of regime type macroeconomic conditions and labour market
regulations
The results presented above indicate that countries belonging to the same country
cluster do not necessarily show similar mobility patterns. In order to obtain a more
formal test as to whether the regime type variable explains differences in wage
mobility, we performed the same ANOVA as before, but now with country replaced
by regime type. Moreover, we added to the model four macroeconomic and
employment protection indicators as covariates: the Labour Force Participation rate
for men between 15-64 years old (LFP), the unemployment rate for males, the GDP
per capita (GDPpc) and the OECD’s Employment Protection Legislation index. The
overall explained variance rises to 64.8%; the main effects of economic welfare,
others. We also include the interaction effects between regime type and EPL, EPL and
time, EPL and LFP and LFP and sector. Compared to our previous findings as
reported in Table 9, regime still seems to explain a significant part of the country
variance indicating that the way flexibility and income and work security is balanced
plays a role in explaining country differences even after controlling for a number of
important macro-economic and employment indicators. We also find that the effect
of employment sector remained significant after controlling for these variables.
Furthermore, the outcomes show that although the macroeconomic indicators and
EPL on their own account are seemingly not very significant determinants of wage
mobility, they still seem to contribute to explaining a large part of the country
differences and particularly the evolution of these differences over time.
The results reported in Table 10 indicate that our regime model explains a
significant part of the cross-country variation (77.6%). If we compare a model with
regime and the viable interaction effects with time to a similar model with regime
replaced by country the explained variance is about 94% of the explained variance in
the country case7. This shows that the regime cluster classification is indeed an
excellent candidate for explaining most of the country variance. Macroeconomic
conditions explain apparently only a small part of the country variation but the
findings reveal that they take over the interaction effect of country with time if that
variable is removed from the model. For this reason and since the explained variance
is reduced only slightly, we might safely assume that the macroeconomic conditions,
although not particularly significant for the country variation itself, are particularly
relevant for explaining the evolution of wage mobility differences across countries
over time. The rising wage mobility levels, which we observed over time, coincide
apparently with a favourable economic development in a number of European
countries during the late 1990s.
It turned out that the main effects of the labour force participation and
employment protection legislation variables are insignificant whereas the relevant
interaction effects with regime are both significant. This suggests that the labour force
participation and employment protection legislation variables exert their effects on
wage mobility variance across countries mainly because of its strong variation within
the various regime types across countries.
[Insert Figure 5 about here]
Figure 5, shows that the ranking of welfare regimes varies across time points. The
only expectation that is clearly confirmed is that wage mobility levels in the strongly
regulated regimes (continental European countries) are lower than in all other
regimes. In the southern strongly regulated regimes, wage mobility was initially high
in the beginning of the period, in 1994-95, but decreased considerably thereafter until
1998-1999 to rise again in the years after. In the Nordic countries, the wage mobility
was initially quite high, up to 1996 but decreased, to catch up again strongly up to
1999. In 1999-2000 it even ranked first with respect to the wage mobility level among
all regimes. Individuals from the very flexible liberal welfare regime experience
larger rates of wage mobility than individuals from the strongly regulated continental
regimes but lower rates than the Nordic regime. It should, however, be noted that we
should be cautious in drawing conclusions on the basis of these regime findings only,
since our evidence also shows that there are large cross-country differences within the
during the economic upturn period in the mid and late 1990s, wage mobility rates tend
to decline unexpectedly and to recover only at the very end of the period but for two
regime clusters only, namely the Nordic and the Southern countries. The slow wage
mobility growth during this period might be due to the commonly rather low levels of
flexibility and job mobility in the European labour markets.
6. Conclusions
In this paper we examine wage mobility patterns across countries and over time.
We applied restricted multinomial logit regression models to investigate cross-country
differences in relative positional wage mobility in Europe, using data from the ECHP
for 1995-2001. The method we applied was sufficiently powerful to allow us to
control for the full set of origin states of individuals in the year-to-year transitions. It
also was flexible enough to impose a variety of restrictions to the association
parameters of our model, which enabled us to interpret the covariate effects and their
time patterns. Both properties of our approach are unique compared to the standard
(probit) regression techniques, which we also applied and compared our results with.
Our findings suggest that although the clustering of countries in welfare regimes
can account for a discernible part of cross-country differences in wage mobility,
significant variation remains within the regime clusters. Cross-country variation is
also only partially captured by differences in the macroeconomic conditions (business
cycle effects) and the strictness of employment protection legislation, even though
these variables seem to exert a significant effect on wage mobility differences.
Regimes seem to play no particularly important role here while the evidence shows
type. The lesson to be learned from it is that welfare regime and these macro-level
variables not only tell us different parts of the story on the role of economic
conditions and institutions on wage mobility, but also that separate indicators for
institutional variation across countries such as the one on employment protection need
to be taken into account.
Many of our expectations are not confirmed. As in previous studies, we find a
strong state dependence for the lowest and the highest strata of the wage distribution.
A low wage earner jumping to a highly paid managerial job, or a firm manager with a
very high wage degraded to a minimum wage worker is a rather unlikely event. No
deviation from this rule is observed in the liberal countries (especially in the UK). In
the liberal regime, where the labour market is flexible and institutional constraints are
absent, increased income risks do not seem to go hand-in-hand with better wage
prospects for workers. On the contrary, we find that more flexibility of wages emerges
unexpectedly in the Nordic countries (Denmark leading). When the strictness of
employment protection legislation is high, as it is in Southern countries, we expect
low levels of wage mobility but that appears not necessarily to be the case. Southern
European countries (with the notable exception of Portugal) rank first with respect to
their level of wage mobility in most time points. We might assume that a low level of
wage mobility on the external labour market might be counterbalanced by a high level
of in-firm or in-job wage mobility. Another hypothesis that might be put forward here
involves the typical employment structure of the Southern regime with more
self-employment and a large informal sector that might also exert a similar up-levelling
effect on wage mobility. An important finding is that our conjectures with respect to
the strictly regulated countries are largely accepted as the strongly regulated labour
Our findings are in accordance with our predictions when investigating wage
mobility among certain population subgroups. The public sector is found to be a safe
resort for risk-averse individuals, as wage fluctuations are in this sector much
smoother than in the private sector.
This paper had the intention to render an improved insight into cross-country
differences in wage mobility over time. Our particular interest went to the role of
institutional factors and we concluded that although welfare regime in itself is an
important concept to explain cross-country differences, it only tells part of the story
on the role of institutional differences on wage mobility patterns in Europe. Separate
or more detailed measures of institutional variation are needed to account for the
cross-country variation in wage mobility. We used a rather different methodological
approach than has been used to date, but the results partly confirmed what others
found, and partly rendered new insights into the role of these institutional phenomena.
We addressed the question of state dependence and heterogeneity by using transition
matrices analysis techniques, which we called restricted multinomial regression and
References
Aaberge, Rolf. "Income Inequality and Income Mobility in the Scandinavian
Countries Compared to the United States." Review of Income and Wealth
48(4): 443-470, 2002.
Acemoglu, Daron. "Technical Change, Inequality, and the Labor Market." The
Journal of Economic Literature 40(1): 7-72, 2002.
- "Cross-Country Inequality Trends." Economic Journal 113: 121-149, 2003.
- "Patterns of Skill Premia." The Review of Economic Studies 70(2): 199-230, 2003.
Bigard, A., Y. Guillotin and C. Lucifora. "Earnings Mobility: An International
Comparison of Italy and France." Review of Income and Wealth 44(4):
535-554, 1998.
Blau, Francine D. and Lawrence M. Kahn. "International Differences in Male Wage
Inequality: Institutions Versus Market Forces." The Journal of Political
Economy 104(4): 791-837, 1996.
Borjas, George J. and Valerie A. Ramey. "Foreign Competition, Market Power, and
Wage Inequality." The Quarterly Journal of Economics 110(4): 1075-1110,
1995.
Brickman, Philip, Dan Coates and Ronnie Janoff-Bulman. "Lottery Winners and
Accident Victims: Is Happiness Relative?" Journal of Personality and Social
Psychology 36, 1978.
Buchinsky, Moshe, Denis Fougere and Francis Kramarz. "Wage Mobility in France:
1967-1987." Revue Economique 49(3): 879-890, 1998.
Buchinsky, Moshe and Jennifer Hunt. "Wage Mobility in the United States." Review
Burkhauser, Richard V., Douglas Holz-Eakin and Stephen E. Rhody. "Labor Earnings
Mobility and Inequality in the United States and Germany During the Growth
Years of the 1980s." International Economic Review 38(4): 775-794, 1997.
Cappellari, Lorenzo. "Low-Wage Mobility in the Italian Labour Market."
International Journal of Manpower 21(3-4): 264-290, 2000.
- "Do the 'Working Poor' Stay Poor? An Analysis of Low Pay Transitions in Italy."
Oxford Bulletin of Economics and Statistics 64(2): 87-110, 2002.
Cardoso, Ana Rute. "Earnings Inequality in Portugal: High and Rising?" Review of
Income and Wealth 44(3): 325-343, 1998.
- Wage Mobility: Do Institutions Make a Difference? A Replication Study
Comparing Portugal and the Uk. London, Centre for Economic Policy
Research, Discussion Paper Series, 2004.
Dickens, Richard. "Caught in a Trap? Wage Mobility in Great Britain: 1975-1994."
Economica 67(268): 477-498, 2000.
Duesenberry, James S. Income, Saving and the Theory of Consumer Behavior.
Cambridge, Mass., Harvard University Press, 1967.
Easterlin, Richard A. Does Economic Growth Improve the Human Lot? Nations and
Households in Economic Growth : Essays in Honour of Moses Abramovitz.
M. Abramovitz, P. A. David and M. W. Reder. New York, London, Academic
Press: 411, 1974.
Esping-Andersen, Gosta. The Three Worlds of Welfare Capitalism. Oxford, Polity
Press, 1990.
European Commission. Employment in Europe 2003: Recent Trends and Prospects.
EUROSTAT. Echp Udb Manual, European Community Household Panel
Longitudinal Users' Database, Waves 1 to 5, Survey Years 1994 to 1998,
EUROSTAT, 2001.
Fields, Gary. "Does Income Mobility Equalize Longer-Term Incomes? New Measures
of an Old Concept." Unpublished, Cornell University, 2000.
Fields, Gary and Efe A Ok. The Measurement of Income Mobility: An Introduction to
the Literature. Handbook of Income Inequality Measurement. J. Silber.
Deventer, Kluwer: 557-596, 1999.
Fritzell, Johan. "The Dynamics of Income Distribution: Economic Mobility in
Sweden in Comparison with the United States." Social Science Research 46:
17-46, 1990.
Goodman, Leo and Michael Hout. "Statistical Methods and Graphical Displays Fot
Analysing How the Association between Two Qualitative Variables Differs
among Countries, among Groups or over Time: A Modified Regression-Type
Approach." Sociological Methodology 28: 175-230, 1998.
- "Statistical Methods and Graphical Displays Fot Analysing How the Association
between Two Qualitative Variables Differs among Countries, among Groups
or over Time: A Modified Regression-Type Approach. Part Ii: Some
Exploratory Techniques, Simple Models and Simple Examples." Sociological
Methodology 31: 189-221, 2001.
Gottschalk, P. and M. Joyce. "Cross-National Differences in the Rise of Earnings
Inequality: Market and Institutional Factors." Review of Economics and
Gottschalk, Peter and Timothy M. Smeeding. "Cross-National Comparisons of
Earnings and Income Inequality." Journal of Economic Literature 35(2):
633-687, 1997.
Headey, Bruce and Ruud Muffels. Policy Goals and Outcomes in 'Three Worlds of
Welfare Capitalism.' Schmollers Jahrbuch: Journal of Applied Social Science
Studies. 123: 27-41, 2003.
Hirsch, Fred. Social Limits to Growth. London, Routledge, 1995.
Hofer, Helmunt and Andrea Weber. "Wage Mobility in Austria 1986-1996." Labour
Economics 9(4): 563-577, 2002.
Hout, Michael. Mobility Tables. London/new Delhi, Sage Publications, 1983.
Luijkx, Ruud. Comparative Log-Linear Analyses of Social Mobility of Social
Mobility and Heterogamy. Tilburg, Tilburg University Press, 1994.
Markandya, Anil. "Intergenerational Exchange Mobility and Economic Welfare."
European Economic Review 17(3): 307, 1982.
- "The Measurement of Earnings Mobility among Occupational Groups." Scottish
Journal of Political Economy 29(1): 75-88, 1982.
- "The Welfare Measurement of Changes in Economic Mobility." Economica 51:
457-471, 1984.
Muffels, Ruud and Didier Fouarge. "Working Profiles and Employment Regimes in
Europe." Schmollers Jahrbuch 122(1): 85-100, 2002.
Muffels, Ruud J. A. and Ruud Luijkx. Globalisation and Male Job Mobility in
Europe. Globalisation and Job Mobility over the Life Course of Men. H.-P.
Blossfeld. Tilburg/Oxford, Tilburg University/Nuffield College, 2004.
OECD. Employment Outlook. Paris, OECD, 1999.
Runciman, W.G. Relative Deprivation and Social Justice: A Study of Attitudes to
Social Inequality in Twentieth-Century England. Berkeley, University of
California press, 1966.
Van Kerm, Philippe. Essays on Income Mobility and Income Distribution Dynamics.
Namur, Facultes Universitaites Notre-Dame, 2001.
Vermunt, Jeroen K. Lem: A General Program for the Analysis of Categorical Data.
Tilburg, Tilburg University, 1997.