BER Performance Analysis for Optical Communication
using DPSK Modulation
Md. Mobarok Hossain Rubel
Lecturer,
Dept. of Electrical and Electronic Engineering Leading University, Sylhet.
Syed Golam Mahmud
Lecturer,
Dept. of Electrical and Electronic Engineering Leading University, Sylhet.
ABSTRACT
In this paper we study and analyze Bit Error Rate (BER) performance for optical communication system using Differential Phase Shift Keying (DPSK) modulation scheme. Specifically, after developing an approximate form BER expression, we study the BER performance for different system parameters such as fiber length, gain and number of amplifier. With the aid of analysis and simulation results we demonstrate the influence of different system parameters on the BER performance of an optical system using differential modulation schemes.
Keywords-
Optical Communication, BER, DPSK, FiberLength, Bit Rate, Fiber Gain.
Major Area-
Communication and Network, SignalProcessing for Communications, Optical Fiber
Communication.
1.
INTRODUCTION
Recently Differential Phase Shift Keying (DPSK) has been proved to be well suited for high spectral density transmission even at transoceanic distances [6, 13]. This modulation technique also exhibits a large tolerance to inline cumulated dispersion for distances up to 13000 km [2, 8]. Considering these two key characteristics we can assume that DPSK might be a good candidate for upgrading the already installed submarine links [11]. Usually, typical lines are made by nondispersion flattened fibers where nondispersion, ranging from -6000 ps/nm to +-6000 ps/nm, can be observed over the whole C-band for a 5000 km link [2, 9]. This aspect is fundamentally different from another 40 Gb/s Return Zero (RZ)-DPSK transmission over Non-zero-dispersion-shifted-fibers (NZDSF) where Raman amplification was used along with a special arrangement of dispersion compensation modules to keep the cumulated dispersion below 1500 ps/nm [4].
As shown in [4 and 12], in differential phase shift keying (DPSK), it is possible to apply differential modulation either in the time or frequency domain depending on the condition of fading channels. However, the BER performance of those systems is influenced by time or frequency correlation between adjacent symbols. Considering these factors many theoretical analysis have been done on BER performance degradation. In addition to these factors, BER performance of optical communication system is also constrained by few other parameters such as fiber length, amplifier gain, bit rate etc. Nevertheless, considering the parameters, development of a closed form expression of the BER for optical fiber communication system has not been given much attention. But it is important to have a quantitative understanding of the influence of other system parameters upon the BER performance [9]. The transmission system considered in [14] is based on conventional transmitter and receiver operating at 1550 nm wavelength with single mode fiber. The quality of detected data is improved by reducing embedded noise induced by linear and nonlinear effects of optical transmission channel. In [15], experimental evaluation of Praseodymium Doped Fiber Amplifier (PDFA) has been shown based on BER measurements. The study also presents a booster amplifier, configured in a co-propagating scheme, as a function of both wavelength and optical input power. In addition to the above, [16] presents some analysis and derivation of the BER in an optical transmission system with different types of optical amplifiers such that amplifiers add Gaussian spontaneous emission noise which dominates over other sources of noise.
In this paper we show an approximate closed form expression of the BER in DPSK systems over optical channel taking account of the differential modulation in both time and
2. SYSTEM MODEL
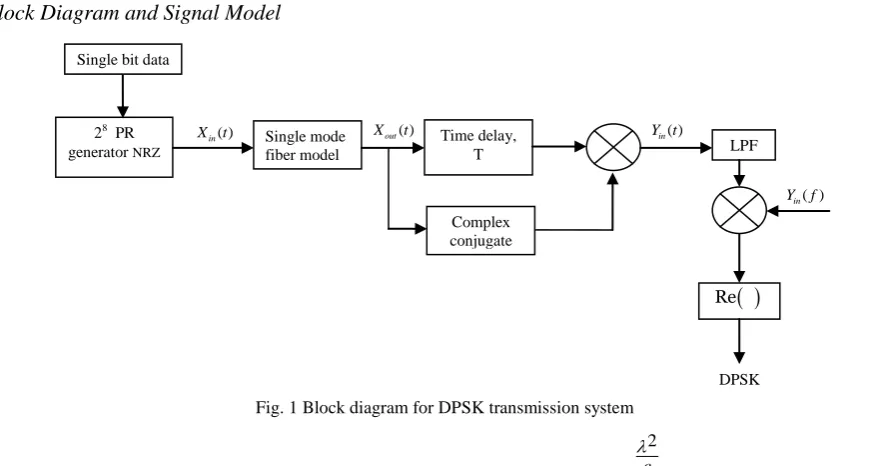
A) Block Diagram and Signal Model
[image:2.595.75.513.92.325.2]Fig. 1 Block diagram for DPSK transmission system
In the Fig. 1 block diagram of DPSK transmission system is shown. In this block a single bit data is transmitted through single-mode fiber. Before transmitting the optical source is assumed to be a single frequency laser with linewidth significantly less than the modulation rate, so that the effect of the laser phase noise is negligible. The laser is modulated according to a pseudorandom (PR) code of length 28 with a non-return-zero (NRZ) input data signal so that Inter Symbol Interference (ISI) due to chromatic dispersion can be accurately simulated [8]. The bit is shifted in frequency domain by discrete Fourier transform. The single-mode fiber is modelled as a band pass filter with flat amplitude response
and linear group delay within the data bandwidth. These are valid assumptions, since the transmission systems discussed in this paper have narrow bandwidths with respect to the absolute value of the optical frequency [7, 8].
The output of the PR code is used to generate the signals for the DPSK systems. The complex equivalent lowpass modulated signals for DPSK at the fiber input is sent.
For the DPSK and systems the modulated signals at the fiber input are: [8]
Xin( )t a P tk ( kT)
k
(1)
where a 1for PSK or DPSK, k is an integer, T is the bit time and P t( ) is the pulse function with unity amplitude within the bit time. A single bit data is transformed into frequency domain by discrete Fourier transform.
B) Fiber transfer function
The single-mode fiber is modelled as a bandpass filter with flat amplitude response and linear group delay within the data bandwidth. The low-pass equivalent model for the single-mode fiber transfer function is then given by
2 ( )
( ) j f jf
H f e e
=ej[B2(f /B) ]2 , (2)
where
2
( ) c
D L
, (3)
f is the difference between the optical frequency and optical carrier frequency, Bis the data rate or bit rate, is the operating wavelength, c is the speed of light, D is the dispersion factor and L is the fiber length.
The signal at the output of the fiber Xout
t is given by( ) ( ) ( )
Xout f Xin f H f , (4) where Xout( )f and Xin( )f are the Fourier transform of output and input symbol respectively and can be given by
Xout( )f Xout( )t e j2 ftdt
(5)
and
2
( ) ( ) j ft
Xin f Xin t e dt
(6)
From the block diagram in Fig. 1, Yin( )t can be given by
I { ( )} Re{ ( )}Re{ ( )} { ( )}
X t X t T
m out out
Yin t
Xout t Im Xout t T
(7)where Re
and Im
denote the real part and the imaginary part (in terms of low-pass representation) respectively.In the DPSK system, the signal at the fiber output is differentially detected (delayed by one bit and then multiplied) and then processed by the baseband filter. The
baseband filter input Yin( )t is given by
Re{ ( )} Re{ ( )}{ ( )} { ( )}
Xout t Xout t T Yin t
Im Xout t Im Xout t T
(8)28 PR
generator NRZ
Single mode fiber model
Time delay, T
Complex conjugate
LPF ( )
in
X t Xout( )t Y tin( )
( ) in
Y f
DPSK Single bit data
where T is the time delay which is always inverse of the bit rate [1, 8]. Note that, for a proper transmission channel, if the bandwidth of the channel is B then the bit rate will be equal to 2B. So, we have another relation between time delay and bandwidth as
1 1
2 2Bit rate Bandwidth
T
(9)
Consequently, we assume the electrical signal delay, Te has a relation with the electrical bandwidth Be according to
2
Te Be
. Note that, using Fourier transform the signal
( )
Yin t converted into frequency domain Yin( )f multiplied with the low pass filter transfer function. Here Butterworth filter is used.
The frequency response of the Butterworth filter is maximally flat (has no ripples) in the passband, and rolls off towards zero in the stopband. The filter transfer function is given by [7]
1
| ( ) |
2
1 ( / )
Hn f
n f fc
, (10)
where fc is the upper 3 dB cut off point and n represents the order of the filter. Then one bit is shifted multiplied with transmitted bit. By discrete Fourier transform a frequency
response is obtained as Yin( )f . And it multiplied with the Butterworth low pass filter with order n5. From this
finally the single bit data is received [7].
( ) ( ) ( )
Yout f Hn f Yin f (11) Finally, the received DPSK output signal Yout( )t is obtained by inverse Fourier transform of Yout( )f .
3.
BER CALCULATION
The signal power received after photo detection by a P-i-N photo detector can be given by,
Ps
RPin 2 (12) where R is the responsivity [2] of the photodiode, Pin is theinput power given by 1010
Ps
Pin with Ps being the signal power. The shot noise induced in P-i-N photo detector can be given by
2
Nshot Be out L GIsinIsp , (13)
where Be is the electrical bandwidth [7, 9], out and in are the amplifier output and input coupling efficiency
respectively, G is the optical gain, I s and I sp are the PCE of amplifier input power and spontaneous emission power respectively.
As shown in [6], I s can be given by
Is RI GLin , (14) and I sp can given by
1
0
Isp Nsp G eB , (15)
where Nsp 1 for an ideal amplifier and can range from 1.4 to 4 depending both on the pumping rate and the operating
wavelength and B0 is the optical bandwidth, e is the electron charge. Thermal noise is given by
Nth
Ith 2, (16)where I
th is the thermal current. Signal-spontaneous beat
noise is given by
Ns sp 4G Is s in out2 2L Be/ 0B (17)
where Gs is gain of the amplifier [2, 6].
Now the frequency domain input signal at the receiver can be given by
Yin( )f Yin( )t e j2 ftdt
(18)
From (8) we put the value of Yin( )t so that (18) becomes
Re ( ) Re ( ) 2
( )
Im ( ) Im ( )
Xout t Xout t Te j ft
Yin f e dt
Xout t Xout t Te
(19)
2( ) ( ) cos ( ) ( )
2
( ) ( ) sin ( ) ( )
2
( ) ( ) cos ( ) ( )
2
( ) ( ) sin ( )
j ft Xout t Xout t Te Xout t Xout t Te e dt
j ft j Xout t Xout t Te Xout t Xout t Te e dt
j ft j Xout t Xout t Te Xout t Xout t Te e dt
j Xout t Xout t Te Xout t Xou
2(t T ) e j ft dt
t e
(20)As shown in [7], after some calculations, (20) can be written as
1 cos ( ) ( )
( )
1 sin ( ) ( )
j Xout Te Xout Te
Yin f
j Xout T Xout Te
(21)( ) ( ) ( )
Yout f Hn f Yin f (22)
1 cos ( ) ( )
( )
1 sin ( ) ( )
j Xout Te Xout Te
Hn f
j Xout Te Xout Te
(23)
The received signal power can be obtained
1 cos ( ) ( )
*
( ) ( ) ( )
1 sin ( ) ( )
1 cos ( ) ( )
* ( )
1 sin ( ) ( )
j Xout Te Xout Te
Yout f Yout f Hn f
j Xout Te Xout Te
j Xout Te Xout Te
Hn f
j Xout Te Xout Te
=2 1
sin Re
Xout
Te
Xout
Te
(24)where
4
outL GIs in Isp
Te
Nshot . From (24) it can be
seen that, the fiber output is greatly affected by both shot noise and also by the other noise parameters. Similar calculation can be shown for spontaneous-spontaneous bit noise. It can be realized that the total noise is affected by these two significant parameters. As the total noise consists of shot noise, spontaneous-spontaneous bit noise and other noises, individual noise will have their affect on calculated received signal power. Because, whatever we say about (13), (17) or (25), one parameter is common to all of them that is electrical bandwidth. If we still look into (27), we find time delay as well as electrical bandwidth reveals the relation between the
amplifier input power I s and the received signal power
* ( ) ( )
Yout f Yout f calculated in (24).
Spontaneous-spontaneous bit noise is given by [6]
2
22 0 / 0
Nsp sp Is out L Be B Be B (25) Total noise induced in the received signal is given by
Ntotal Nshot NthNs sp Nsp sp (26) The SNR is given by
2
Is SNR
Ntotal
(27)
Finally, the BER can be calculated similar to [12] as
1
2 2
SNR BER erfc
(28)4. SIMULATION RESULTS
Following the theoretical analysis presented earlier, we present some simulation results showing BER performance for an optical system using DPSK modulation scheme. The simulation is carried out for a single mode fiber operating at 1.55µm. The dispersion co-efficient, D of the fiber is considered as 17 ps/km.nm. To evaluate the BER, SNR is calculated for a P-i-N photo detector in presence of shot noise, thermal noise, signal-spontaneous bit noise and spontaneous- spontaneous bit noise. The following discussion is based on the BER performance for three key parameters of the optical transmission system.
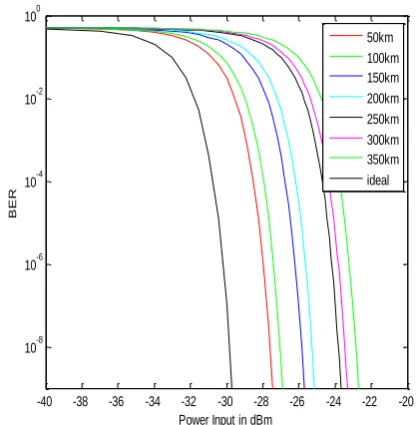
A) BER performance in different fiber length
The BER performance as a function of received power is shown Fig. 2 for different fiber length. From the figure it is observed that the BER increases when input power to the receiver is increased. Specifically, the input power required for BER =10-9 increases with the increase of fiber length. When the fiber length, L=50 km, the input power required to [image:4.595.323.532.384.597.2]the receiver to obtain BER=10-8 is found to be -27.65dBm. This is evaluated to be -27dBm in presence of dispersion for fiber length, L=100 km and -25.8 dBm at a length, L=150 km. This demonstrates that the DPSK spectrum is influenced by spectrum.
Fig. 2 BER performance of DPSK system due to variation of fiber length operating at a wavelength, λ=1.55 µm having
dispersion co-efficient, D=17 ps/km.nm.
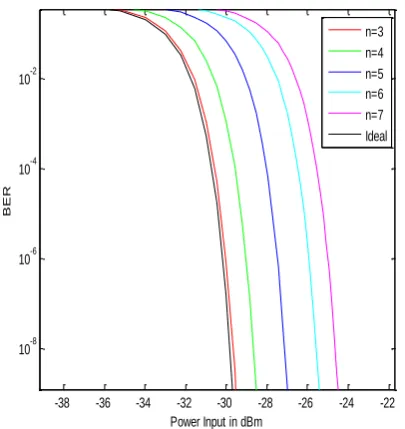
B) BER performance for different number of
amplifier
We consider the most common Erbium Doped Fiber Amplifier (EDFA) pumped with a laser at a wavelength of 980 nm or 1480 nm and exhibits gain in the 1550 nm region [6]. In this simulation the DPSK system has been analyzed for the variation of number of amplifier used. Simulation, as shown in Fig. 3, for BER=10-8, input power required to the
-40 -38 -36 -34 -32 -30 -28 -26 -24 -22 -20 10-8
10-6 10-4 10-2 100
Power Input in dBm
BER
receiver is -29.65 dBmfor
n
3
, -28.6dBm for n4 ,-26.9dBm for n5 and -25.55dBm for n6. So, as the numbers of amplifier are increased, input powers required to the receiver are increased.Fig. 3 BER performance of DPSK system due to variation of number of amplifier used operating at a wavelength, λ=1.55
µm having dispersion co-efficient, D=17 ps/km.nm.
C) BER performance with different amplifier gain
Similar to Fig. 2 the EDFA has been used in this simulation. Here BER versus input power has been shown for various amplifier gains. The result demonstrates that, with the increase of the amplifier gain, the speed of data communication increases, but the probability of error also increases i.e. BER increases. Specifically, The input power required for BER = 10-9 increases with the increase in amplifier gain. When the amplifier gain, Gs=20dB, the input power required to the receiver to obtain BER=10-8 is found to be -24.6 dBm. This is evaluated to be -25.5 dBm with amplifier gain 15dB and -22.5 dBm for amplifier gain 25dB [image:5.595.64.267.148.363.2]. From figure 3.5, it is observed that the input power required to the receiver increases with the increase in amplifier gain. This demonstrates that the DPSK spectrum is influenced by variation of amplifier gain.
Fig. 4 BER performance of DPSK system due to variation of amplifier gain operating at a wavelength, λ=1.55 µm having
dispersion co-efficient, D=17 ps/km.nm.
5. CONCLUSION
The performance of DPSK modulation system has been investigated in single mode fiber. The analysis is carried out in terms of BER considering fiber length, amplifier gain and number of amplifier used. In our simulations, the power penalty caused by fiber dispersion is evaluated at BER of 10-9 for a single mode fiber having dispersion co-efficient of 17 ps/km.nm at a wavelength 1.55µm. To see the relative disadvantage of DPSK in comparison with PSK, consider that during some bit interval the received is so contaminated by noise that in PSK system an error would be made in the determination of whether the transmitted bit was a 1or a 0. In DPSK a bit determination is made on the basis of the signal received in two successive bit intervals. Hence noise in one bit interval may cause errors to two bits determinations. The error rate in DPSK is therefore greater than in PSK, and it is a matter of fact, there is a tendency for bit errors to occur in pairs. It is not inevitable however those errors occur in pairs. Single errors are still possible.
6. REFERENCES
[1] Herbert Taub, Donald L. Schilling. Principles of Communication Systems, Tata McGraw Hill Edition, 1997, pp. 249-58.
[2] John M. Senior, Optical Fiber Communications, Eastern Economy Edition, 2008, pp. 1-4,427.
[3] Chunjun Gao; Alexandar M. Haimovich, members of IEEE : , “BER analysis of MPSK space-time block codes with differential detection” , IEEE Communications Letters , vol.7, no.7, July 2003.
[4] Fumihito Sasamori, Shiro Handa , and Shinjiro Oshita , Members , “A simple method of BER calculation in DPSK/OFDM systems over fading channels” , IEICE Trans. Fundamentals, Vol.88-A, No.1 January 2005. [5] Jonas Hansryd, James Van Howe, Chris Xu, “Nonlinear
crosstalk and compensation in QDPASK optical
-38 -36 -34 -32 -30 -28 -26 -24 -22 10-8
10-6 10-4 10-2
Power Input in dBm
BER
n=3 n=4 n=5 n=6 n=7 Ideal
-38 -36 -34 -32 -30 -28 -26 -24 -22 10-8
10-6 10-4 10-2
Power Input in dBm
BER
communication systems”, IEEE Photonics Technology Letters, vol.16, no. 8, August 2004.
[6] Govind P. Agarwal, Fiber Optic Communication Systems, John Wiley & sons, Inc., 2002. pp. 160-68 [7] Bernard Sklar , Digital Communications Fundamentals
and Applications, Pearson Education, 2003, pp. 63-69, 151, 1023-24.
[8] Elrefaie, A.F.; Wagner, R.E.; Atlas, D.A.; Daut, D.G.; "Chromatic dispersion limitations in coherent lightwave transmission systems," Lightwave Technology, Journal
of , vol.6, no.5, pp.704-709, May 1988 [9] Jin Wang; Kahn, J.M., "Impact of chromatic and
polarization-mode dispersions on DPSK systems using
interferometric demodulation and direct
detection," Lightwave Technology, Journal of , vol.22, no.2, pp. 362- 371, Feb. 2004.
[10] Keang-Po Ho , Member IEEE , and Chinlon Lin, Fellow IEEE, “Performance analysis of optical transmission system with polarization-mode dispersion and forward error correction” , IEEE Photonics Technology Letters, Vol.9, No.9,September 1997.
[11] Keang-Po Ho, Member, IEEE, “Error probability of DPSK signals with interchannel four-wave-mixing in
highly dispersive transmission systems”, IEEE Photonics Technology Letters.
[12] S. P. Majumder, Member, IEEE, Afreen Azhari, and F. M. Abbou, “Impact of fiber chromatic dispersion on the BER performance of an optical CDMA IM/DD transmission system”, IEEE Photonics Technology Letters, Vol. 17,No. 6, June 2005.
[13] Q. T. Zhang, Senior member, IEEE, “Exact analysis of postdetection combining for DPSK and NFSK systems over arbitrarily correlated Nakagami channels ”, IEEE Transactions on Communications, Vol. 46, No. 11, November 1988.
[14] Hadj Bourdoucen, Amer Alhabsi, “Improvement of bit error rate in optical fiber receivers”, World Academy of Science, Engineering and Technology, 52, 2009. [15] R. J. W. Jonkar, R. C. Schimmel, H. de Waardt,
“Experimental assessment of a Praseodymium doped fiber amplifier (PDFA) for amplifier applications in the
second telecommunication window” Proceedings
Symposium IEEE/LEOS Benelux Chapter,2001. [16] Felix Abramovich, Polina Bayvel; “Some statistical
remarks on the derivation of BER in amplified optical
communication systems”, IEEE Transactions on