http://dx.doi.org/10.4236/jmp.2015.67094
How to cite this paper: Jaberi, R., Gholami, M.H., Pashaki, A.S. and Khoshghadam, A. (2015) Evaluate Shielding Design of the Brachytherapy Unit by Using Monte Carlo Simulation Code. Journal of Modern Physics, 6, 902-911.
http://dx.doi.org/10.4236/jmp.2015.67094
Evaluate Shielding Design of the
Brachytherapy Unit by Using
Monte Carlo Simulation Code
Ramin Jaberi
1, Mohammad Hadi Gholami
2*, Abdolazim Sedighi Pashaki
2,
Alireza Khoshghadam
21Cancer Institute of Tehran University of Medical Science, Tehran, Iran 2Mahdieh Brachytherapy Charitable Center, Hamedan, Iran
Email: *[email protected]
Received 20 December 2014; accepted 20 June 2015; published 24 June 2015
Copyright © 2015 by authors and Scientific Research Publishing Inc.
This work is licensed under the Creative Commons Attribution International License (CC BY).
http://creativecommons.org/licenses/by/4.0/
Abstract
Shielding design is necessary for brachytherapy treatment room in order to protect the general public and employees. The main objective of this study was to investigate whether the protective unit of our Brachytherapy Centre provided adequate protection to the health and safety assess-ment of radiobiological impact. In this study, we estimated the effect of radiobiological protection from a single Ir-192 brachytherapy source in Brachytherapy center by using MCNP5 Monte Carlo measurements. The room was based on the design specifications for the HDR 192 Ir treatment was modeled. The estimated dose rate range for HDR 192 Ir and public buildings is (0.45 - 0.64): (mi-cro sivert) μSv/hour. Dose rates measured data for the current setup Brachytherapy HDR unit was approved and agreed quiet well with recommendation of International Atomic Energy Agency. The measured dose rate for public areas and controlled areas, compared with the reference value of 7.5 μSv/h and 0.5 μSv/h and concluded that we have enough shielding to the source but an over estimate with experimental measurements had been seen.
Keywords
Computer Codes and Modeling, Dose Equivalent, Effective Dose, Shielding, Monte Carlo Code System
1. Introduction
Monte Carlo N-Particle Transport Code (MCNP) is a software package for simulating nuclear processes. It is developed by Los Alamos National Laboratory since at least 1957 with several further major improvements [1].
It is distributed within the United States by the Radiation Safety Information Computational Center in Oak Ridge, TN and internationally by the Nuclear Energy Agency in Paris, France. It is used primarily for the simu-lation of nuclear processes, such as fission, but has the capability to simulate particle interactions involving neu-trons, photons, and electrons. “Specific areas of application include, but are not limited to, radiation protection and dosimetry, radiation shielding, radiotherapy, medical physics, nuclear criticality safety, detector design and analysis, nuclear oil well logging, accelerator target design, fission and fusion reactor design, decontamination and decommissioning.” MCNPX (Monte Carlo N-Particle extended) is also developed at Los Alamos National Laboratory, and is capable of simulating particle interactions of 34 different types of particles (nucleons and ions) and 2000+ heavy ions at nearly all energies, including those simulated by MCNP [2]. Both codes can be used to judge whether or not nuclear systems are critical and to determine doses from sources, among other things. MCNP6 is a merger of MCNP5 and MCNPX [3]. The Monte Carlo code system MCNP is employed for the si-mulation. MCNP is a general purpose Monte Carlo radiation transport code which can simulate coupled neutron, and photo neutron transport in three dimensions through complex geometries is constructed as Boolean combi-nations of planes, spheres, cones and cylinders [4]. An energy cut off value of 1 KeV is used to terminate track-ing of photon and electron histories. MCNP requires the source for a particular problem to be specified in a user- defined input file. The source includes distributions of the positions, energy and angle of the starting particles. The cross section library containing data from the ENDF is included with the MCNP code that is utilized for the computations [4]. In this study, we use MCNP5 simulation code. This code is suitable for such shielding inves-tigation because of an extensive library of cross sections for materials that are use for shielding, and then com-pare the experimental calculations with MCNP5 simulation in occupied areas and verify whether the shielding provides adequate protection for the staff and the public in its current operational state and make appropriate recommendations to address any radiological health and safety hazards identified. Brachytherapy is a technique by which sealed radioactive sources are introduced into the body and positioned near the tumor using appropri-ate applicator devices. This technique can deliver the desired dose to the tumor while avoiding damage to healthy tissues. To achieve the best possible treatment planning, it is very important to know as precisely as possible the dose distribution around not only the source but also the applicator [5]. Specially designed rooms should have sufficient shielding to limit the treatment radiation exposure dose received by other patients, nurs-ing staff and members of the public in the surroundnurs-ing areas [6]. There are several sources for use in brachythe-rapy such as 131 I, 60 co and 192 Ir [7]. Iridium-192 source at the Mahdieh Brachytherapy center is used for HDR (High Dose Rate) brachytherapy 192 Ir source use as after loading source with a half-life of 74 days, with a average gamma energy of about 0.38 MeV. Ir-192 with the activity between 2 - 12 Ci (Curie is a unit of ra-dioactivity and radioactive materials to be used to express the activity of the audit) can be used as HDR source in Brachytherapy. The brachytherapy design depends on treatment techniques, work load, activity of the source, nuclides and energy of source. In brachytherapy, room and wall shielding designs must be sufficient to reduce the primary and scattered radiation since the sources are unshielded in all directions. Brachytherapy treatment rooms should comply with both national and international regulations that deal with shielding requirement to render an installation safe from radiation protection point of view [8]. For public areas and controlled areas, radiation should be in reference value range of 0.75 μSv/h and 0.5 μSv/h [9]. The design should also take into the best simulation code to evaluate the shielding adequacy [10]. Mahdieh Brachytherapy had been invented in 2012 and had a treatment in 5 days a week.
2. Materials and Methods
The study was carried out at the Mahdieh hamadan brachytherapy center and using recommendation of IAEA- 47 (International Atomic Energy Agency protocol number 47) report for HDR brachytherapy units shielding [11]. First, we calculate the shielding of brachytherapy unit with the theoretical methods and formulas that have been described below.
Gamma Exposure Rate Formula
The exposure rate from a gamma point source can be approximated from the following expression
0 2
Γ
A X
r
= (1)
Monoenergetic x or gamma rays collimated into a narrow beam are attenuated exponentially through a shield according to the following equation:
0e x
I =I −µ (2)
where I is the intensity outside of a shield of thickness xI0 is the unshielded intensity µ is the linear attenuation
coefficient of the shielding material x is the thickness of shielding material. The linear attenuation coefficient is the sum of the probabilities of interaction per unit path length by each of the three scattering and absorption processes—photoelectric effect, and pair production. Note that µ has dimensions of inverse length (1/cm). The reciprocal of µ is defined as the mean free path, which is the average distance the photon travels in an absorber before an interaction takes place.
Therefore, to confirm the calculations and validation of the calculation we used both experimental and Monte Carlo methods.
3. Description of the Brachytherapy Facility
The Mahdieh Radiotherapy Centre has a brachytherapy treatment rooms, a diagnostic Ct scan X-ray equipment and administrative setup. The brachytherapy treatment room shown in Figure 1 has a concrete shield of thick-ness 85 cm. Flexitron machine facility at the center has a monitor located at the treatment planning room, office for monitoring the movements of the patient and communication system. Figure 1shows the locations around the Ir-192 sources used for the study. The specific reason for choosing this points depends on the amount of traffic in that place, work place of technicians and nurses and commonalities between the X-ray machine. In this simulation, we must simulate source in height of 1meter from the ground and should be bare source. Locations A, B, C and F are the control area. B where the medical physicists with the Ct scan images plan the patient. Lo-cation A with a mdf and 0.4 mm lead door separates the entrance to the maze. LoLo-cations D, E are designated as the public areas and locations F is controlled area, schematic diagram to demonstrate the experiment process has been shown in Figure 2.
4. Monte Carlo Simulation
The brachytherapy treatment room of the Centre was modeled using the visual editor of the MCNPX code to the design specification of the facility. The concrete with a density of 2.35 g/cm3 was used with material composi-tion of 1H 0.005558, 8O 0.498076, 11Na 0.017101, 12Mg 0.002565, 13Al 0.045746 14Si 0.315092, 16S 0.001283,
19K 0.019239, 20Ca 0.082941, 26Fe
54 0.000707, 26Fe56 0.01139 26Fe57 0.000265, 26Fe58 3.6 × 10⁻⁵. The entrance
door of the facility is modeled as a mdf door with a density of 0.830 g/cm3 [12]. 4 mm lead with density of
Point F:
External Radiotherapy Point E
Point A
Point D
Treatment Room Recovery
room Point C control
room Point B Source lr-192
Start
outside of the ionizing radiation environmental
Turn on the machine for 15 minutes
The divice is set to zero Select a unit of measurement
according to the standard of
Read and record the amount of radiation fields outside the
measuring range
Go to the place of measurements
Put the device in place for 5 minutes. Recording temperature and
pressure at measuring pooint
[image:4.595.81.534.84.534.2]Reading and recording the new figure of ionizing radiation on
the side
End
Figure 2. Schematic diagram to demonstrate the experiment process.
11.35 g/cm3 with material of 82Pb206 0.242902, 82Pb207 0.223827, 82Pb208 0.53327 use in mdf door [13] [14].
Brachytherapy sources; Ir-192 was modeled asFigure 3 with 5 activities of 11.5, 6.5, 5.7, 4.4 and 3.2 Ci. It has been in existence till date using the decay equation:
0e iγt
A=A − (3)
where A is the present activity, A0 is the initial activity at a known time, γ is the decay constant and t is the time
to the date of exposure. The Ir-192 HDR with activities (11.5, 6.1, 5.7, 4.4 and 3.2) Ci, was used for the model-ing respectively.
Flux Tally at a Point or Ring (Type F5)
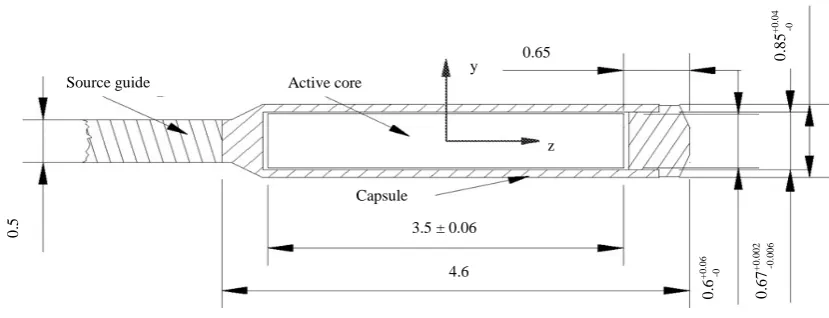
The coordinate system is located at the center of the active part of the source Dimensions are in mm
The braided stainless-steel cable was assumed to be 5-mm long and to consist of solid stainless-steel.
Source guide Active core
0.65 y
z
4.6
0
.5
Capsule
3.5 ± 0.06
0
.6
+
0.
0
6
-0
0
.6
7
+
0.
0
02
-0
.006
0
.8
5
+
0.
0
4
[image:5.595.106.521.358.517.2]-0
Figure 3. Schematic design and geometry of brachytherapy flexitron Ir-192 source.
of tally, assume that calculations are being performed in a uniform medium. Suppose a particle of energy E and weight W from an isotropic source is released at distance r from the detector point. Ray theory methodology, as used in the point-kernel method, dictates that the contribution δΦ to the fluence at the detector point is given by:
2e
4π
Er W
r µ
δΦ = −
(4)
in which µ(E) is the linear interaction coefficient for the particle of energy E. Note that 1/4π per steradian is the angular distribution of a point isotropic source. Now suppose that a collision takes place at distance r from the detector point and that, to reach the detector point, a scattering angle of θs would be required. Here, E is the
energy of the particle after the collision and W is its weight. If µ(E, θs) is the linear interaction coefficient per
steradian for scattering at angle θs, then µ(E, θs)/µ(E) is the probability per steradian for scattering at angle θs.
(
)
( )
2, e
s Er
W E
E r
µ
µ θ
δ µ
−
Φ = (5)
5. Dose Rate Measurement
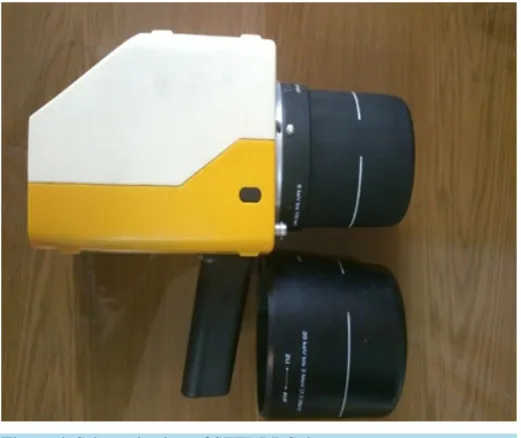
Locations where dose rate had been estimated in thereby using MCNP5 were first identified and then measured the corresponding distances from the source. Dose rate monitoring was carried out for the selected locations A, B, C, D, E, and F in meter. Measuring doses must be in the range of 0.5 μSv/h - 7.5 μSv/h. for experimental measurement we used the STEP RDG Detector with Measuring range of 0 - 2000 μSv/h and 1.06 correction factor that shown in Figure 4.
6. Results and Discussion
[image:6.595.184.445.285.504.2]Result in Tables 1-5 and Figures 5-9 shows experimental measurement for a Ir-192 HDR source with apparent activity. All of measurement dose rate are under the reference dose rate recommendation of International Atom-ic Energy Agency.
Figure 4. Schematic view of STEP RDG detector.
Table 1. Measurement and comparison between experimental dose rate, referenced dose rate and simulated data for source with 11.5 Ci activity.
[image:6.595.86.541.548.719.2]Location
Table column head
Distance from source
(m)
Measured dose rate
(μSv/h) Reference dose rate (μSv/h) Activity (Ci)
Simulated dose Rate
(μSv/h)
Point A 1.5 0.71 7.5 11.5 0.94
Point B 2 0.68 7.5 11.5 0.33
Point C 3 0.66 7.5 11.5 0.166
Point D 3.5 0.5 0.5 11.5 0.32
Point E 4 0.45 0.5 11.5 0.16
Point F 5 0.45 7.5 11.5 0.89
STD - 0.121119775 - - 0.354367982
avg - 0.575 - - 0.467666667
Table 2. Measurement and comparison between experimental dose rate, reference dose rate and simulation data for source with 6.1 Ci activity.
[image:7.595.84.539.109.294.2] [image:7.595.90.540.328.513.2] [image:7.595.88.540.546.719.2]Location
Table column head
Distance from source
(m)
Measured dose rate
(μSv/h) Reference dose rate (μSv/h) Activity (Ci)
Simulated dose Rate
(μSv/h)
Point A 1.5 0.68 7.5 6.1 0.85
Point B 2 0.66 7.5 6.1 0.33
Point C 3 0.66 7.5 6.1 0.11
Point D 3.5 0.48 0.5 6.1 0.28
Point E 4 0.45 0.5 6.1 0.15
Point F 5 0.45 7.5 6.1 0.668
STD - 0.113959057 - - 0.296715352
avg - 0.563333333 - - 0.398
St.Dev.% - 0.202294184 - - 0.745515959
Table 3. Measurement and comparison between experimental dose rate, reference dose rate and simulation data for source with 5.7 Ci activity.
Location
Table column head
Distance from source
(m)
Measured dose rate
(μSv/h) Reference dose rate (μSv/h) Activity (Ci)
Simulated dose Rate
(μSv/h)
Point A 1.5 0.54 7.5 5.7 0.82
Point B 2 0.54 7.5 5.7 0.32
Point C 3 0.51 7.5 5.7 0.105
Point D 3.5 0.45 0.5 5.7 0.28
Point E 4 0.45 0.5 5.7 0.15
Point F 5 0.45 7.5 5.7 0.66
STD - 0.045166359 - - 0.287618092
avg - 0.49 - - 0.389166667
St.Dev.% - 0.092176243 - - 0.739061478
Table 4.Measurement and comparison between experimental dose rate, reference dose rate and simulation data for source with 4.4 Ci activity.
Location
Table column head
Distance from source
(m)
Measured dose rate
(μSv/h) Reference dose rate (μSv/h) Activity (Ci)
Simulated dose rate
(μSv/h)
Point A 1.5 0.61 7.5 4.4 0.802
Point B 2 0.64 7.5 4.4 0.32
Point C 3 0.43 7.5 4.4 0.1
Point D 3.5 0.44 0.5 4.4 0.27
Point E 4 0.42 0.5 4.4 0.15
Point F 5 0.49 7.5 4.4 0.61
STD - 0.096488341 - - 0.274901194
avg - 0.505 - - 0.375333333
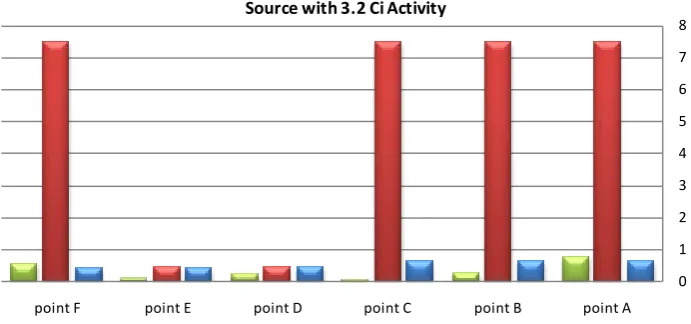
Table 5. Measurement and comparison between experimental dose rate, reference dose rate and simulation data for source with 3.2 Ci activity.
Location
Table column head
Distance from source (m)
Measured dose rate (μSv/h)
Reference dose rate (μSv/h)
Activity
(Ci)
Simulated dose rate (μSv/h)
Point A 1.5 0.68 7.5 3.2 0.79
Point B 2 0.66 7.5 3.2 0.3
Point C 3 0.66 7.5 3.2 0.097
Point D 3.5 0.51 0.5 3.2 0.267
Point E 4 0.45 0.5 3.2 0.12
Point F 5 0.45 7.5 3.2 0.58
STD - 0.110166541 - - 0.272877995
avg - 0.568333333 - - 0.359
[image:8.595.145.482.512.687.2]St.Dev.% - 0.19384142 - - 0.760105835
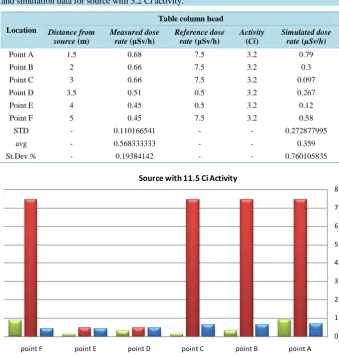
Figure 5. Schematic view of measured dose rate, reference dose rate and simulated dose rate for each point for the source with 11.5 Ci activity.
Figure 6. Schematic view of measured dose rate, reference dose rate and simulated dose rate for each point for the source with 6.1 Ci activity.
0 1 2 3 4 5 6 7 8
point A point B
point C point D
point E point F
Source with 11.5 Ci Activity
Experimental Dose rate (μSv / h ) Refrence Dose rate(μSv / h ) Simulated Dose Rate(μSv / h )
0 1 2 3 4 5 6 7 8
point A point B
point C point D
point E point F
Source with 6.1 Ci Activity
Figure 7. Schematic view of measured dose rate, reference dose rate and simulated dose rate for each point for the source with 5.7 Ci activity.
Figure 8. Schematic view of measured dose rate, reference dose rate and simulated dose rate for each point for the source with 4.4 Ci activity.
Figure 9. Schematic view of measured dose rate, reference dose rate and simulated dose rate for each point for the source with 3.2 Ci activity.
0 1 2 3 4 5 6 7 8
point A point B
point C point D
point E point F
Source with 5.7 Ci Activity
Experimental Dose rate (μSv / h ) Refrence Dose rate(μSv / h ) Simulated Dose Rate(μSv / h )
0 1 2 3 4 5 6 7 8
point A point B
point C point D
point E point F
Source with 4.4 Ci Activity
Experimental Dose rate (μSv / h ) Refrence Dose rate(μSv / h ) Simulated Dose Rate(μSv / h )
0 1 2 3 4 5 6 7 8
point A point B
point C point D
point E point F
Source with 3.2 Ci Activity
[image:9.595.141.487.520.682.2]7. Conclusion
The measured dose rates at the selected locations representing supervised areas are all below the recommended values for public areas of 0.5 μSv/h. The controlled areas are also below the value recommended for controlled areas of 7.5 μSv/h. This implies that the biological shielding design of the facility is adequate to attenuate the gamma radiations from the brachytherapy sources used for treatment and hence the general public and staff are adequately protected for the existing HDR Ir-192 brachytherapy system. But unfortunately we saw an over es-timate in calculation of room shielding design.
References
[1] Cashwell, E.D. and Everett, C.J. (1959) A Practical Manual on the Monte Carlo Method for Random Walk Problems. Pergamon Press, Oxford.
[2] https://mcnpx.lanl.gov/opendocs/misc/FeaturesList
[3] Los Alamos National Laboratory, New Mexico, United States. https://mcnp.lanl.gov [4] L.A.N. Laboratory (2000) Monte Carlo N-Particle Transport Code System.
[5] Alain Gerbaulet RP, Harm Meertens, Erik Van Limbergen (2001) The GEC ESTRO Handbook of Brachytherapy. ESTRO, Brussels.
[6] Arthur B. Chilton, Richard E. (1984) Principle of Radiation Shielding. Prentice Hall, Kanas.
[7] Joslin, A. and Hall, E.J. (2001) Principle and Practice of Brachytherapy Using after Loading Systems. Joanna Koster, London.
[8] (1996) International Basic Safety Standards for Protection against Ionizing Radiation and for the Safety of Radiation Sources. IAEAsafety Series, Vienna.
[9] (2006) Radiation Oncology Physics: A Handbook for Teachers and Students. IAEA, Vienna.
[10] (1997) The Design of Radiotherapy Treatment Room Facilities. IPEM, York.
[11] (2006) Radiation Protection in the Design of Radiotherapy Facilities, Safety Reports Series No. 47. International Atomic Energy Agency, Vienna.
[12] Elert, G. (2008) Density of Wood. Shirley Lam.
[13] Schwarz, R.A.S.A.L. and Carter, L.L. (2008) MCNP/MCNPX Visual Editor Computer Code Manual.