http://dx.doi.org/10.4236/wjet.2014.24026
Liquefaction-Induced Ground Deformations
Evaluation Based on Cone Penetration Tests
(CPT)
Alketa Ndoj, Neritan Shkodrani, Veronika Hajdari
Department of Civil Engineering, Polytechnic University of Tirana, Tirana, Albania Email: alketandoj@yahoo.com
Received 17 July 2014; revised 3 September 2014; accepted 20 September 2014
Copyright © 2014 by authors and Scientific Research Publishing Inc.
This work is licensed under the Creative Commons Attribution International License (CC BY). http://creativecommons.org/licenses/by/4.0/
Abstract
The aim of this paper is to evaluate the liquefaction-induced ground deformations of sand-like soils based on Cone Penetration Tests (CPT) at Semani site, Fieri prefecture in Albania. These tests are performed during the process of investigation of this area, in which a Liquid Natural Gas Ter- minal-Power Plant was supposed to be built. This paper presents the assessment of the liquefac- tion and of the liquefaction-induced ground deformations such as lateral spreading displacement and post-liquefaction reconsolidation settlement. The liquefaction-induced lateral spreading and post-liquefaction reconsolidation settlement are estimated based on CPT data according to the method in MNO-12 “soil liquefaction during earthquake”, presented by Idriss and Boulanger (2008). This evaluation is very important and should be taken into consideration for the design of engineering structures that will be constructed in this area. All the calculation’s results are shown in graphs. At the end, there are highlighted some conclusions regarding the liquefaction-induced ground deformations in this site.
Keywords
Liquefaction, Cone Penetration Test, Lateral Spreading, Settlement, Factor of Safety
1. Introduction
Figure 1. Geographic location of the study area.
more than 100 m. These deposits are represented by gravels, sands, silty sands, silty clays, and clays. The water table is 0.5 m to 1.5 m from the ground surface [1].
Area of Semaniis included in the Periadriatic Depression, strongly affected by post-Pliocene compression movements (here in after referred as PL-zone), wherein have been recorded numerous strong earthquakes. This one is characterized by high seismic activity.
According to Albanian Earthquake-Resistant Design Regulation KTP-N.2-89, the soil conditions in this area are classified as Category III. The Peak Ground Acceleration, amax for soil Category III, according to Shkodra- ni, et al. 2010 is 0.26 g [2].
The highest magnitude recorded up to date is Ms = 6.2 during the Fier earthquake of 18th of March 1962, ac- cording to Sulstarova, et al., 2010. During this earthquake were seen the liquefaction phenomena and its conse- quences including ground settlement, lateral spreading and sands boil [3].
Analysis of the factors that control the liquefaction indicates that the soils in this site are susceptible to lique- faction. The design of engineering structures that will be constructed in this area requires evaluation of the li- quefaction and after that evaluation of the liquefaction-induced ground deformations. Different authors, such as Robertson and Wride 1998, Idriss and Boulanger 2008, Andrus and Stokoe 2000, have evaluated the liquefac- tion resistance of soil based on Standard Penetration Tests (here in after referred as SPT), Cone Penetration Tests (here in after referred as CPT), Shear Wave Velocity (here in after referred as Vs) data. The liquefaction- induced ground deformations can be evaluated based on the methods presented by Ishihara and Yoshimine 1992 and improved by different authors such as Zhang et al., 2004, Yoshimine 2006; Idriss and Boulanger 2008; Fred Yi 2010 for application to SPT, CPT, Vs data.
In this study these evaluations are conducted using 12 Cone Penetration Tests executed in this area by means of the equations presented by Idriss and Boulanger 2008.
The procedure of calculation includes the following steps:
2) Calculation of the maximum shear strain γmax and the post-liquefaction reconsolidation strain εv based on Ishihara and Yoshimine 1992, Yoshimine 2006 with the additional constraint of a limiting shear strain pre- sented by Idriss and Boulanger 2008;
3) Calculation of the lateral spreading and of the post-liquefaction reconsolidation settlement according to Idriss and Boulanger 2008.
Using the Simplified Procedure presented by Seed and Idriss 1971, the liquefaction is estimated based on the factor of safety against the triggering of liquefaction. The lateral spreading displacement and post-liquefaction reconsolidation settlement are calculated based on the maximum shear strain γmax and post-liquefaction recon- solidation strain εv, respectively using CPT results. All the results of calculation are presented in graphs.
2. Methodology
The liquefaction-induced lateral spreading and post-liquefaction reconsolidation settlement for saturated clean sands and silty sands are estimated based on CPT data according to the presented method in MNO-12, “Soil li- quefaction during earthquake”, Idriss and Boulanger, 2008 [4]. The soil behavior type index, Ic, as defined by Robertson and Wride (1998) is used to identify the liquefiable layers of the area from the CPT data [5].
Primarily the liquefaction potential based on Idriss and Boulanger 2008, is evaluated using the factor of safety against the triggering of liquefaction. Daja, et al., 2011 have also evaluated the potential of liquefaction in this area by means of the liquefaction probability. Comparing the results of these two methods is one of the aims of the paper.
Liquefaction estimation requires the evaluation of cyclic stress ratio and of cyclic resistance ratio. Cyclic stress ratiois evaluated according to Seed-Idriss Simplified Procedure using the calculated stress reduction coef- ficient based on the relation presented by Idriss, 1999 as a function of the depth and the highest earthquake rec- orded to date in study area (Ms = 6.2). Cyclic Resistance Ratio is calculated as a function of three parameters: 1) Equivalent clean-sand CPT penetration resistance that is used to account for the effects of nonplastic fines con-tent on the liquefaction resistance; 2) Magnitude scaling factor MSF, calculated according to Idriss, 1999 based on the number of equivalent uniform stress cycles and earthquake magnitude; 3) Over burden correction factor,
Kσ calculated according to Idriss and Boulanger 2004, as a function of the corrected penetration resistance. After that the lateral spreading displacement and post-liquefaction reconsolidation settlement are calculated based on the maximum shear strain γmax and post-liquefaction reconsolidation strain εv, respectively. The maximum shear strain is calculated based on Ishihara and Yoshimine 1992 and Yoshimine 2006, as a function of the factor of safety against the triggering of liquefaction and of the limiting shear strain, expressed in terms of CPT penetration resistance. The post-liquefaction reconsolidation strain is also calculated based on Ishihara and Yoshimine 1992 and Yoshimine 2006, as a function of the maximum shear strain and of the CPT penetration re- sistance. All the results of calculations for factor of safety, post-liquefaction reconsolidation strain, post-lique- faction reconsolidation settlement, maximum shear strain and for lateral spreading displacement are shown in graphs in the third section of the paper for 12 CPT executed in study area.
2.1. Evaluation of Factor of Safety against the Triggering of Liquefaction
The factor of safety against the triggering of liquefaction is defined as the ratio of cyclic resistance ratio
(
CRRM,σvc′)
that will cause liquefaction of the soil to cyclic stress ratio induced in the soil by the earthquake(
CSRM,σvc′)
.2.1.1. Cyclic Stress Ratio
(
CSRM,σvc′)
Cyclic Stress Ratio
(
,)
vc
M
CSR σ′ is estimated via the Seed-Idriss simplified procedure from a formula that in-
corporates ground surface acceleration, total and effective stresses in the soil and nonrigidity of the soil column [6]. The stress reduction coefficient rd is estimated as a function of the depth and earthquake magnitude based on the relation proposed by Idriss (1999) [7] as follows:
( )
( )
(
)
exp d
( )
z 1.012 1.126 sin(
(
z11.73)
5.133)
α = − − + (1a)
( )
z 0.106 0.118sin(
(
z11.28)
5.142)
β = + + (1b)
where z=depth≤20 m; M= moment magnitude of the earthquake and the arguments inside the sine terms
are in radians.
2.1.2. Cyclic Resistance Ratio
(
CRRM,σvc′)
Idriss and Boulanger (2004) derived the following correlation between CRR and penetration resistance for the CPT. This correlation is used to evaluate the triggering of liquefaction in clean sands and silty sands.
2 3 4
1 1 1 1
7.5, 1 exp 3
540 67 80 114
vc
c Ncs c Ncs c Ncs c Ncs
M
q q q q
CRR = σ ′ = = + − + −
(2)
where: qc Ncs1 = represents the equivalent clean-sand CPT penetration resistance and is used to account for the
effects of non plastic fines content on the liquefaction resistance.
1 1 1
c Ncs c N c N
q =q + ∆q (3)
(
)
(
(
(
)
)
(
(
)
)
2)
1 5.4 1 16 exp 1.63 9.7 0.01 15.7 0.01
c N c N
q q FC FC
∆ = + ⋅ + + − + (3a)
where:
FC = fines content;
1 c N
q = the overburden corrected penetration resistance and is calculated by using an overburden correction factor CN.
The factor CN is calculated based on the relation proposed by Liao and Whitman (1986) and modified by Idriss and Boulanger (2003b), expressed in terms of the overburden corrected penetration resistance [8]:
(
)
( )0.264 11.338 0.249
1.7
c N
q N a vc
C = P σ′ − ≤ (4)
where: qc N1 =21 - 254.
The above correlation for CRR is applicable to M =7.5 and an effective overburden stress of σ ′ =vc 1 atm.
This is extended to other values of earthquake magnitude and effective overburden stress by using the correction factors MSF and Kσ [4].
, vc 7.5,vc 1
M M
CRR σ′ =CRR = σ′ = ⋅MSF K⋅ σ (5)
where:
MSF = magnitude scaling factor, given by Idriss (1999) based on the number of equivalent uniform stress cycles and earthquake magnitude:
(
)
6.9 exp 4 0.058 1.8
MSF= −M − ≤ (6)
where:
Kσ = overburden correction factor and is used to account for the overburden pressures on the liquefaction resistance.
It is calculated based on the relation given by Idriss and Boulanger (2004) [8], as follows:
(
)
1 ln vc a 1.1
Kσ = −Cσ σ ′ P ≤ (7)
where:
The coefficient Cσ is expressed in terms of the corrected penetration resistance as follow:
(
)
(
0.264)
1 1
1 37.3 82.7 c N 0.3; c N 211
Cσ = − q ≤ q ≤ (8)
2.2. Maximum Shear Strain
expres-sions given by Yoshimine et al. (2006) with the additional constraint of a limiting shear strain as follow [4]:
max 0 if FSliq 2
γ = ≥ (9)
(
)
(
)
max
0.035 2 1
min lim, liq if 2 liq
liq FS F FS F FS F α α α
γ = γ − − > >
−
(9a)
max lim if FSliq Fα
γ =γ ≤ (9b)
where:
lim
γ = the limiting shear strain expressed as:
(
)
(
0.264)
31
1.859 2.163 0.478 0
lim qc Ncs
γ = − ≥ (10)
where:
Fα = the limiting values of FSliq expressed as:
(
)
0.264(
)
0.5281 1
11.74 8.34 c Ncs 1.371 c Ncs
Fα = − + q − q (11)
where: qc Ncs1 ≥69.
Lateral Spreading Displacement
Lateral displacement index, LDI suggested by Zhang et al. 2004 is calculated by integrating the maximum shear strains over the depth interval of concern.
The lateral displacement is calculated according to Zhang et al. 2004 [9].
(
)
LD= S+0.2 ∗LDI (12)
where:
LD = lateral displacement; LDI = lateral displacement index; S = ground slope as a percentage.
2.3. Post-Liquefaction Reconsolidation Strain
Ishihara and Yoshimine (1992) observed that the volumetric strain that occurs during post-liquefaction reconso- lidation of clean sands was related to γmax developed during undrained cyclic loading and to relative density of the sand. εv is estimated from the formulas expressed in terms of CPT penetration resistance as follow [4]:
(
)
(
0.264)
(
)
1 max
1.5 exp 2.551 1.147 min 0.08,
v qc Ncs
ε = − ⋅ γ (13)
where: qc Ncs1 ≥21.
Post-Liquefaction Reconsolidation Settlement
The ground surface settlement for one-dimensional reconsolidation is estimated by equating the vertical strains to the volumetric strains and then integrating the vertical strains over the depth interval of concern [4].
3. Results
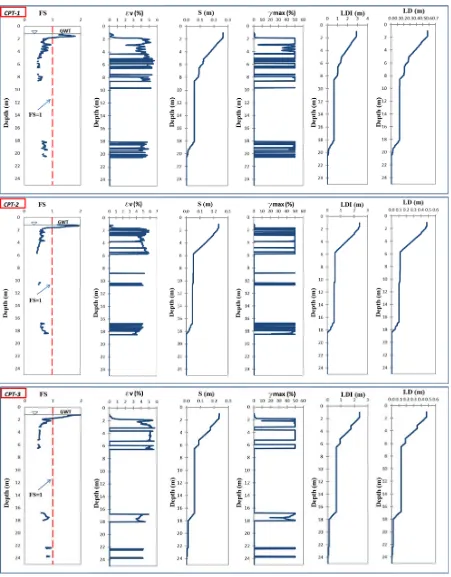
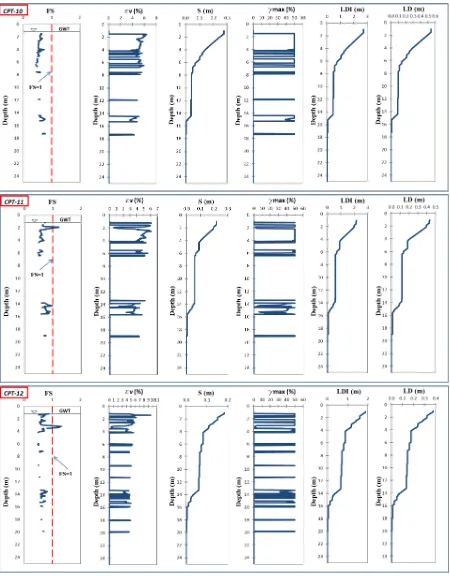
The results of the calculations are presented below in graphs for 12 CPT.
4. Discussions and Conclusions
Figure 2. Evaluation of the liquefaction-induced lateral spreading and settlement in CPT-1, CPT-2 and CPT-3.
Figure 3. Evaluation of the liquefaction-induced lateral spreading and settlement in CPT-4, CPT-5 and CPT-6.
Figure 4. Evaluation of the liquefaction-induced lateral spreading and settlement in CPT-7, CPT-8 and CPT-9.
increases. The limiting shear strains are calculated as a function of the equivalent clean-sand CPT penetration resistance and are limited to about 50% for computing LDI from individual soundings.
Figure 5. Evaluation of the liquefaction-induced lateral spreading and settlement in CPT-10, CPT-11and CPT-12.
Post-Liquefaction Reconsolidation Settlement: 0.15 m (CPT-7) up to 0.27 m (CPT-10); Lateral displacement index: 1.42 m (CPT-7) up to 2.88 m (CPT-1);
These conclusions are very important for the design and construction of engineering structures in this site.
References
[1] Allkja, S. (2006) Geological-Engineering Conditions of Construction Site at P.N.G. Terminal-Power Plant Semani. Geotechnical Report, Tirana, 136.
[2] Shkodrani, N., Daja, S. and Ormeni, R. (2010) Engineering Characteristics of the Expected Shaking at Semani Site in Albania. ACEE-2010, Proceedings of the 3rd Asia Conference on Earthquake Engineering Disaster Risk Reduction and Capacity Building for Safer Environnment, Bangkok, 1-3 Decemeber 2010.
.http://www.ait.ac.th/news-and-events/2010/ait-in-the-news/may/3rd-asia-conference-on-earthquake-engineering/#.VB
oT7vmSxyU
[3] Aliaj, Sh., Koçiu, S., Muço, B. and Sultarova, E. (2010) Seismicity, Seismotectonis and Seismic Hazard Evaluation in Albania. Publication of Academy of Sciences, Tirana.
[4] Idriss, I.M. and Boulanger, R.W. (2008) Soil Liquefaction during Earthquake. EERI Publication, Monograph MNO-12, Earthquake Engineering Research Institute,Oakland.https://www.eeri.org/
[5] Robertson, P.K. (2010) Soil Behaviour Type from the CPT: An Update. 2nd International Symposium on Cone Pene-tration Testing, Huntington Beach, Vol. 2, 575-583. www.cpt10.com/PDF_Files/2-56RobSBT.pdf
[6] Seed, H.B. and Idriss, I.M. (1971) Simplified Procedure for Evaluating Soil Liquefaction Potential. Journal of the Soil Mechanics and Foundations Division, ASCE 97, SM9, 1249-1273.
[7] Idriss, I.M. (1999) An Update to the Seed-Idriss Simplified Procedure for Evaluating Liquefaction Potential. Proceed- ings of TRB Workshop on New Approaches to Liquefaction, Federal Highway Administration, Washington DC, 10 January 1999.
http://www.worldcat.org/title/proceedings-trb-workshop-on-new-approaches-to-liquefaction-january-1999/oclc/428895
76
[8] Idriss, I.M. and Boulanger, R.W. (2003) Relating 𝐾𝐾𝛼𝛼 and 𝐾𝐾𝜎𝜎 to SPT Blow Count and to CPT Tip Resistance for Use in Evaluating Liquefaction Potential. Proceedings of the 20th Annual Conference of Association of State Dam Safety Officials, ASDSO, Lexington, 8-10 September 2003, 7-10.
http://scholar.google.com/citations?view_op=view_citation&hl=en&user=Z5HwZSMAAAAJ&cstart=20&pagesize=8
0&citation_for_view=Z5HwZSMAAAAJ:TFP_iSt0sucC
Notation
The following symbols are used in this paper: SPT = Standard Penetration Test
CPT = Cone Penetration Test
s
V = Shear Wave Velocity
max
a = peak ground acceleration
liq
FS = factor of safety against the triggering of liquefaction
, vc
M
CSR σ ′ = cyclic stress ratio
, vc M
CRR σ ′ = cyclic resistance ratio at a given earthquake magnitude and effective overburden stress
7.5, vc 1 M
CRR = σ ′ = = cyclic resistance ratio for moment magnitude of the earthquake M = 7.5 and effective over-
burden stress σ ′ =vc 1 atm
d
r = shear stress reduction coefficient to account for flexibility in soil profile M = moment magnitude of the earthquake
1 c Ncs
q = equivalent clean-sand CPT penetration resistance
1 c N
q = normalized over burden corrected CPT penetration resistance
c
I = soil behavior type index FC= fines content
N
C = over burden correction factor MSF= magnitude scaling factor
Kσ = correction factor for soils layers subjected to large static normal stresses
max
γ = maximum amplitude of cyclic shear strain
lim
γ = limiting value of shear strain Fα = limiting values of 𝐹𝐹𝐹𝐹𝑙𝑙𝑙𝑙𝑙𝑙
LD= actuallateral displacement
LDI= lateral displacement index
v