Munich Personal RePEc Archive
Development of Individual Farming in
Georgia: Descriptive Analysis and
Comparisons
Gogodze, Joseph and Kan, Iddo and Kimhi, Ayal
CRC Ltd. Georgia, Haifa University, Israel, The Hebrew University
of Jerusalem, Israel
2005
Online at
https://mpra.ub.uni-muenchen.de/11721/
Development of Individual Farming in Georgia:
Descriptive Analysis and Comparisons
Joseph Gogodze (CRC Ltd. Georgia), Iddo Kan (Haifa University, Israel)
Ayal Kimhi(The Hebrew University of Jerusalem, Israel)
Summary
The purpose of this paper is to examine the situation of individual farms in Georgia using a survey conducted in 2003, in comparison to a similar survey conducted in 1996. The basic issue investigated is the progress of the land individualization process, and the consequences of this process for the development of the agricultural sector, and more generally for the well-being of farm families and rural poverty.
We found significant changes in the farm sector. In particular, average landholdings have increased, mainly through leasing of plots. There is more specialization, with some farmers not producing at all and others expanding. Profits and income have deteriorated markedly, and many producers did not even sell their produce on the market. Those producers who leased land were much more likely to sell their produce on the market and they also had higher incomes and relied less on off-farm income and social assistance payments. Still, fewer than 15% of the farmers lease land. While the average age of the population has increased, the level of schooling declined. This indicates a possible “brain drain” process of selective out-migration. Another worrying implication of the income situation is the increase in the incidence of child labor.
These findings indicate that the potential of increased land transactions is still there, and a continuing specialization process that will enable successful farmers to acquire more land could improve the economic well-being of farm families even in a period of depressed produce prices.
____________________________________
Published in Privatization, liberalization, and the emergence of private farms in Georgia and other former Soviet countries, J. Gogodze and A.Kimhi, eds.; Tbilisi, Georgia: Color Publishing House, 2005, p. 9-38.
Introduction
In this paper we examine the situation of individual farms in Georgia using a survey conducted in 2003, compared to a baseline 1996 survey reported by Lerman (1996). The motivation is the slow progress of the land individualization process reported by Lerman (1996) and subsequent reports by FAO (1999) and Shuker (2000). We focus on the consequences of this process for the development of the agricultural sector, and more generally for the well-being of farm families and rural poverty. This paper is descriptive in nature and serves to motivate further research.
This report is based on a survey of Georgian small-farm households conducted in March-April 2003 in four “raions” (regions): Mtskheta, Dusheti, Sagarejo and Gardabany; 630 households in each raion (2,520 total). It was designed in a form corresponding to a previous survey of 1946 households, conducted in the same raions in April-May 1996. In order to facilitate assessment of variations between the two periods, the descriptive analysis in the current report follows the structure of Lerman’s (1996) report and provides comparisons where available. Accordingly, the survey questionnaire included several parts: household profile; land resources and land tenure; farm production; sale of farm products; purchase of farm inputs; farm labor; finances and credit; rural social aspects. Each of these will be reported in a different section.
Section 1. Profile of Households
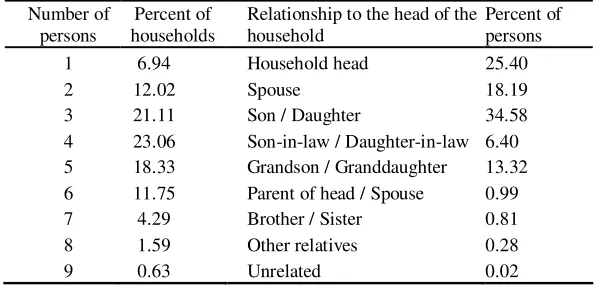
[image:3.612.156.453.574.717.2]The 2003 survey encompassed 2,520 households including a total of 10,080 family members. Similar to 1996, a typical family includes 3-5 members with an average of 4.0 persons. Table 1.1 presents the distribution of family size and of the relationships to the head of the household. A comparison of the distribution of age among children, youth, adults and seniors between the 2003 survey and the one in 1996 (Table 1.2) shows that the population has become older – the percent of seniors has grown by more than 6% on the expense of the other age groups. The average age of the seniors has also increased from 67 years in 1996 to 69, where the percent of seniors above 70 has doubled from 4% to 8%. The average age of the adults, however, remained 36 years. The fraction of males is 52 among the ages of 18 and below, 48 in the adults group, 45 among the seniors and 43 in the ages above 70. This indicates that, although the average age of seniors is 69 in both genders, women enjoy a higher life expectancy.
Table 1.1 - Distribution of family size and of the relationship to the head of the household
Number of persons
Percent of households
Relationship to the head of the household
Percent of persons
1 6.94 Household head 25.40
2 12.02 Spouse 18.19
3 21.11 Son / Daughter 34.58
4 23.06 Son-in-law / Daughter-in-law 6.40 5 18.33 Grandson / Granddaughter 13.32 6 11.75 Parent of head / Spouse 0.99 7 4.29 Brother / Sister 0.81
8 1.59 Other relatives 0.28
Table 1.2 – Age distribution
Percent
Age group 1996 2003
Children (under 12) 15.3 12.9 Youth (between 12 and 18) 11.5 10.8 Adults (between 18 and 60) 59.5 56.4 Seniors (60 and older) 13.6 19.9
There are no significant gender differences in educational attainment. Table 1.3 shows that the rate of adults (18-60) having higher or technical education has declined by more than 15% from 1996 to 2003. This could indicate out-migration of higher educated persons, leaving the farming activities to the less educated family members. This is supported by the fact that educational attainment is higher for younger cohorts.
Table 1.3 – Adults’ and seniors’ education level (%)
Adults Seniors
Education level 1996 2003 1996 2003
Higher education 35.2 23.5 12.5 9.2
Technical 31.4 27.0 18.1 15.8
Other 33.4 49.5 69.4 74.9
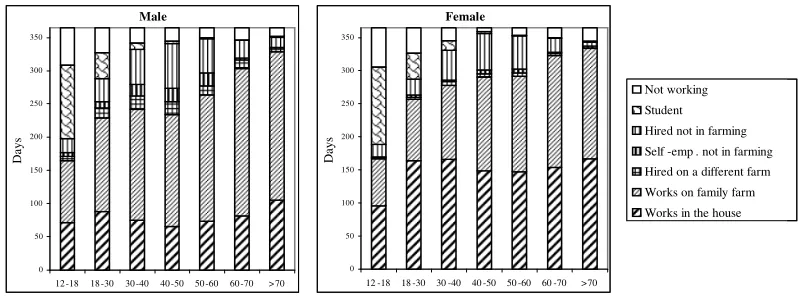
Looking at the primary activity of adult household members, we find that about half of them work mainly in the house and the family farm. Some 30% of them work outside, 10% are students and 6% do not work. Seniors (age 60+) are officially retired; however, similar to 1996, 95% of them work, and 10% are working off-farm. 74% of the children 12 years old and under are students; for 15% of them, work was marked as their main activity. This is in contrast to 1996, when in general children did not work. Among the youth, 75% are students and almost all the others work. Time-allocation among activities changes with age and gender. Figure 1.1 shows the allocation of time of an average male and female by age. Overall, women spend more time in household and farm activities; however, males devote more time to farm activities. Males spend more time doing hired work in other farms and in self-employment non-farming activities; there is no considerable gender difference in the time spent in hired non-agricultural work.
Figure 1.1 – Variation with age of annual time allocation of average male and female Male
0 50 100 150 200 250 300 350
12 -18 18 -30 30 -40 40 -50 50 -60 60 -70 >70
D
ay
s
Not working
Student Hired not in farming Self -emp . not in farming Hired on a different farm Works on family farm Works in the house
Female
0 50 100 150 200 250 300 350
12 -18 18 -30 30 -40 40 -50 50 -60 60 -70 >70
D
ay
Table 1.4 shows that the formation of individual farms and/or intergenerational farm succession is continuing beyond 1996. 7% of respondents indicated starting their independent activity after 1996.
Table 1.4 – Period of becoming an independent farmer (% of respondents)
1996 2003 Before 1992 (landmark resolution) 50.27 27.31
1992-1996 49.73 65.95
1996-2003 - 6.96
18% of Georgian farms are operated by more than one family compared to about 6% in 1996. As indicated by Lerman (1996), this cooperation is probably among parents and their married children’s families.
The typical family head is a male (75% of respondents relative to 64% in 1996), 56 years old (relative to 44 in 1996), with complete high school or technical education (75% of respondents). 52% of household heads are seniors (compared to 40% in 1996) with an average age of 70 (68 in 1996). An average family head works 53% of the year on the farm, 25% in the house, 6% in other farms or non-farming family business and 10% for wage in non-farming activities.
About 50% of respondents have worked in a collective farm before becoming independent farmers, 25% in industrial enterprises, 12% in social or administration spheres and 9% have served in he army. 70% of the respondents were qualified or unqualified workers in their previously held jobs and 22% were managers or professional specialists; the rest were mostly social sphere employees.
2. Family Income
Farm production has become a more significant source of income since 1996. Figure 2.1 shows that while in 1996 only 10% of the respondents said that agricultural income constitutes over 75% of their family income, this fraction rose to over 30% in 2003. This is a sign that a specialization process has begun: more farms are becoming agricultural-dependent economic units.
Figure 2.1 – Respondents’ evaluations of agricultural-income portion in their total income.
0 10 20 30 40 50 60 70 80 90 100
1996 2003
percent of farms
Figure 2.2 shows the shares of income sources of an average household in 2003. About 43% of the income is from farm sources, 26.5% from salaries and wages from off-farm sources, and 8.7% from non-farming businesses. The rest, 22 percents of the income, come from social public support and private sources. This substantial external aid can be explained by both the increasing rate of seniors in the farmers’ population and the fact that relying on agriculture as the main income source has become much more difficult since 1996; however, it is obvious that off-farm income is still the major source of income for the average family.
Private remittances
7%
Social assistance 14%
Off-farm paid work
26% Non-farm
business 9% Farm income
[image:6.612.158.447.195.444.2]44%
Figure 2.2 – Distribution of income-sources’ shares
3. Land Holding and Land Tenure
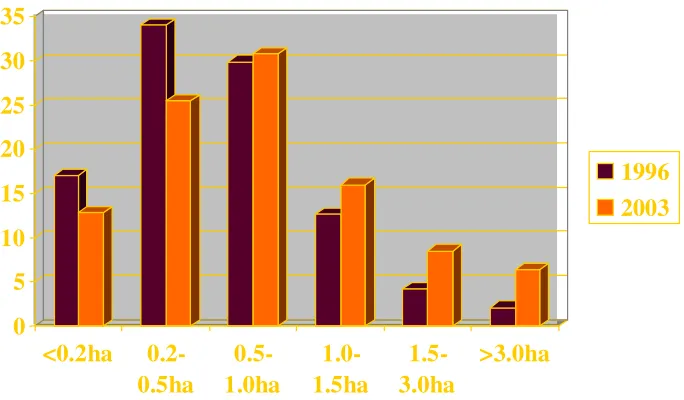
Figure 3.1 portrays the changes in farm-size distribution and 1996’s. Farms are larger in 2003 than in 1996. This is attributed mainly to a significant increase in the amount of leased land. While the size of land owned by a typical farm has grown from 0.74 ha in 1996 to 0.81 ha in 2003, an average farm rents about 0.77 ha in 2003 relative to only 0.16 ha in 1996. The share of leasing-land farms in 2003 is 12% relative to 2% in 1996. On average, a farm that rents land owns 0.66 ha (0.85 ha in 1996), while a non-leasing one owns 0.84 ha (0.73 ha in 1996). Note that compared to 0.5% in 1996, 4% of the farms do not own private land at all in 2003; of which, 3% lease land with an average size of 9.8 ha. This may be responsible for some of the observed change in the landholding distribution but not for all of it.
Figure 3.1 – Distribution of farms size (ha)
Table 3.1 – Spatial size distribution of an average farm (ha)
Total Private Leased
1996 2003 1996 2003 1996 2003
All sample 0.90 1.59 0.74 0.81 0.16 0.77 Gardabani 0.71 2.23 0.45 0.62 0.26 1.61 Mtskheta 0.76 0.86 0.53 0.80 0.23 0.05 Dusheti 1.02 1.01 1.02 0.99 0.00 0.01 Sagarejo 1.11 2.26 0.94 0.84 0.16 1.41
[image:7.612.153.495.86.286.2]An average farm operates 2.4 parcels in 2003, where 62% of the farms treat up to 2 parcels (Table 3.2). This is a reduction of 12% relative to 1996, indicating that farmers today till a larger number of plots.
Table 3.2 - Distribution of number of parcels per farm (% of farms)
Total Private Leased
Number of
parcels 1996 2003 1996 2003 1996 2003
0 0.4 1.0 0.39 3.4 97.9 87.4
1 31.3 24.8 30.4 28.7 1.6 9.3
2 42.7 36.0 43.3 32.3 0.3 2.1
3 19.0 22.7 19.27 21.5 0.2 1.2
4 4.2 9.3 4.26 8.5 0.1 0.0
5 1.0 3.1 1.05 2.8 0.0 0.0
6 0.7 2.0 0.72 1.9 0.0 0.0
7 0.2 0.8 0.22 0.8 0.0 0.0
The average plot-size is 0.67 ha in 2003, where the areas of private and leased plots are 0.37 ha and 4.71 ha, respectively. The average distance from the household’s
0
5
10
15
20
25
30
35
<0.2ha
0.2-0.5ha
0.5-1.0ha
1.0-1.5ha
1.5-3.0ha
>3.0ha
1996
home to his plots is 1.25 km, where the maximum reported distance is 25 km. The average distance to a leased plot is much longer – 3.7 km. In per-hectare terms, a typical farmer lives 1.5 km from one hectare of his private lands and 4.0 km from a hectare he leases. Larger private plots are located farther: an increase by a hectare in the size of a private plot increases the distance to this plot by 239 meters. This feature is minor in the case of leased plots – the (statistically significant) increase is 20 meters per hectare.
There has been an increase in the leasing term between 1996 and 2003; only 23% of lessees rent a parcel for up to one year in 2003 relative to more than 50% in 1996. 33% of the plots are leased for periods of 1-5 years in 2003 versus 16% in 1996. Leasing for periods of 5 years and more has increased from about one third in 1996 to 44% in 2003.
The source of about half the private and lease plots in 2003 is the village authorities (Table 3.3). 27% of the private parcels were inherited, where 37% of the leased land is from agricultural enterprises.
Table 3.3 – Sources of land
Percent of total holdings in an average farm
Private Leased
Percent of parcels in 2003 1996 2003 1996 2003 Private Leased
Regional authorities 15 6 75 50 5 12
Village authorities 73 63 19 32 54 47
Agricultural enterprise 9 15 2 17 13 37
Other organizations 1 0 4 0 0 0
Inherited na 15 na 0 27 0
Private person 2 1 0 1 2 4
Table 3.4 shows the uses of land in an average farm. The main difference between 1996 and 2003 is in the leased lands: the portions of hay meadows and pasture have increased on the expense of other uses; these changes are attributed to the increase in the leased agricultural areas in Gardabani and Sagarejo regions.
Table 3.4 – Uses of land (percent of total land)
All sample Leased lands Private lands
1996 2003 1996 2003 1996 2003
Arable 67 59 83 57 63 62
Orchards 8 5 6 0 9 11
Grapes 13 6 5 0 14 13
Hay meadows 8 15 3 16 10 13
Pasture 3 15 3 26 3 1
Other 1 0 0 0 1 1
44% of the agricultural parcels are at least partly irrigated in 2003(Table 3.5). The percentage of leased irrigated plots is higher, 55%, mainly because of the high portion of irrigated parcels in Sagarejo region.
the leasing term is up to 3 years in 80% of the cases. A wide range of answers was given to the question: “how much do you get in rent per year per hectare of leased land?” about half mentioned 2 lari/ha per year, all of them in Sagarejo, and the others indicated payments of 20-500 lari/ha per year.
Table 3.5 – Percentage of irrigated land in 2003
Private lands Leased lands All lands Irrigated Not irrigated Irrigated Not irrigated Irrigated Not irrigated
All regions 44 56 55 45 44 56
Matskheta 54 46 30 70 54 46
Dusheti 21 79 33 67 21 79
Sagarejo 47 53 60 40 49 51
Gardabani 60 40 37 63 59 41
There is an interesting change in farmers’ attitudes toward increasing their land size. In 1996, farmers’ statements were more decisive: 52% were in favour of an increase, 40% were against it, and 8% were not sure. In 2003, farmers show a more hesitative behaviour: 41% are in favour of an increase, one percent does not want additional land, and 58% are not sure. This might indicate that households have internalised the uncertainty associated with a capitalistic economy, and also reflects the poor farm earnings in 2003.
Compared to 65% in 1996, 80% of the respondents denote full private as the favoured form of ownership in 2003; 12% indicate permanent use as the preferred status compared to 26% in 1996. Farmers are more open to land transactions in 2003. 66% are in favour of the law that allows for buying and selling of land, compared to only 24% in 1996. This might be evidence for a relief in the sentiment against buy-and-sell transactions, attributed by Lerman (1996) to the concern about speculations and accumulation of land in the hands of few wealthy persons.
70% of the 2003 respondents report possessing any official document certifying ownership; this is an increase of more than 30% relative to 1996. Half of those who hold ownership certificates have paid for them. The payment (including notary) varies between 0.02 lari to 520 lari, where on average farmers have paid 37 lari (12 lari in 1996). 6% (12% in 1996) of those without official documents declare that they didn’t want to pay for them, 28% (40%) blame the authorities and 65% (48%) fail to name the reason. On average both those who own documents and those who don’t are willing to pay 9 lari for official titles. This is a reduction relative to 1996, where the average willingness to pay was 15 lari.
Nearly half the respondents have paid land taxes in 2002; the same as 1995. The average payment of those who did pay is 52 lari per ha (30 in 1996), however, the payments vary in a range of 0.8 - 750 lari/ha.
Payment for rented land is by money; only 2% report a payment by a share of the output (barter). The average annual rent is 60 lari/ha, where rentals vary in a range of 2 – 600 lari/ha.
4. Farm Production
Almost all farmers are engaged in crop production; however, the number of crops grown by each farm has declined on average. Figure 4.1 presents the distribution of the average number of crops, showing a decrease in the percent of farms growing 3-6 crops and increase in those who grow 0-2 crops. The average number of crops is 3.1 in 2003 versus 3.6 in 1996. Hence, although farmers do not completely specialize, there is a slow trend of specialization.
[image:10.612.136.466.178.354.2]
Figure 4.1 – Frequency of number of crops grown by a farm
Cropping patterns are shown in Table 4.1. Among the field crops, farmers tend to grow less corn and beans and more wheat and barley in 2003, compared to 1996. Fewer farmers are growing garden crops such as potato, fruit and grapes, while vegetable growing has slightly increased. Hay growing has become significantly more popular among farmers. Land allocation patterns reveal a considerable increase in the portion devoted to wheat and barley. This increase is not on the expense of other crops; it is attributed to the increase in the size of the farms. As can be seen in the last two columns of Table 4.1, only the area devoted to beans has declined, while the size of wheat and barley is four times larger in 2003 than in 1996, and that of hay has doubled. The main changes have occurred in Gardabani and Sagarejo regions, where the average farm size has sharply increased (see Table 3.1).
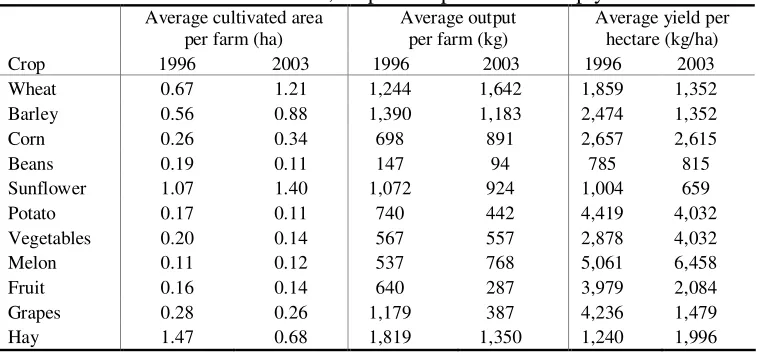
Table 4.2 presents the average plot sown for each crop by farmers who grow it, the average output and the typical per-hectare yield. Considering the aforementioned increase in the total area devoted to wheat and barley, this increase is explained by both the increase in land allocated to these crops and the increase in the portion of farmers that choose to grow these crops. In contrast, there is a reduction in the size of plots devoted to hay; hence, the increase in the total land devoted to hay is attributed to the increase in the percent of farmers that grow this crop.
Between 1996 and 2003, per-hectare yields of several crops, including wheat, barley, sunflowers, potatoes, fruits and grapes, have decreased, in some cases quite substantially. Other crops, including vegetables, melons and hay, experienced increases in yields.
0 5 10 15 20 25 30
0 1 2 3 4 5 6 7 8
Number of crops grown
P
e
rc
e
n
t
o
f
re
s
p
o
n
d
e
n
ts 1996
Table 4.1 – Percents of farms growing each crop, land allocation among crops, and areas of crops in an average farm
Portion of farms Portion of land Average area (ha)
Crop 1996 2003 1996 2003 1996 2003
Wheat 20 26 13 30 0.12 0.47
Barley 6 9 4 8 0.03 0.12
Corn 62 32 16 10 0.14 0.17
Beans 42 24 8 3 0.07 0.04
Sunflower 5 4 5 5 0.05 0.08
Potato 55 47 9 5 0.08 0.08
Vegetables 60 63 11 8 0.10 0.13
Melon 11 15 1 2 0.01 0.03
Fruit 42 30 7 4 0.06 0.06
Grapes 47 32 13 8 0.11 0.12
Hay 9 25 13 16 0.12 0.25
Other 2 4 1 2 0.01 0.03
Table 4.2 – Cultivated area, output and per-hectare crop yields
Average cultivated area per farm (ha)
Average output per farm (kg)
Average yield per hectare (kg/ha) Crop 1996 2003 1996 2003 1996 2003
Wheat 0.67 1.21 1,244 1,642 1,859 1,352
Barley 0.56 0.88 1,390 1,183 2,474 1,352
Corn 0.26 0.34 698 891 2,657 2,615
Beans 0.19 0.11 147 94 785 815
Sunflower 1.07 1.40 1,072 924 1,004 659
Potato 0.17 0.11 740 442 4,419 4,032
Vegetables 0.20 0.14 567 557 2,878 4,032
Melon 0.11 0.12 537 768 5,061 6,458
Fruit 0.16 0.14 640 287 3,979 2,084
Grapes 0.28 0.26 1,179 387 4,236 1,479
Hay 1.47 0.68 1,819 1,350 1,240 1,996
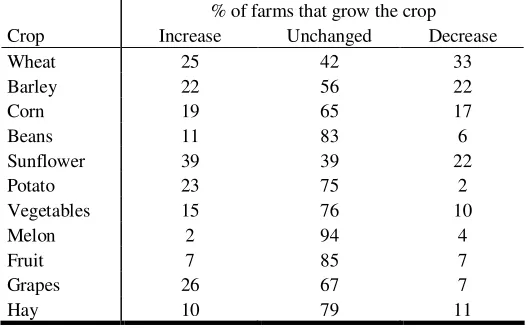
Farmers were asked to list the crops they intend to increase the portion of land devoted to, on the expense of other crops (Table 4.3). Among those who grow the respective crops, in most cases there were equal fractions of farmers intending to increase and decrease the land portion; exceptions are potato and grapes, in which there is about 20% more farms that are in favour of increasing land portions. Logistic regressions revealed that the intention to increase the land devoted to wheat and corn is significantly related to the size of these plots, whereas plans to increase vegetable production are associated with higher per-hectare yield.
[image:11.612.123.502.308.485.2]two in 1996. There are no remarkable changes in livestock production either (Table 4.5). There is was increase of 100 litters in annual milk production per cow, from 762 litters in 1996 to 867 litters in 2003. Still, less than 3% of the farmers report yields higher than 2,000 litters. On the other hand, production of beef and pork has declined.
Table 4.3 – Farmers’ intentions with respect to changing the portion of land devoted to each crop on the expense of other crops.
% of farms that grow the crop Crop Increase Unchanged Decrease
Wheat 25 42 33
Barley 22 56 22
Corn 19 65 17
Beans 11 83 6
Sunflower 39 39 22
Potato 23 75 2
Vegetables 15 76 10
Melon 2 94 4
Fruit 7 85 7
Grapes 26 67 7
Hay 10 79 11
Table 4.4 – Percents of livestock breeders and herd size
Percent of farms Number of heads per farm*
Livestock 1996 2003 1996 2003
Bulls 17 12 1.9 1.7
Cows 62 64 2.3 2.1
Heifers 32 25 1.6 1.7
Calves 28 36 1.6 1.6
Pigs 39 28 2.6 2.8
Piglets 18 15 6.0 4.6
Sheep & goats 29 24 14.0 34.8
Horses 4 6 2.4 1.1
Chickens 63 73 13.4 14.6
Other poultry 15 11 7.4 4.6
Rabbits 5 3 6.3 4.8
Bee hives 5 3 8.3 8.5
* Average for a farm breeding the type of animal.
Table 4.5 – Livestock production
Percent of producers among all farmers
Farm's production (kg/year) Product 1996 2003 1996 2003
Beef 28 24 190 166
Pork 41 39 160 119
Mutton 15 12 90 83
Egg 62 68 1037 917
Poultry meat 35 50 35 30
Milk 63 63 1500 1994
Wool 21 12 50 85
[image:12.612.185.428.571.715.2]Among animal breeders in 2003, 63% produce on their own up to 50% of the hay they use; this is compared to 71% of the breeders in 1996. On the other hand, 28% produce up to 50% of their concentrated fodder, compared to 16% in 1996. 41% of the respondents indicate that they use at least ¼ of the grains they produce for feeding animals; in 1996 only 12% were doing so. Only 55% of farmers that breed livestock in 2003 report that they use communal grassland; this is compared to over 80% in 1996. Only 20% of the animal breeders pay for grazing in 2003, where the payment is commonly according to number of heads of cattle. The most frequent price is 5 lari per head. Renting pasture is rare – about 1% of breeders.
5. Sales of Farm Products
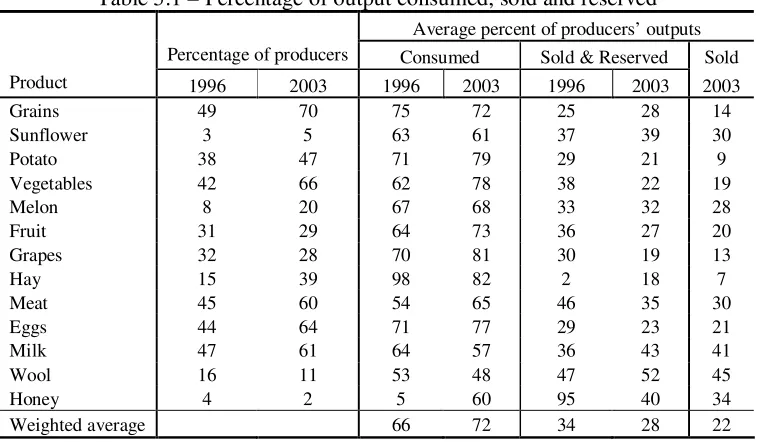
[image:13.612.117.497.283.504.2]About 72% of farm production in 2003 is for self-consumption (Table 5.1), an increase of 6% over 1996. Moderate increases are seen in most of the products; significant reduction was identified only in the case of hay. There is also an increase in the number of products produced by an average farm, from 3.7 to 5.0.
Table 5.1 – Percentage of output consumed, sold and reserved
Average percent of producers’ outputs Percentage of producers Consumed Sold & Reserved Sold
Product 1996 2003 1996 2003 1996 2003 2003
Grains 49 70 75 72 25 28 14
Sunflower 3 5 63 61 37 39 30
Potato 38 47 71 79 29 21 9
Vegetables 42 66 62 78 38 22 19
Melon 8 20 67 68 33 32 28
Fruit 31 29 64 73 36 27 20
Grapes 32 28 70 81 30 19 13
Hay 15 39 98 82 2 18 7
Meat 45 60 54 65 46 35 30
Eggs 44 64 71 77 29 23 21
Milk 47 61 64 57 36 43 41
Wool 16 11 53 48 47 52 45
Honey 4 2 5 60 95 40 34
Weighted average 66 72 34 28 22
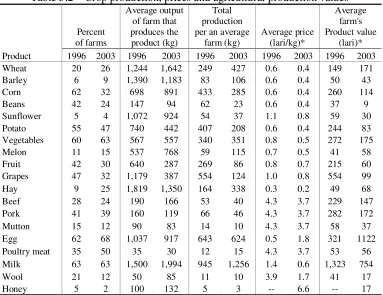
Table 5.2 – Crop production, prices and agricultural production values
Percent of farms
Average output of farm that produces the product (kg)
Total production per an average
farm (kg)
Average price (lari/kg)*
[image:14.612.116.499.77.372.2]Average farm's Product value
(lari)* Product 1996 2003 1996 2003 1996 2003 1996 2003 1996 2003 Wheat 20 26 1,244 1,642 249 427 0.6 0.4 149 171 Barley 6 9 1,390 1,183 83 106 0.6 0.4 50 43 Corn 62 32 698 891 433 285 0.6 0.4 260 114
Beans 42 24 147 94 62 23 0.6 0.4 37 9
Sunflower 5 4 1,072 924 54 37 1.1 0.8 59 30 Potato 55 47 740 442 407 208 0.6 0.4 244 83 Vegetables 60 63 567 557 340 351 0.8 0.5 272 175
Melon 11 15 537 768 59 115 0.7 0.5 41 58
Fruit 42 30 640 287 269 86 0.8 0.7 215 60 Grapes 47 32 1,179 387 554 124 1.0 0.8 554 99 Hay 9 25 1,819 1,350 164 338 0.3 0.2 49 68
Beef 28 24 190 166 53 40 4.3 3.7 229 147
Pork 41 39 160 119 66 46 4.3 3.7 282 172
Mutton 15 12 90 83 14 10 4.3 3.7 58 37
Egg 62 68 1,037 917 643 624 0.5 1.8 321 1122 Poultry meat 35 50 35 30 12 15 4.3 3.7 53 56 Milk 63 63 1,500 1,994 945 1,256 1.4 0.6 1,323 754
Wool 21 12 50 85 11 10 3.9 1.7 41 17
Honey 5 2 100 132 5 3 -- 6.6 -- 17
* In 2003 laris; prices were capitalized according to the consumer price index (1996=100, 2003=153);
Table 5.3 – Agricultural production
Consumed Sold/Reserved Total 1996 2003 1996 2003 1996 2003 Crops 1,914 1,584 760 515 2,673 2,099 Livestock 1,145 1,275 603 729 1,748 2,004 Production
(kg/year)
All products 3,059 2,859 1,362 1,244 4,421 4,103 Crops 1,353 682 578 227 1,931 909 Livestock 1,432 1,580 875 742 2,307 2,322 Average farm's
production
value (lari) All products 2,785 2,262 1,453 970 4,238 3,231 Average Crops 0.71 0.43 0.76 0.44 0.72 0.43 price (lari/kg) Livestock 1.25 1.24 1.45 1.02 1.32 1.16 All products 0.91 0.79 1.07 0.78 0.96 0.79
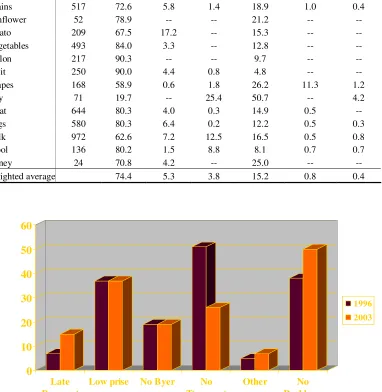
As in 1996, selling directly to consumers was the most popular sale channel in 2003 (Table 5.4). This is done mainly in the market and also on the roadside. The exception is hay, in which sales take place mostly in the field or through wholesalers. Wholesalers are the second common channel and they hold considerable shares in marketing grapes and honey. Large governmental and private organizations serve as a relevant channel only in the case of grapes.
difficulties of low prices and finding buyers remain unchanged, while there is a significant reduction in transportation problems. The percentage of farmers that didn't mention any difficulty with sales has increased by more than 10%; this might be attributed to the adoption to a capitalistic economy.
Table 5.4 – Main sales channels in 2003
(percentage of commercial farmers indicating each channel as the main channel)
Product
Number of farms with
sales
In the market
On the roadside
In the field
or farm Wholesalers
Large
organizations Other
Grains 517 72.6 5.8 1.4 18.9 1.0 0.4
Sunflower 52 78.9 -- -- 21.2 -- --
Potato 209 67.5 17.2 -- 15.3 -- --
Vegetables 493 84.0 3.3 -- 12.8 -- --
Melon 217 90.3 -- -- 9.7 -- --
Fruit 250 90.0 4.4 0.8 4.8 -- --
Grapes 168 58.9 0.6 1.8 26.2 11.3 1.2
Hay 71 19.7 -- 25.4 50.7 -- 4.2
Meat 644 80.3 4.0 0.3 14.9 0.5 --
Eggs 580 80.3 6.4 0.2 12.2 0.5 0.3
Milk 972 62.6 7.2 12.5 16.5 0.5 0.8
Wool 136 80.2 1.5 8.8 8.1 0.7 0.7
Honey 24 70.8 4.2 -- 25.0 -- --
Weighted average 74.4 5.3 3.8 15.2 0.8 0.4
0 10 20 30 40 50 60
Late Payment
Low prise No Byer No
Ttansport
Other No
Problems
1996 2003
Figure 5.1 – Difficulties with sales of farm products
6. Farm Resources and Inputs
[image:15.612.145.501.410.593.2]employ hired hands; this is compared to less than 1% in 1996. Farms employing year-round hired labour are relatively large, with an average area of over 3 hectares. 3.7% of the farms employ more than 5 workers during the year; the maximum reported is 100 employees. These farms operate 12 hectares of land on average, among which 9.5 are leased. The average annual cost of hired labor is 72 lari. Considering seasonal workers as employed for 3 months a year, the average wage is 10 lari/month, ranging from 1 to 1000 lari/month.
Table 6.1 – Distribution of farm-workers number (%)
2003 1996
All year Seasonal Total Total
Family members
Hired
workers Total
Family members
Hired
workers Total
0 4.6 95.5 4.4 62.6 56.8 36.2 2.4 5.4
1 20.9 2.9 20.6 14.3 20.4 19.6 6.4 11.3
2 43.1 1.3 41.7 13.7 9.1 16.8 22.9 37.5
3 17.9 0.3 18.0 6.3 8.7 14.4 17.2 21.2
4 9.8 0.0 10.2 2.7 2.1 6.0 19.7 17.9
5 2.6 0.0 3.5 0.4 1.4 3.4 10.3 4.8
6 and more 1.2 0.1 1.6 0.1 1.4 3.7 21.1 1.9
Average number of
workers 2.20 0.07 2.27 0.74 1.06 1.80 4.07 2.65
Farmers tend to rent machinery rather than owning it. Table 6.2 shows that renting from private persons is the most common source of access to machinery; state organizations and commercial firms are a secondary source. Joint ownership exists to some extent. More than 60% of the respondents report renting tractors; trucks, ploughs, sowing machines, cultivators and combines are rented by about 30% of the farmers. Some 5% of the farmers hold mini-tractors – a decrease of 10% relative to 1996. As in 1996, milking machines are very rare.
Table 6.2 – Farms machinery usage (% of farms)
1996 2003
Machine
Owned by myself or
by my family
Owned by myself or
by my family
Owned jointly with
other farmers
Rented from private individuals
Rented from state organizations or commercial firm
Tractors 2.4 3.3 0.6 53.5 7.1
Mini-tractor 15.4 5.2 0.2 3.9 0.4
Truck 2.9 4.6 0.2 22.3 2.9
Plough 1.7 3.9 0.7 28.6 3.8
Swing machine 1.6 1.0 0.5 23.2 3.5
Hay machine 0.8 0.6 0.2 9.3 1.3
Cultivator 1.1 1.9 1.0 26.8 3.4
Combine/harvester 0.4 0.6 0.2 25.4 2.5
Sprinkler/ sprayer 15.7 0.9 0.1 4.8 0.8
Potato digger 3.1 0.1 0.0 0.2 0.0
Milking machine 0.2 0.1 0.0 0.0 0.0
[image:16.612.116.495.504.717.2]The percentage of farms reporting purchase of inputs has significantly declined, from an average of 25.0% in 1996 to 13.5% in 2003. The decline is observed in all types of inputs except fuel and veterinary medicines and services. This is consistent with the reduction in real farm income (Section 2, Section 5), implying that farmers are forced to rely more on their own resources. As in the case of selling farm products, there are fewer complaints about access difficulties, especially with regards to high prices; the percentage of respondents indicating no problems has increased from 17% in 1996 to 86% in 2003.
Table 6.3 – Input purchase and access difficulties
Difficulties in purchasing the input (% of farms) Percent of
farms that purchase the
input High prices Not available No problems
Expense per farm that purchases the
input (lari) Input 1996 2003 1996 2003 1996 2003 1996 2003 2003 Seeds/seedlings 75.0 34.8 26.7 21.5 1.1 12.1 60.5 74.4 111.3 Fodder 47.1 29.0 39.3 22.7 1.3 6.9 29.6 76.5 240.1 Young animals 18.3 4.1 42.7 9.0 1.3 6.6 12.8 90.0 162.8 Organic fertilizer 20.2 4.0 38.0 0.0 4.0 5.0 16.8 94.9 68.0 Mineral fertilizer 27.5 12.9 42.8 14.2 4.7 10.9 17.3 81.8 61.2 Herbicides/insecticides 33.9 15.1 42.5 13.3 3.4 3.6 28.6 84.2 91.7 Farm machinery 14.7 1.7 55.1 6.9 3.1 7.0 8.1 90.6 257.3 Maintenance/repair 9.9 4.1 51.3 3.7 3.5 2.7 5.9 93.9 111.8 Spare parts 13.3 2.8 52.0 6.7 3.4 6.6 7.2 90.8 194.7 Fuel and oils 39.9 43.1 42.8 31.6 2.8 8.5 18.9 65.5 97.8 Machine service 34.5 17.4 44.2 12.6 2.8 3.3 18.3 84.6 102.5 Veterinary medicines 20.0 23.3 45.7 14.5 2.9 4.3 9.7 82.9 32.5 Veterinary services 19.3 19.8 43.1 9.4 2.8 1.9 11.1 89.1 22.0 Construction materials 8.6 2.5 55.3 6.3 2.6 3.1 4.1 91.3 586.3 Construction services 8.2 0.3 52.1 5.0 2.6 2.5 4.1 92.6 241.4 Consulting 9.5 0.2 36.3 3.0 2.0 2.4 14.1 94.6 6.75 Average* 25.0 13.5 44.4 11.3 2.8 5.5 16.7 86.1 241.3** *Arithmetic average of percentage across all inputs.
** Weighted average; representing the annual expenses of an average farm on input purchase.
Infrastructures in the farm residence have not changed since 1996 (Table 6.4); 75% of the respondents have access to water from a pipe or a well, electricity is available for about 88%, and 87% have access to roads. There is, however, a reduction in the availability of water and electricity in the farm buildings.
Table 6.4 – Percents of farms having infrastructures and communication instruments
In the house In the farm building
Supply 1996 2003 1996 2003
Water 75 75 38 16
Electricity 92 88 52 29
Telephone - 8 - 2
Cellular phone - 18 - -
[image:17.612.121.495.601.684.2]7. Finance: Investments, Assets, Farm Income, and Credit
[image:18.612.118.493.165.272.2]Less than 11% of the sampled farms have invested in fixed assets during 2002 (Table 7.1); this is compared to about 99% of the farms in 1995, when private agricultural activity was in its early phase. The average annual investment per investing farm in 2002 was 2,723 lari ($1,245), where investments ranged between 30 and 134,000 lari. Own savings are almost the single source for investment.
Table 7.1 – Investment sources
Percent of farmers with investments
Average investment (lari)
Percent of total investments Source 1995 2002 1995* 2002 1995 2002
Own savings 92.4 10.2 492 2,766 78.4 97.0
Family and friends 19.8 0.4 623 282 21.2 0.4 Commercial institutions 0.0 0.2 0 2,672 0.0 2.2
Other 0.2 0.1 1,403 1,300 0.4 0.4
All sources 98.9 10.6 597 2,723 100.0 100.0 * in terms of 2002 laris.
In 2002, there was a statistically-significant positive dependence of investments on the size of the leased plot, with a coefficient of 105 lari/ha. The revenue from sales of agricultural products, as evaluated by the farmers, also has a positive impact on investments – one additional lari of revenue increases the investment by 0.38 lari. Investments are also correlated with the value of fixed assets, where every additional lari of assets leads to an additional 0.07 lari of investment. On the other hand, an increase of one lari in calculated net-profit reduces investments by 0.56 lari.
The average value of farm assets, including buildings, machinery and equipment, as evaluated by farmers, is nearly 20,000 lari ($9,100), in 2002. In 1996, assets were estimated at 36,000 lari, which are equivalent to 55,000 lari in terms of 2003 prices. Figure 7.1 compares the distributions of assets in the two years in 2003 prices, showing a considerable reduction in assrts from 1996 to 2002.
0 5 10 15 20 25 30 35 40 45 50
Up to 10 10-20 20-30 30-40 40-50 50-90 over 90
Thousand lari (2003 lari)
P
e
rc
e
n
t
o
f
fa
rm
s
1996 2003
[image:18.612.117.442.482.677.2]Total income from sales of agricultural products has been 1,217 lari/farm in 2002, on average (Table 7.2). Other farm income sources amounted to 93 lari. Average farm costs, including hired labor (37 lari), purchase of inputs (309 lari), land lease (29 lari), transportation (40 lari), water (12 lari) and taxes (43 lari) totaled 473 lari. Hence, the average net-profit was 837 lari ($383) per farm. This is about 55% of the average profit in 1995 – 1,532 lari (in terms of 2003 lari, capitalized based on the consumer prices index). Profits in Dusheti, Gardabani, Mtskheta and Sagarejo are 1,089, 1,042, 827 and 368 lari, respectively; the most dramatic change has occurred in Sagarejo, where profits have been reduced by 72%.
[image:19.612.116.491.209.299.2]
Table 7.2 – Average farm's sales revenues, costs and profits in 1995 and 2002*
Sales Other sources Costs Profit Region 1995 2002 1995 2002 1995 2002 1995 2002 Dusheti 1,888 1,239 - 113 613 264 1,274 1,089 Gardabani 3,143 1,679 - 119 913 757 2,229 1,042 Mtskheta 2,281 935 - 75 1,163 182 1,118 827 Sagarejo 2,029 940 - 58 719 630 1,309 368 All sample 2,347 1,217 - 93 815 473 1,532 837 * all in 2003 laris
Similar to 1995, farms specializing in animal breeding were significantly more profitable in 2002, with 1,281 lari relative to 537 lari for crop specializing farms. The average profit in mixed farms was 881 lari. Leasing land does not contribute to profitability; an additional leased hectare increases farm income by 70 lari, but increases costs by 210 lari. The average margin of profit on sales (including other farm's resources) has not changed and is about 70%. The average return on assets has increased from 7% to 15%, indicating that the reduction in profits exceeds the decline in assets values. The percentage of farms that reported losses has doubled from 8% in 1995 to 16% in 2002 (Figure 7.2); the fraction of those who earned more than 1000 lari (in 2003 prices) has reduced from 46% to 26%.
0 5 10 15 20 25 30 35 40
no profit 0-500 500-1000 1000-2000 2000-3000 over 3000
2003 lari
P
e
rc
e
n
t
o
f
fa
rm
s
1996 2003
Figure 7.2 – Farms profit distribution (in 2003 lari)
[image:19.612.119.490.466.663.2]in Georgia. Farmers, hence, earned 29% of the GDP per capita in 2002, whereas in 1996 their income only from farming activities was $793 (in 1996 dollars) -- 59% of the GDP per capita in that time ($1,350).
[image:20.612.114.496.231.333.2]3.7% of the respondents have reported loans that were taken during 2002. This implies that borrowing is still very uncommon, although there is a slight increase relative to 1996, when less than 1% of the respondents have reported loans taken in 1995. The fraction of farmers that borrowed from commercial banks is nearly 40% (Table 7.3), where the share of commercial banks is about 50% of the total amount borrowed in both short and long term loans. As expected, interest on loans from friends and relatives is lower in comparison to other sources, were the highest interest is for short term loans from private persons who are not relatives or friends.
Table 7.3 – Loans received in 2002
Up to 3 months Longer than 3 months
Source
Percent of farms
Amount (lari)
Interest (%/month)
Percent of farms
Amount (lari)
Interest (%/month) Commercial bank 0.7 1,047 3.3 0.8 2,460 3.1 Friends and relatives 0.6 521 0.8 0.5 1,433 0.7 Other private persons 0.5 610 12.5 0.5 2,746 3.8
Other sources 0.0 0 0.0 0.0 600 4.0
All sources 1.9 841 4.3 1.8 2,282 2.7
12% of the farmers (compared to less than 1% in 1996) report other debts, which range between 100 and 26,000 lari and average 1440 lari. 16% of outstanding debt (2% with respect to the whole sample) was borrowed from a bank, where the average outstanding debt is 2000 lari. However, only 0.6% of the respondents (0.5% in 1996) report that they keep money on deposit accounts in the bank; the interest ranges between 1% and 6% per month. 6% of the farmers had to provide security for loans they took, 75% of which put precious metals and stones, while the others mortgaged a house, land, animals or equipment.
2% of the farmers report that other farmers or private people owe them money, which amounts to 1,360 lari on average. Local and state authorities owe to 26% of the farmers; the average debt is 370 lari, where the maximum reported debt is 126,000 lari. 51% claim an average debt of 1,300 lari by other bodies, in a range between 1000 and 400,000 lari. This is a considerable change relative to 1996, when almost no farmer reported debts of others to him.
Farmers' declared credit needs are shown in Table 7.4. As in 1996, nearly 50% of the respondents need credit in 2003. The average amount has declined, but the median amount, the requested period and the interest rate farmers are willing to pay have increased.
Table 7.4 – Declared credit needs
1996 2003
Percent of farms 51 46
Average amount (lari)* 28,600 13,400
Median amount (lari)* 3,100 5,000
Average period (months) 20 27
Median period (months) 12 24
[image:20.612.165.448.604.705.2]According to farmers' responses, the availability of credit has improved between 1996 and 2003 (Table 7.5); relative to 21% in 1996, in 2003 43% of the farmers believe that they can borrow as much as necessary. Only 50% of the farmers experience difficulties in obtaining credit in 2003, compared to nearly 70% in 1996. Table 7.6 reflects an increase in the trust in banks as a potential source for credit for current expenses and capital investments, and a slight reduction in relying on relatives and friends. Yet, the percentage of farmers that have no financial source has not changed.
Table 7.5 – Answers to the question: "can you borrow as much money as necessary?" (percent of respondents)
Answer 1996 2003
Yes 11 19
Yes, but I don’t need credit 10 24
No, I can’t because the interest is too high 37 35 No, I can’t since there is no opportunity to get a loan even with high interest 21 7
Other (specify) 1 0
[image:21.612.159.457.363.473.2]Difficult to answer 21 16
Table 7.6 - Answers to the question: "in case of necessity, what are the sources from which you could borrow some money for current expenses and capital investments?"
(percent of respondents)
current expenses capital investments
Source 1996 2003 1996 2003
Relatives and friends 52 44 31 26.8
Bank 3 19 5 16
Farmer association 0 1 1 0
Processing plants 1 0 0 0
Commercial structures 0 1 2 0
No such source 39 34 57 55
Other 5 1 5 1
[image:21.612.106.511.578.686.2]Farmers are more willing to mortgage land in order to get credit, in 2003. Table 7.7 shows that those who are in favor of such a law, are also willing to mortgage their own land in order to obtain loans.
Table 7.7 – Attitudes to introduce the right to mortgage land for getting credit versus own willingness to mortgage private land for this purpose (percent of respondents)
Will you agree to mortgage your land if you cannot get the credit on other conditions?
Yes No No answer All
What is your attitude towards the right to mortgage land in
order to get credit? 1996 2003 1996 2003 1996 2003 1996 2003
Positive 12 28 2 3 2 2 16 33
Indifferent 3 5 5 9 4 1 12 15
Negative 2 1 38 21 6 3 46 25
Difficult to answer 1 5 11 15 15 7 27 27
8. Social Sphere
[image:22.612.105.508.184.445.2]Provision levels of most of the social services, which have been dramatically reduced through 1996, are still low, and in some cases even became worse (Table 8.1). Salary rise due to price increases was totally gone. Only 10% of the farmers enjoy pension augmentation relative to 25% in 1996. There is, however, a moderate increase in school and university aids, in prices of elementary goods and in medical services.
Table 8.1 – Provision of social services
Local or state authorities
Trade unions
or others Total
Service 1996 2003 1996 2003 1996 2003
Salary adjustment for growth of prices 39 0 0 0 40 1
Pension augmentation 25 9 0 2 26 11
Material aid for children 26 8 0 1 26 9
Preferential terms for children in preschool institutions 6 4 0 0 7 4 Preferential terms for children at school (free
transportation, free breakfasts) 1 11 0 0 1 11
Grants for students 1 3 0 8 2 11
Aid in construction and repair of house/farm buildings 0 4 0 2 1 6
Fuel supply 0 5 0 5 1 10
Discounts in purchasing foodstuff 0 5 1 5 1 10
Aid in buying goods 0 3 0 3 1 6
Reductions in payments for public utilities 1 1 0 0 1 1 Medical aid (prophylactic examination, drug price
reduction) 1 6 0 6 1 12
Reduction for a place in sanatorium, tourist camps 0 0 0 2 0 3 Reduction in payments for the apartment, electricity, etc. 0 0 0 3 1 3
Departmental accommodation 0 0 0 0 1 0
Transportation service 1 0 1 1 2 1
[image:22.612.140.473.547.622.2]Table 8.2 presents the distribution of purchasing power among respondents. Although there is a reduction in the fraction of farmers that face difficulties in buying food, the percentage of those who can procure electrical instrument or vehicles is still about 1%.
Table 8.2 – Respondents' evaluation of the purchase power of their income
Purchase power 1996 2003
Not enough money even for food 56 40
Enough money for food and everyday needs 37 44 Enough money for everyday needs, clothes, footwear, etc. 5 15 Enough money to buy furniture, a TV set, a fridge, etc. 1 1 Enough money to buy a motorcycle, a mini-tractor, a car, etc. 1 0
Table 8.3 – Respondents' evaluations of economic changes in the past and future
How your own economic situation has changed in the
last 3 years?
How is your own economic situation going to change in the
next 3 years?
How is the private agricultural sector going to change in the
next 3 years?
Answer 1996 2003 1996 2003 1996 2003
Better 13 24 24 18 26 16
No change 11 25 33 20 18 16
Worse 71 43 24 39 23 41
Don't know 5 8 19 24 33 27
References
FAO. Crop and Food Supply Situation in Georgia, Special Report, December 1999.
Lerman, Zvi. Land Reform and Private Farms in Georgia: 1996 Status, EC4NR Agriculture Policy Note No. 6, October 1996.