ABSTRACT
The present paper derives and constructs a new visualization methodology called “Tiny-Notational Approach”, developed for better visualization of software architecture (SA). The “Tiny-Notations” are designed to specify the underlined concepts that a software entity, module and component belong to. The software architects can apply the Tiny-Notations to determine a particular software component or its activities related to another component because they provide additional information to address the understandability and mutual communication issues of the stakeholders related to SA. The proposed notations are easy to use and understand, and also several design aspects of components may be focused for domain specific analysis. The paper presents an implementation scenario of a web-based client-server system with its software architecture.
Keywords-- Software architecture, Visualization methodologies, Understandability, Tiny-Notations
1.
INTRODUCTION
Understanding the software architecture [6][9][10][11][12] is a vital step towards building and maintaining software systems. However, software architecture is an intangible conceptual entity. Therefore, it is hard to comprehend software architecture without a visual mapping [19]. For that reason, visualizing software architecture has been one of the most important topics in software visualization. Software visualization (SV) is the use of visual representations to enhance the understanding and comprehension of different aspects of a software system. Thus, stakeholders such as architects, developers, testers, project managers and even customers are interested in this visualization.
Visualizing software architecture encompasses not only the software modules, entities and their internal structures and interrelations, but also the evolution of these entities, modules and their interactions over time [5][13].
2.
BACKGROUND
STUDY
Software visualization is the process of mapping entities in a software system domain to graphical representations, normally in 2D or 3D [8][9][23], to aid comprehension and development. It has traditionally been focused on aiding the understanding of software systems by those who perform development and maintenance tasks on that software. Although Software visualization supports the software development and maintenance process, this focus excludes other valid stakeholders such as users and architects, maintainers, acquirers,
managers and so on. Software architecture visualization should help all stakeholders to understand the software at various levels of abstraction and at different points of the software life cycle. Software Visualization can be seen as the application of Information Visualization techniques to software, as the data collected from all areas of a system development, such as code, documentation, and user studies, is abstract and, hence, has no associated physical structure [15].
3.
EXISTING
APPROACHES
FOR
SOFTWARE
ARCHITECTURE
VISUALIZATION
There are a number of approaches with the support of tools and languages for SA visualization [1][2][3][15][17]. In addition, Software engineering research itself has examined the use of specific languages to describe software architecture [8]. These languages are referred to as Architecture Description Languages (ADLs). Rather than focusing on ADLs for capturing and representing architectural information, the Tiny-Notations presented in this paper are more concerned with the visualization of architectures in the large, whether they have been encoded with an ADL or not. Visualizations may indeed use the paradigm of components and connectors [15], but in this paper the Tiny-Notations serve at a lower level.
The next sub section provides description about some of the existing approaches in software architecture visualization.
3.1
DiffArch Viz
DiffArchViz is a tool developed by Sawant et al. [14] specifically for visualizing the software architecture of network-based large-scale systems. According to them the use of 3D glyphs to represent the architecture was to offer more surface area to place information on. The visualization uses hue, luminance, size, orientation, transparency and height as visual representations for the different attributes of software components (represented as glyphs). The drawback of this tool is that it categorizes raw code into software components in a static manner, hence mandating the user to stick to this categorization throughout the visualization process.
3.2 Axivion Bauhaus Suite
It is the architecture visualization tool developed by Software Acumen Limited [3]. The tool supports couple of programming languages (C, C++, MS Visual Studio .NET, Ada, Java etc) and platforms like (windows, Linux). In this tool, architecture visualization allows developers to browse their software at a high-level and also to drill-down to specific
Tiny- Notational Approach for Software Architecture
Visualization
Imran Ghani
Faculty of Computer Science and Information Systems Universiti Teknologi Malaysia
Bhaskar Prasad Rimal, Seung Ryul
Jeong
functions where necessary. Architect can easily find out which parts of the software are connected, how different parts of the software will be impacted by changes, evolution and whether parts of the software can be reused without modification.
3.3 Structure 101
Structure101 is a Java based tool developed by Headway software [16]. Structure101 makes software structure (design, architecture and packaging) easy to understand, define, communicate, control and keep simple. However, controlling architecture can be a significant challenge. An uncontrolled architecture can become a tangled mess, with no clear home for specific functions, unexpected side-effects to changes and increasing integration and test time.
3.4 Software Architecture Visualization and
Evaluation (SAVE)
SAVE tool [18][23] defines a planned (and/or target) architecture that creates an actual architecture from source code which compares planned architecture with actual identifying architectural violations. It can be used for checking architectural consistency, identifying commonalities and differences, exploring and understanding architectures from source code. It includes the features such as: zooming, filtering, refactoring. It consists of a set of Eclipse plug-ins and supports C/C++, Java, Delphi, and Simulink code. It provides the analysis of the impact of the change request on the new layered architecture. Its middle layer and two of its components, where all change occur, is expanded. By W. C. Stratton et.al[18], the assumption is that change “only” propagates if an interface changes. Interfaces are represented by header files that are. The change can propagate of other reasons, but to determine such change goes beyond the current capabilities of SAVE.
3.5 Ecospecies Visualization Tool:
Exploring Software Architecture in 3D
EvoSpaces [8] is a reverse engineering tool that provides an architectural level visualization of software systems as a virtual environment. It takes advantage of the fact that software systems are often structured hierarchically to suggest the use of a virtual city metaphor. Entities along with their relationships are represented as residential glyphs (e.g. house, apartment, office, hall and etc); whereas metrics of these entities are represented as positions and visual scales in the 3D layout (e.g. size, color value etc). The tool provides different interaction modes with zooming and navigation capabilities. Like any city, the EvoSpaces city is arranged in districts grouping a number of buildings. A district represents a package (or directory in C/C++). EvoSpaces is written in Java and JOGL [20], an OpenGL binding in Java for the 3D rendering. This allows us to get the fastest response time. The tool is built as a plug-in for Eclipse.
4.
PROPOSED
APPROACH
In the arena of software architecture, research on visualization is centered on finding a meaningful and effective mapping scheme between the software architecture elements and visual metaphors [4].
Recent research has been trying to answer different questions such as: “why is the visualization needed?”, “who will use it (end user, developer, managers etc)?”, and “how to represent it (single view) [7]?” static aspect[21], “who are the different
groups of audiences for architecture visualization?”, “what questions do they wish to answer through this visualization?”, “how can visual metaphors and interaction techniques are used to answer their questions [5]?”, and “how to display information related to source text?”
In this context, software architecture visualization attempts to answer the spacious variety of questions asked by different stakeholders through a number of techniques and approaches. However, what determines how effective a specific visualization technique is, has never been a trivial question. The researcher is not considering the cache and easy notations while visualization or describing the architecture language (ADLs), it is the big concern that architecture should be simple, understandable and mutually communicable by every concerning stakeholders. This can be achieved by making the implicit properties of entities and their relations explicitly visible in the architecture. Thus, we consider all these concerns while proposing some tiny notations here for architecture visualization.
The motivational scenarios that support the usefulness of proposed Tiny-Notations are as follows.
Improve understandability and mutual communication of software architecture visualization between stakeholders. - For example, software architect, system analyst, developers, database admin, senior management, project managers and team leads.
Incorporating Tiny-Notations with existing notations usability practices, in order to encourage an efficient practice in the ADLs community.
Improve the quality of Software Architecture Visualization.
4.1 Criteria for Tiny-Notational Approach
In order to apply the proposed notations there are some assumptions as described follows.
All Tiny-Notation can be used in any layer of the system in the architecture i.e., Application Layer, Presentation Layer, Business Layer, Resource Access Layer, Resources Layer and so on.
Tiny-Notations can be used as a combination of two or more Tiny-Notations (Fig 1)
The proposed location for the valid placement of Tiny-Notations is top-left (Fig 1)
Colors are not used to express any further detail
4.2 Core Notations
Table 1. Proposed core tiny notations
User-Interaction Representation: This pictogram describes a human user (human head), should be used depicting a component that interacts with or relates to human interaction. For example, a user database, user validation component or user interfaces.
LAN Network Communication: This symbol identifies a component/service under one administration related to LAN. For example, a TaxCalculation service under the same organization where the requester belongs to. Database Interaction: This notation depicts should be used
on the component that interacts with database such as database access interface.
Web-based Interaction: This symbol should be used when a component/service identifies under third party administration related to WAN. For example, a RSS feed service not under the same organization where the requester belongs to.
Two-ways Interface Connection: This sign describes the connection between the two components that has ports for both input and output.
One-ways Interface Connection: This sign describes the connection between the two components that has ports either for input or output.
4.3 Combination of Tiny Notations with
Components
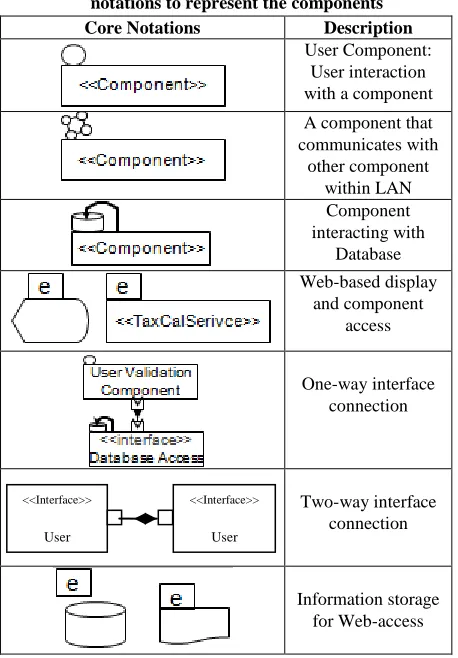
In order to provide the proposed notations description and recommended usage, Fig 1 shows some of the potential practices of usage for different types of stakeholders. The recommended location for the usage of the Tiny-Notations is on the top-left of the component or existing notation as shown in Table 2 below.
Table 2. Incorporating tiny-notations with traditional notations to represent the components Core Notations Description
User Component: User interaction with a component A component that communicates with
other component within LAN
Component interacting with
Database Web-based display
and component access
One-way interface connection
Two-way interface connection
Information storage for Web-access
The Table 2 shows only few of the existing usage embedded with the Tiny-Notations on top-right corner with flexibility. In Table 2, we showed the Tiny-Notations for components as well as for the existing notations for database, documents and display symbols. However, the usage of Tiny-Notations is not limited to these symbols. They can be used for any components or existing symbols; in order to provide more understandability to different stakeholders such as database admin, network security admin or interface designer and so on.
4.4 Implementation of Tiny-Notational
Approach – A Prototypical Scenario
We present our proposed notations with its implementation in a Software Architecture for a jobs search example company A. The company A owns a typical client-server web-based job search system. The client side enables easy access for jobseekers and employers support facilitates finding, applying for jobs and adding profiles and posting jobs respectively. Typically, the requests are sent from clients‟ browsers to web server and response is sent back to from web server to client, a two interaction process.
We used Tiny-Notations that serve as an easy to use mechanism to understand the architecture in a very clear manner; in order for better understandability and mutual communication among different stakeholders including interface designer, client request processor (developer) and database admin.
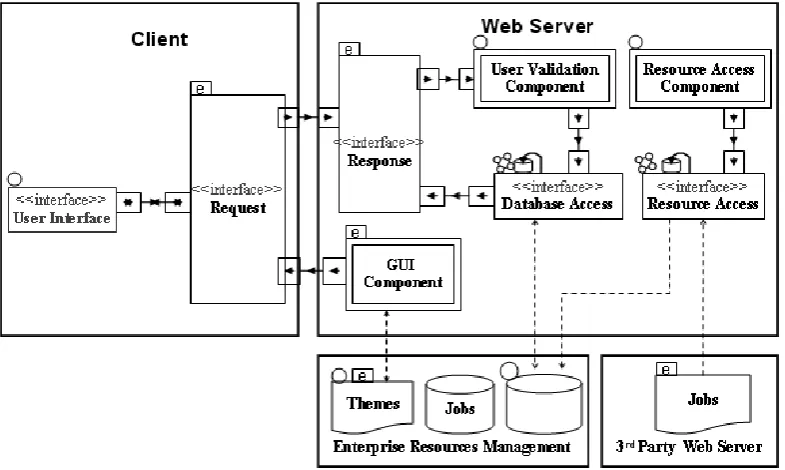
In Fig 1 below we describe how to implement our tiny notational approach in software architecture visualization. Here we are explaining a real world example; Tiny-Notations
<<Interface>>
User
Interface
<<Interface>>
User
[image:3.595.310.539.88.417.2]Prototypical Scenario for Web-based Job Search System Architecture. This scenario envisions how the server communicates with client. It provides a client is accessing the database for login validation via web server. The internal
[image:4.595.104.497.116.351.2]visualization in server part is showing with different component interacting with interfaces.
Fig 1: Tiny-Notations Prototypical Scenario for Web-based Job Search System Architecture
The Fig 1 exhibits the architecture of a job search system which consists of client, web server, database server, and a third party document base.
Almost, each of the component or existing notation is decorated with the Tiny-Notations which sufficiently help increase the understandability of each component that which component belongs to what type of stakeholder and system layers. For example, the GUI component in web server is
assigned . This means that the GUI component interacts with Internet designer (stakeholder) need to be attentive to understand this component and how this component interacts with other components on Internet. Similarly, the existing
notation for database is assigned with Tiny-Notation
. This means that the corresponding database is a user database. This helps understand database admin to take care of all the necessary issues such as password- encryption and so on.
5.
FUTURE
WORK
AND
CONCLUSION
The paper has presented a construct to Tiny-Notations which specifically allow for the inclusion of understandability and mutual communication for visualization properties in an architectural description. The construct is built around the concepts of „includes‟ but not „required‟ (meaning that it is optional to use them) and is modeled on the top of existing ADL and UML notations. The Tine-Notations could be applied to most of ADLs. As demands for better understandability with quality software steadily increase, software architects must meet these demands by including understandability as an important component in the architecture. The proposed Tiny-Notational approach can be used as a tool that allows architects to add understandability
into architectures from the onset of the process. This paper is limited to our recent and key research efforts. More work is needed in order to come up with more general and specific notations in software architecture visualization research. In future, however, we intend to translate the notational presentation to provide support at ADL as well as into code generation level. We argue that the integration of Tiny-Notations would support at architectural description process level leading towards a comprehensive SA visualization.
6.
ACKNOWLEDGMENTS
This research has been conducted with the support of academic visitors research grant, allocated by Universiti Teknologi Malaysia, under vote no. 4D046.
7.
REFERENCES
[1] Amit, W. and Naveen, B. 2006. SoftArchViz: A Software Architecture Visualization Tool. IEEE Article.
[2] Acme, www.cs.cmu.edu/~acme/ accessed on 18th November 2011.
[3] Axivion Bauhaus Suite, http://www.software-acumen.com accessed on 5th December 2011.
[4] Gračanin, D., Matković, K., and Eltoweissy, M. 2005. Software visualization. Innovations in Systems and Software Engineering. pp. 221-230, Springer London.
[5] McNair, A., Daniel, M. G., and Jens, W. J. 2007. Visualizing Software Architecture Evolution Using Change-Sets. In Proceedings of 14th Working Conference on Reverse Engineering. pp.130-139.
Software Eng. Workshop Software Visualization, pp. 5-10.
[7] Panas, T., Epperly, T. Quinlan, D. Saebjornsen, A. Vuduc, R. 2007. Communicating Software Architecture using a Unified Single-View Visualization. In Proceedings of 12th IEEE International Conference on Engineering Complex Computer Systems. pp. 217-228.
[8] Sazzadul, A. and Philippe, D. 2007. EvoSpaces: 3D Visualization of Software Architecture. In Proceedings of 19th International Conference on Software Engineering & Knowledge Engineering.
[9] Feijs, L and De Yong, R. 1998. 3D Visualization of Software Architectures. J. Comm. ACM, vol. 41, no. 12, pp. 73-78.
[10]IEEE Recommended Practice for Architectural Description of Software Intensive Systems. 2000. Technical report. IEEE.
[11]Shaw, M. and Garlan, D. 1996. Software Architecture: Perspectives on an Emerging Discipline. Prentice Hall.
[12]Bass, L., Clements, P., and Kazman, R. 2003. Software Architecture in Practice. Addison – Wesley Inc.
[13]D‟Amboise, M. and Lanza, M. 2007. BugCrawler: Visualizing Evolving Software Systems. In Proceedings of 11th European Conference on Software Maintenance and Reengineering. pp. 333-334.
[14]Sawant, A. and Bali, N. 2007. DiffArchViz: A Tool to Visualize Correspondence between Multiple Representations of Software Architecture. In Proceedings of 4th IEEE International Workshop on Visualizing Software for Understanding and Analysis. pp.121-128.
[15]Keith. G., Andrew. H., and Malcolm. M. 2008. Software Architecture Visualization: An Evaluation Framework and Its Application. J. IEEE Transactions on Software Engineering. pp. 260-270.
[16]Structure 101. Available online from: http://www.headwaysoftware.com/ accessed on 4th August 2011.
[17]Miodonski, P., Forster, T., Knodel, J., Lindvall, M., and Muthig, D. 2004. Evaluation of Software Architectures with Eclipse. Kaiserslautern, IESE-Report 107.04/E.
[18]William C. S., Deane E. S., Mikael, L., and Patricia. C. 2007. The SAVE Tool and Process Applied to Ground Software Development at JHU/APL: An Experience Report on Technology Infusion. . In Proceedings of 31st IEEE Software Engineering Workshop. pp. 187-193.
[19]Yaser, G. and Sheelagh, C. 2008. A Survey Paper on Software Architecture Visualization. Technical Report. Dept of Computer Science. University of Calgary.
[20]JOGL. Java binding for OpenGL. http://java.net/projects/jogl/ accessed on 8th April 2012.
[21]Caserta, P. and Zendra. O. 2010. Visualization of the static aspects of software: A survey. J. IEEE Transactions on Visualization and Computer Graphics, vol. 99, no. RapidPosts.
[22]Sharafi, Z. 2011. A Systematic Analysis of Software Architecture Visualization Techniques. In Proceedings of 19th IEEE International Conference on Program Comprehension. 2011.