Software Rejuvenation in Web Services
Chaitra S R
Department of CSE R&D East Point College Engineering & Technology
Bangalore, India
Anirban Basu
Department of CSE R&D East Point College Engineering & Technology
Bangalore, India
ABSTRACT
In this paper, we describe the formatting guidelines for IJCA Journal Submission. Software Aging is a phenomenon in which the state of a software system degrades with time and eventually results in software failures. The main causes of software aging are depletion of system resources, data corruption, numerical error accumulation etc. which may eventually lead to crashing/hanging. “Software Rejuvenation” is a technique intended to reduce such unplanned outages due to aging. The basic idea is to pause or halt the running of the software, refresh its internal state, and then resume or restart it. Web services also suffer from software aging related problems and needs rejuvenation.
In this paper, we discuss the use of a tool in measuring the software aging in .NET based web services and discuss how to apply rejuvenation techniques to counter software aging. The methodology is illustrated by application on .NET based web services.
Keywords
Software aging, Software Rejuvenation, Memory Leak, Garbage Collection, Fragmentation, CLR Profiler, Web services
1.
INTRODUCTION
Software often exhibits an increasing failure rate over time, typically because of increasing and unbounded consumption of resources, data corruption, and numerical error accumulation. Unplanned computer system outages may be more due to software failures than due to hardware breakdown. Software failures may be the result of a phenomenon called software aging, and caused by errors in the application, middleware, or operating system [1]. When software ages, state of the software degrades gradually with time, inevitably resulting in undesirable consequences. Some typical causes of this degradation are memory bloating and leaking, un terminated threads, unreleased file-locks, data corruption, storage space fragmentation, and accumulation of round-off errors [2]
Among the defects which cause Software Aging [3][4], the most prevalent are the problems caused by memory leaks and by memory fragmentation.
Memory leak [5] is a well-known software defect which is difficult to detect and fix in a software application. The common cause of memory leaks is the incorrect use of memory management routines by programmers. A memory leak occurs when memory is allocated in a program and is never released back to the operating system, even though the program does not use the memory any longer. Memory leaks, if undetected accumulate over time and can cause an application to run out of resources. This in turn causes a
software application to crash. Therefore it is important to identify and fix memory leaks as early as possible. If the problem is left uncorrected over substantial time, then it causes the application to run out of memory making it crash.
Software Rejuvenation deals with correction of this problem and involves gracefully terminating an application and immediately restarting it with a clean internal state. There are two methods for implementing rejuvenation [6] [7]:
Time based rejuvenation: In time based rejuvenation, rejuvenation is carried out at fixed and predetermined intervals of time.
Prediction based rejuvenation: Prediction based rejuvenation needs to monitor system resources and rejuvenation is carried out by predicting the likely point of time for the complete exhaustion of any resource.
With the wide spread use of web services, failures due to software aging in a web service can be catastrophic. In this paper we discuss the use of an open source tool CLRProfiler [8] to analyze memory allocation in a .NET based web services and detect memory leaks through analysis of heap graphs. The web service, the CLR profiler and other tools are integrated in a test bench called Software Rejuvenation Test Bench [9]. Software Rejuvenation Test Bench has a Rejuvenation Profiler which triggers rejuvenation as per the pre determined condition. In this paper, we discuss how prediction based rejuvenation method can be applied to counteract software aging in web service. The method and its advantages are discussed with application on real life .Net applications.
2.
RELATED WORK
maximize the number of services running simultaneously on the platform, while guaranteeing the resources needed by each service. Luis Silva [13] proposed a new Service Level Agreement (SLA)-oriented software rejuvenation technique that proved to be a simple way to increase the dependability of the SOAP-server, the degree of self healing and to maintain a sustained level of performance in the applications. Luis Moura Silva and Javier Alonso [14] proposed an approach for software rejuvenation based on automated self-healing techniques that can be easily applied to off-the-shelf Application Servers.
In this paper, we discuss similar issues in .Net Framework and provide a solution to counteract software aging.
3.
GARBAGE
COLLECTION
AND
HEAP
FRAGMENTATION
IN
.NET
FRAMEWORK [15]
.NET based web services make use of several types of memory: the stack, the unmanaged heap, and the managed heap [15].
3.1
The Stack
The local variables, method parameters, return values, and other temporary values are stored in a stack during the execution of an application. A stack is allocated on a per-thread basis and serves as a scratch area for the per-thread to perform its work. The garbage collector (GC) is not responsible for cleaning up the stack because the space on the stack reserved for a method call is automatically cleaned up when a method returns.
3.2
The Unmanaged Heap
The unmanaged heap is used for runtime data structures, method tables, Microsoft intermediate language (MSIL) and so forth. .Net supports two kinds of coding:
Unmanaged code allocates objects on the unmanaged heap or stack depending upon how the object is instantiated.
Managed code allocates unmanaged heap memory directly by calling unmanaged APIs or by instantiating Component Object Model (COM) objects.
3.3
The Managed Heap
The managed objects are allocated in managed heap and managed objects are the domain of the Garbage Collector. The Common Language Runtime (CLR) uses a generational, compacting GC. The GC is generational in that it ages objects as they survive garbage collections for performance enhancement. All versions of the .NET Framework have used three generations, Gen0, Gen1, and Gen2 (from youngest to oldest). Moving large objects is expensive and therefore the GC allocates them on a separate Large Object Heap, which does not compact.
When dealing with managed memory, the GC takes care of most of the work. The GC needs to be provided with the information it needs to do its job.
However, there are a number of scenarios that prevent the GC from doing its job efficiently and results in higher managed
memory use than would otherwise require. These situations include large object heap fragmentation.
3.4 Large Object Heap Fragmentation [15]:
If an object is 85,000 bytes or larger, it is allocated on the large object heap. Note that this is the size of the object itself and not any children. The following class is used as an example:
public class Foo {
private byte[] m_buffer = new byte[90000]; // large object heap
}
Foo instances would be allocated on the normal generational managed heap as it only contains a 4-byte (in 32-bit Framework) or 8-byte (in 64-bit Framework) reference to the buffer, plus some other housekeeping data used by the .NET Framework. The buffer would be allocated on the large object heap.
[image:2.595.317.544.499.625.2]Unlike the rest of the managed heap, the Large Object Heap (LOH) is not compacted due to the cost of moving the large objects. So as large objects are allocated, freed, and cleaned up, gaps appear. Depending on usage patterns, the gaps in the large object heap can result in significantly more memory usage than is required by the currently allocated large objects. The Large Object Heap Fragmentation application demonstrates randomly by allocating and freeing byte arrays in the Large Object Heap. Some runs of the application result in the newly created byte arrays fitting nicely into the gaps left by freed byte arrays. On other runs of the application, this is not the case and the memory required is much larger than the memory required for the currently allocated byte arrays. To visualize fragmentation of the large object heap, a memory profiler, such as the CLRProfiler can be used. The dark regions in Figure1are allocated byte arrays whereas white regions are unallocated space.
Figure 1: Large Object Heap in CLRProfiler [16]
There is no single solution for avoiding Large Object Heap fragmentation. It is by examining how the web services use memory by using tools like the CLRProfiler and performing rejuvenation thereafter.
4.
SOFTWARE REJUVENATION TEST
BENCH
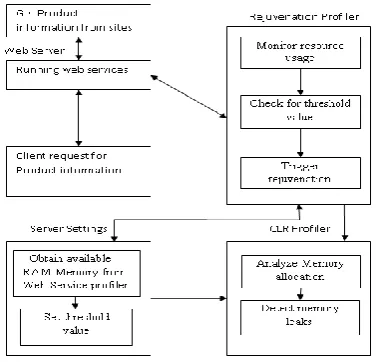
Web service Rejuvenation Profiler CLR Profiler
Rejuvenation Profiler continuously collects the data about the operating system resource usage by the web service. A threshold value is set a priori on the memory usage in the Rejuvenation Profiler, so that when the .Net application crosses this threshold rejuvenation is triggered.
[image:3.595.68.257.248.429.2]The CLR Profiler tool is used to analyze the behavior of managed applications. It focuses on what is going on in the Garbage Collector heap. By the detailed analysis of this heap one can detect the memory leaks in the web service.
Figure 2: Software Rejuvenation Test Bench
5. EXPERIMENTAL ANALYSIS
In this section, we present the results of experiments conducted to illustrate how a program with memory leak causes depletion of resources and how prediction based rejuvenation is triggered to overcome memory-related aging effects. For experimental analysis the web service http://www.sunsky-online.com is used in the Software Rejuvenation Test Bench.
Figure 3: Rejuvenation profiler
Figure 3 shows the Rejuvenation Profiler which profiles the web service for memory usage and detects memory leaks. The rejuvenation profiler provides the following information: (i) Process ID (ii) App Name (iii) Path (iv) Status (v) Size Limit (vi) Used Bytes (vii) Histogram (viii) Summary (ix)
Performance graph (x) Time taken to restart (xi) RAM usage graph. When the web service is executing it is possible for us to view the heap graph of the web service.
The situation which comes before and after Rejuvenation is now discussed. The memory related issues of the long running web service consumes a large amount of memory which is unwanted and keep the reference to memory active, thus failing to return the allocated memory back to Operating System. Once the web service crosses threshold it is automatically rejuvenated there by increasing the age of web service.
[image:3.595.316.537.491.653.2]Figures 4a and 4b show memory usage of the web service by plotting memory usage versus elapsed time. Due to memory leaks the web service causes depletion in the available resources. Figure 4a shows such depletion in the available resources because of memory leaks. The web service allocates memory every 5sec. Figure 4b shows memory usage of web service without memory leak. The web service consumes 46MB of memory initially and it remains constant without further consumption of memory. This indicates that the web service has no memory leaks.
[image:3.595.53.295.555.683.2]Figure 4a: Memory graph with memory leak
Figure 4b: Memory graph without memory leak
threshold value as set in the Rejuvenation Profiler. Figure 5 shows degradation in performance of the web service by plotting Elapsed Time versus usage of RAM. A threshold value of was set a priori to trigger rejuvenation and the shaded part (red circle) indicates that rejuvenation is triggered when the memory usage of web service reached threshold value. From the graph it is seen that RAM had been completely utilized before rejuvenation, and after rejuvenation the performance increased, by returning the memory to the system.
Figure 5: Performance Graph
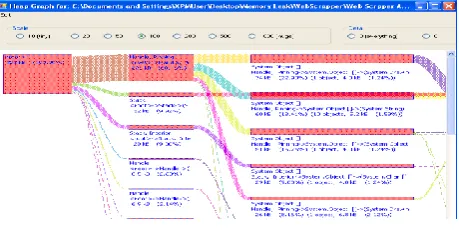
The View Graph can be seen when the web service is running and gives a clear picture of how memory is allocated to the web service. Heap graph in Figure 6 shows all the objects in the Garbage Collection heap, along with their relationships. The height of each box corresponds to the total memory held live by each group of objects. The text associated with box gives more detailed statistics, including how many objects are in group and how much space they occupy themselves, excluding the objects they point at.
Figure 6: Heap Graph
[image:4.595.54.276.187.344.2]By detailed analysis of heap graph [15], exact memory leak positions in the code can be detected. Finally when the web service finishes its execution the summary of the web service’s memory usage can be seen as shown in Figure 7. Summary also gives some interesting statistics about the program, which allows us to pursue further investigation by clicking on the appropriate buttons.
Figure 7: Summary for Web Service Memory Usage
Heap statistics: Gives statistics about the object allocation and retention behavior of the program. Garbage collection statistics: Gives statistics about
the garbage collection that happened during the program run.
Garbage collector Generation sizes: Gives the sizes of the various garbage collector generations. GC handle statistics: Lists how many GC handles
have been created, destroyed and how many are surviving at the end of the program run.
Profiling statistics: Summarizes events having to do with the profiling run itself.
6. CONCLUSION
Memory leak related issues have been disturbing software developers for many years. During long run of a web service these defects cause exhaustion of resources, performance degradation and eventual crashing as reference to objects are active even when they are no longer needed. To avoid web service from sudden hang/crash, the memory usage by the web service needs to be monitored and rejuvenation triggered at the appropriate time. In this paper, use of CLR profiler has been suggested for prediction based rejuvenation of .Net based web service. The managed heap and memory allocation done by the web service is analyzed using the tool thereby easing the job of detecting memory leaks. The work presented in this paper combines detection of memory leaks and software rejuvenation to increase the performance and life of the web service. It also reduces the cost of downtime and avoids inconvenience due to sudden hang or crash of the web service.
REFERENCES
[1] L. Li, K. Vaidyanathan and K. S. Trivedi, “An Approach to Estimation of Software Aging in a Web Server”, Proc. Intl. Symp. on Empirical Software Engineering, ISESE 2002, October 2002.
[2] Qinqin Ni, Weizhen Sun and Sen Ma “Memory Leak Detection in Sun Solaris OS”, International Symposium on Computer Science and Computational Technology, 2008.
[3] Grottke M, Matias R and Trivedi K.S, “The fundamentals of software aging”, IEEE International Conference on Software Reliability Engineering Workshops, 2008. ISSRE Wksp 2008.
[4] Macedo A, Ferreira T.B and Matias R,“The mechanics of
memory-related software aging”,
[image:4.595.57.287.497.613.2][5] Timothy Tsai, Kalyan Vaidyanathan and KennyGross, “Low-Overhead Run-Time Memory Leak Detection and Recovery”, Dependable Computing, 2006. PRDC 06. 12th Pacific Rim International Symposium on 2006.
[6] K.S.Trivedi, K.Vaidyanathan, K.Goseva-Postojanova, “Modeling and Analysis of Software Aging and Rejuvenation”, Proc. 33rd
Annual Simulation Symp., IEEE Computer Society Press, Los Alamotos, CA, 2000.
[7] K.Vaidyanathan, K.S.Trivedi, “A Measurement-Based Model for Estimation of Resource Exhaustion in Operational Software Systems”, Proc. 10th Int’l Symp. on Software Reliability Eng., IEEE Computer Society Press, Los Alamitos, CA, 1999.
[8] http://msdn.microsoft.com/en-us/library/ff650691.aspx
[9] Chaitra S R, Measurement and Analysis of Software Rejuvenation on web services, Report of EPCET. July 2012.
[10] Jun Guo, Xin Ya Song, Yun Sheng Wang, Bin Zhang and Xian Li Li,”The Measurement of Software Aging Damage and Rejuvenation Strategy for Discrete Web Services” Advanced Materials Research, 433-440, 432, January 2012.
[11] Yun-Fei Jia, Jing-Ya Su, and Kai- Yuan Cai, ”A Feedback Control Approach for Software Rejuvenation
in a Web Server”, IEEE International Conference on Software Reliability Engineering Workshops, 2008. ISSRE Wksp 2008.
[12] Alonso J, I Goiri, J Guitart, R Gavalda, J Torres, “Optimal Resource Allocation in a Virtualized Software Aging Platform with Software Rejuvenation”, 22nd IEEE International Symposium on Software Reliability, 2011.
[13] Luis Silva, Henrique Madeira, Joao Gabriel Silva, “Software Aging and Rejuvenation in a SOAP-based Server”, Network Computing and Applications, Fifth IEEE International Symposium,July 2006.
[14] Luis Moura Silva, Javier Alonso, and Jordi Torres, “Using Virtualization to Improve Software Rejuvenation”, Network Computing and Applications, Sixth IEEE International Symposium, July 2007.
[15] Debug Leaky Apps: Identify and Prevent Memory Leaks in Managed Code http://msdn.microsoft.com/en-us/magazine/ec163491.aspx
![Figure 1: Large Object Heap in CLRProfiler [16]](https://thumb-us.123doks.com/thumbv2/123dok_us/8102187.788240/2.595.317.544.499.625/figure-large-object-heap-in-clrprofiler.webp)