Optimizing QoSin Distributed Systems / Cloud
Computing Architectures
John P. Sahlin
George Washington UniversityDepartment of Engineering Management and Systems
Engineering Washington, D.C. 20052
ShahramSarkani, Ph.D
George Washington UniversityDepartment of Engineering Management and Systems
Engineering Washington, D.C. 20052
Thomas Mazzuchi, D.Sc.
George Washington University Department of Engineering Management and SystemsEngineering Washington, D.C. 20052
ABSTRACT
The primary challenge of cloud service providers is finding ways to maintain a high degree of Quality of Service (QoS) in a cost-effective manner to ensure either profitability (for business-based cloud service providers) or cost avoidance (for government cloud service providers). The traditional approach to improving system performance is to upgrade the servers and/or network backbone, an expensive undertaking. The authors used OPNET Modeler to represent distributed system architecture supporting a variety of application services and defined a framework for measuring QoS from the end-user’s perspective and discovered that there is no direct relationship between server/network upgrades and overall QoS in distributed systems. This framework can be used as a decision support tool for cloud service providers to optimize the QoS of their systems by choosing upgrade strategies that provide the greatest “bang for the buck.”
General Terms
Cloud Computing
Keywords
computernetworks, quality of service, modeling and simulation, computer performance, distributed systems.
1.
INTRODUCTION
Cloud computing is more than simply technology to effect distributed access to enterprise computing resources – it is a business model and a framework for providing those resources in the cost-effective manner possible. A number of cost studies have been conducted regarding the value of cloud computing and whether an organization should pursue a public, private, or hybrid base cloud architecture. Many of these studies focus solely on the operating costs associated with the cloud infrastructure and comparing them to the monthly service fees charged by service provider such as Amazon, Google, Salesforce.com, and Microsoft. The drawback of these studies is that they generally do not consider the cost-benefit trade-offs associated with outsourcing in terms of losing control of the infrastructure environment and the ability to optimize performance and quality of service (QoS).
This paper will discuss various methods of optimizing QoS and provide decision support guidance for cloud computing architectures. The framework discussed below can be used as a decision support tool to identify the right mix of hardware reinvestment and system abstraction for a distributed cloud
this paper will identify the strengths and weaknesses of traditional definitions of QoS and provide an alternate metric based on modeling and simulation as a better predictor of user experience. After investigating a new model for QoS, the authors will discuss a variety of system abstraction models meant to increase performance of distributed distributing computing infrastructures. This paper will then analyze the implications of performance improvement efforts on total ownership cost and provide a decision support framework for identifying the "sweet spot" target for system performance improvement.
2.
QOS AND SYSTEM GOODPUT (G
S)
The primary problem with establishing a quality of service model for cloud computing is establishing what one means by quality of service. Many cloud computing service providers consider quality of service in terms of guaranteed bandwidth, dedicated hardware, system availability, and/or fault tolerance. Public cloud computing providers such as Amazon, Salesforce.com, and Microsoft include quality of service and other metrics in their contractual Service Level Agreements (SLAs) primarily because of the ease of collecting this information. While metrics such as these are easy to record and report, they are not always the best predictors of user experience and overall system performance.
2.1
Quality of Service (QoS)
As mentioned previously, QoS is generally considered in terms of guaranteed resource allocation (e.g., bandwidth, CPU utilization, memory, storage, etc.). While his metrics make for convenient reporting mechanisms and are accepted by many IT professionals as the standard for performance, they do not tell a complete story when discussing system performance and the end-user experience. Because a cloud computing infrastructure often involves elements that are beyond the control of the service provider (i.e. the Internet) measuring QoS and predicting overall user experience can be a significant challenge. Even when using a private cloud model where the majority of infrastructure (including the internetworking) is controlled by the service provider, predicting overall system performance is difficult. Available benchmarks and QoS metrics generally tell only a portion of the story and do not provide an enterprise viewpoint.
maximum signal loss and jitter [2]. This network-centric definition of QoS fails to consider system-level issues such as the performance of the application, capabilities of the hosting infrastructure (i.e. servers and storage), and system backlog due to over utilization.
In order to identify a method for predicting system performance based on how an application will perform, many IT professionals rely on component specifications such as CPU speed, available RAM, and storage metrics such as inputs/outputs per second (IOPS). These specifications alone often provide a false sense of security to IT professionals who assume that fielding a server with a faster CPU or increasing RAM is the best solution for system performance issues. Server benchmarks such as those provided by the System Performance Evaluation Cooperative (SPEC.org) take a more holistic approach of predicting application performance on servers by measuring the performance of standard applications such as e-mail and web services on fully configured servers and publishing performance metrics at the application level [3]. SPEC.org benchmarks offer a promise of application level performance measures but like the network-centric definition of QoS, server benchmarks only focus on a small part of the overall picture.
2.2
System Goodput (G
S) As a
Performance Metric
In order to establish a truly system-level proof performance benchmark, the authors offer a new metric, system goodput (GS). This GS metric represents an aggregate end-to-end
measure of the performance of a system's ability to support e-mail (PE), database (PD), Web services (PW), and network file
transfer (PF) traffic as follows:
𝐺𝑆= (𝑃𝐸+ 𝑃𝐷+ 𝑃𝑊+ 𝑃𝐹)
4
where
DN= Ethernet delay + TCP delay
PE= DN + e-mail client response + e-mail server response
PD= DN + database client response + database server response
PW= DN + web client response + application server response
PF= DN + FTP client response + FTP server response.
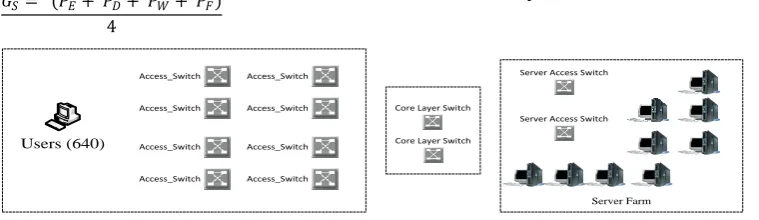
The authors used the OPNET Modeler network simulation tool to investigate whether changes in server performance or available network bandwidth had a significant impact on the overall system-level quality of service from a user perspective as represented by GS. Using a system model that represents a private cloud infrastructure for a medium-sized organization, the authors simulated network traffic based on a variety of user profiles. The authors chose to model a private cloud architecture for the simulation because the private cloud model offers the greatest degree of control over the network enterprise and hence the greatest predictability of service level.
Figure 1 below provides a high level depiction of OPNET system model used during this simulation. The authors ran the same simulation using the following four scenarios:
Baseline: HP DL580 (6 CPU cores, SPEC.org rating: 58); 1 Gbps network backbone
10 Gbps: HP DL580 (6 CPU cores, SPEC.org rating: 58); 10 Gbps network backbone
Low-End: HP Bl460c (4 CPU cores, SPEC.org rating: 34.5); 1 Gbps network backbone
High-End: HP DL585 (8 CPU cores, SPEC.org rating: 98.3); 1 Gbps network backbone
Access_Switch Server Access Switch
Server Access Switch Access_Switch
Access_Switch
Access_Switch
Access_Switch
Access_Switch
Access_Switch
Access_Switch
Users (640)
Core Layer Switch
Core Layer Switch
Server Farm
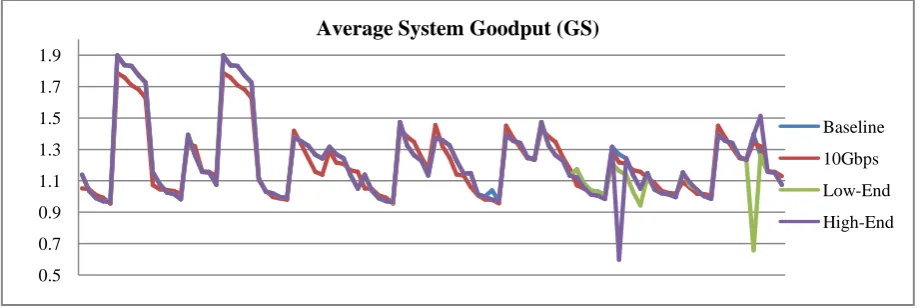
Based on the server and network specifications over the four scenarios, one may assume that there would be significant differences in performance between the low-end and high-end scenarios as the high-end servers have a SPEC.org rating of nearly 3 times that of the low-end servers.
The results of the simulation contradicted what most IT experts assume is true, the notion that faster servers and more network bandwidth will provide improved system performance.After collecting individual performance data across a total of 100 simulation runs, the data showed virtually no difference in GS when varying either the server performance or network capacity, as shown in Table 1 and Figure 2 below.
Table 1:System Goodput (GS) Scenario Comparison
Metric Baseline 10 Gbps
Low-End
High-End
n 100 100 100 100
Avg GS (seconds) 1.2289 1.2146 1.2149 1.2223
σ 0.2377 0.2159 0.2462 0.2492
σ2 0.0565 0.0466 0.0606 0.0621
[image:2.595.111.491.422.532.2]Based on an analysis of the simulation data, it is clear that something other than network throughput and server performance is driving the overall end-user experience for this private cloud architecture.
Fig.2: Average System Goodput (GS)
2.3
System Queuing and QoS
The results of the simulation is best explained by the concept of system queuing. System queuing models simulate a dynamic system's ability to respond to discrete service requests. As the system processes individual requests, the system develops a backlog of requests waiting for the system to begin processing. As the service backlog grows, the overall performance of the system degrades (often rapidly). A classic example of this system degradation due to service backlog is a tank of water used to collect rain. If the tank has only one outlet spigot, but the rain is coming in faster than the spigot can process water, then the system queue becomes backlogged and the tank will eventually overflow [4,5]. The easiest way to clear the system backlog is to increase the number of system queues available for processing requests i.e. adding multiple spigots to the tank and adjusting the outflow by opening and closing spigots to meet the incoming rain. The tank with multiple spigots can be adjusted to match the incoming rainfall; proper queue management will ensure that the tank will neither overflow nor run empty.
The simulation results showing that upgrading either the servers or the network do not improve system performance indicate that the system model has become performance bound by a queue backlog of resources other than server processing and network utilization, most likely at the application layer. If upgrading he servers or network is not likely to improve performance, then the next question to ask is: how can a cloud service provider improve performance at the application layer?
3.
PERFORMANCE IMPROVEMENT
THROUGH ABSTRACTION
A number of options exist to improve the performance of the system that suffers from application layer queue backlogs. Some solutions focus on enhancing and application’s ability to access data by improving the IOPS performance of a server using high-speed access to storage area network (SAN) storage or even providing bus-speed access to high-speed solid-state hard drives to improve application performance using rapid access data storage (e.g., Fusion-IO storage) [6]. Cloud Computing service providers have adopted a number of abstraction approaches to improving the application layer performance of their infrastructures, including using massive parallelization architectures such as Map/Reduce to distribute processing across multiple system nodes, virtualizing server
Microclimate model that allows for in situ processing and localized decision support.
3.1
System Abstraction: Map/Reduce and
Distributed Processing
The threaded nature of complex algorithms and application processes often contributes to system degradation due to queue backlogs. The developers of Google developed map reduce to combat system performance issues associated with processing massive amounts of data. The map reduce function allows for a complex algorithm to be subdivided into individual chunks; complex processing of petabytes of data that previously required extremely powerful computers can now be processed in parallel among a large number of commodity servers [7]. Even more important for cloud service providers, the Map/Reduce function allows for processing across a heterogeneous environment; the cloud infrastructure can be upgraded or added to in a piecemeal fashion rather than requiring a forklift server upgrade to provide enhanced capabilities [8].
Map/Reduce allows a cloud service provider to take advantage of massive parallelization using traditionally threaded algorithms and processes. By distributing the workload, map reduce allows for new processing queues to be established dynamically during times of degraded system performance. In addition, map reduce enhances the agility of the cloud infrastructure to optimize server utilization by parsing complex operations across underutilized servers. By abstracting the system architecture from the application architecture, Map/Reduce enables agile responsiveness to cloud system requests. A recent analysis of an actual cloud computing system performance performed by Microsoft Research showed that 80% of network traffic was internal; reducing the system bottlenecks is critical to overall cloud computing system performance [9]. When coupled with a dynamic provisioning scheme for increasing server resources dedicated to complex processing algorithms, map reduce is a highly effective tool in optimizing system performance of data intensive scalable computing architectures such as cloud computing infrastructures that handle vast quantities of data [10].
While Map/Reduce is extremely useful in improving system performance and reducing backlogs by distributing the load across the entire server enterprise, it has its drawbacks. The underlying architecture of Map/Reduce (and its open-source cousin Hadoop) is complex making performance tuning 0.5
0.7 0.9 1.1 1.3 1.5 1.7 1.9
Average System Goodput (GS)
Baseline
10Gbps
Low-End
service providers look for alternate methods of abstracting the infrastructure to improve performance.
3.2
Hardware Abstraction: Virtualization
and Automated Provisioning
Virtualization technology is not new to IT systems; however it is considered critical technology in cloud computing architectures because of its ability to separate the application from the physical infrastructure. Virtualization technology allows for server instances to be added to an enterprise quickly using templates and preconfigured builds. When coupled with automated provisioning algorithms and advanced system management technology, server virtualization can be the key to clearing system to backlogs.
Recent developments in server virtualization by providers such as VMware and Xensource include the ability to provide live migration of servers (including system state information) onto bare metal servers, enabling recovery from system outages with virtually no service interruption [11, 12]. This capability also enables a cloud infrastructure provider to add server instances dynamically to accommodate peak loads and remove those instances from the environment when no longer needed. By dynamically rearranging server resource allocation to a variety of services based on demand, virtualization reduces datacenter “hotspots” (i.e. some servers operating at 100% utilization while others lie fallow) [13]. The ability of virtualization to even the load and scale services across a heterogeneous enterprise enables cloud service providers to offer flexibility and high-availability of services while reducing system bottlenecks [14].
Server virtualization alone is not sufficient to enable a successful cloud computing enterprise. Simply adding virtual
instances of the server to existing hardware will not necessarily result in improved system performance. Some applications are highly computational and require more CPU resources while others are more I/O intensive, depending high-speed access to data; the result of this disparity is a nonlinear scaling of virtual servers on existing hardware [15]. Because applications do not scale linearly and advanced management capability is needed to determine when to add new virtual servers and how to reallocate enterprise resources to existing server instances to achieve optimal infrastructure performance. A manual process for reallocating enterprise resources is too inefficient to be a successful system optimization technique given the high degree of variability and “bursty" nature of cloud-based traffic; an automated process is required [9].
3.3
Network Abstraction: VL2
Traditional n-tier network architectures such as a layer 2-3 tree topology present significant challenges to cloud infrastructure optimization. The traditional tree structure used in many large-scale network infrastructures results in either a brittle network that is subject to significant system degradation if not complete outage from the failure of a top-tier component or an extremely expensive network design that is over provisioned to meet potential throughput requirements. As can be seen in Figure 4 below, a failure of an aggregator switch (AS) or core router (CR's) can have dramatic impacts on the overall system performance because the entire system throughput is routed through single device. A typical core layer router or aggregator switch can be oversubscribed as much as1:240 in an enterprise cloud infrastructure [9].
AR AR ... AR AR
Servers RS
Servers RS ...
S S
AS AS
Servers RS
Servers RS ...
S S
CR CR
Internet
Data Center Layer 3
Data Center Layer 2
CR: Core Router / Internet Access
AS: Access Router
AS: Aggregator Switch
S: Layer 2 Switch
[image:4.595.136.466.417.557.2] RS: Rack Level Server
Fig.3: Typical Layer 2/3 Tree Network Architecture (adopted from [9])
The core assumptions of a typical layer 2-3 tree design limit the agility of the cloud infrastructure to take advantage of dynamic reallocation of abstracted system services such as virtualization, dynamic provisioning, and Map/Reduce. The dependence on technology such as VLAN structures provide dedicated virtual circuits for traditionally high utilization network traffic however its reliance on layer 3 routing forces VLAN to VLAN traffic through the already over tasked routing infrastructures. Using Virtual Layer 2 (VL2) and a Clos network design, researchers have developed a network architecture that provides massive scalability, fault tolerance, and significantly enhanced performance using relatively inexpensive switching components [9]. VL2 provides sufficient network abstraction to allow any network node local address (LA) to be assigned a virtualized application address (AA) which is used as the destination for routing of traffic flows. By focusing on the AA and providing a flat network structure the overall switching overhead is dramatically reduced increasing performance dramatically [9]. In added
benefit to this system design is its focus on using inexpensive network components to deliver high-performance fault tolerant systems and enables the cloud service provider to scale out its architecture to accommodate growth and to reallocate server resources dynamically in quick response to changes in system load. This network architecture, combined with the above application abstraction techniques, gives the cloud service provider the ability to establish an automated service queue provisioning structure to reduce system backlog.
3.4
Global Abstraction: In Situ Processing
and Microclimates
know where to start. If cloud computing is going to provide a resolution to this problem, system designers must change the way they think about the cloud. The goal of cloud computing must shift from being the conduit to a ubiquitous enterprise data store to providing a localized view of data that is relevant to the user’s perspective and adaptive to his or her specific needs.
The idea that a cloud can and must only be a ubiquitous enterprise resource is overly restrictive and will eventually doom the cloud to oblivion. In order to survive in the future business market, the cloud must adapt and become more local, more personal, and leverage mobile platforms such as smart phones and other mobile devices.
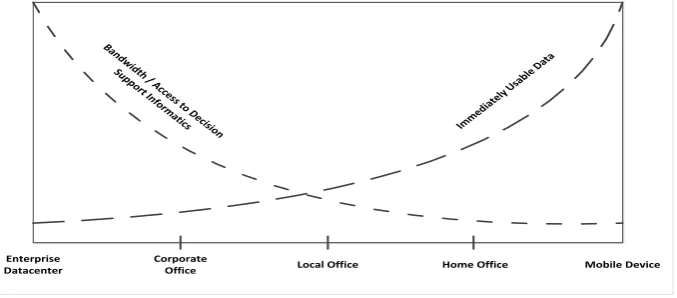
Enterprise Datacenter
Corporate
Office Local Office Home Office Mobile Device
Bandw idth
/ Acce ss to D
ecision Sup
port In form
atics Immedia
tely Us able
[image:5.595.133.472.151.300.2]Data
Fig.4: The Challenge of Mobile Cloud Computing
The main problem of providing Cloud Computing to the mobile platform is that the computing power of mobile devices has greatly outpaced access to wireless bandwidth. Even in a world of 4G wireless, access to high-speed networks may be restricted due to congestion, poor signal strength, or wireless contracts where the service provider limits the available bandwidth in an effort to provide acceptable quality to all its customers [17]. While the relevant data and need for information is local, the majority of computing power and decision support information is available globally at the enterprise data center level. Access to enterprise information is restricted by bandwidth. The bandwidth / data need paradox of Mobile Cloud Computing is depicted as Figure 3 above.
This challenge of mobile cloud computing gives rise to a new model for cloud architectures: the Microclimate. In this model, processing of data is completed in situ by personal mobile device or other ultra-light network nodes such as PDAs, RFID equipment, automobile GPS units, etc. Whenever possible, sending metadata to the enterprise service for analysis and sending complete data only when specifically requested. The personal mobile device acts as an autonomous mini system (Microclimate) that is capable of affecting the local environment when necessary but also capable of interacting with the overall environment (Enterprise Cloud) when available and required.
The Microclimate model allows for local processing and exploitation of data for immediate decision support. If the user is not satisfied with the decision recommended using localized information, the user could choose to synch with the enterprise data and processing store to access greater decision support informatics capability. Significant advances in current technology are making microclimates possible, including virtual networking, mobile ad hoc network (MANET) routing, and system abstraction models such as server virtualization and Map/Reduce.
4.
OPTIMIZATION: BETTER IS THE
performance rather than focus on architectures that provide a minimum of performance enhancement at a significant cost (in terms of time and resources). The technologies described above offer potential and performance improvements; the challenge of the cloud service provider is to determine the threshold of performance that is sufficient to meet current and projected utilization and provide an adequate level of service in the most cost-effective manner. While minor adjustments in a system design can yield some performance gains is important for cloud service provider to identify the threshold of “good enough” beyond which additional performance tweaks will result in diminishing returns on investment (i.e. when an additional x% investment on system improvements yields <x% performance gain).
4.1
Cloud Computing as a Business Model
Regardless of whether a cloud service infrastructure is designed to be a public, private, or hybrid cloud, the primary goal of cloud computing is to reduce operating costs and increase profitability of the service provider (or in the case of government cloud computing efforts, to reduce overall total ownership cost) [18, 19, 20]. Cloud computing in its simplest form is a technology solution for providing distributed computing resources to make a business operate more efficiently. Cloud computing infrastructures effect consolidation of datacenters and other enterprise resources that allow the cloud service provider to focus its resources, reduce capital investment, and maintain a predictable cost structure.
Industry studies do not agree on which cloud computing infrastructure provides the most cost-effective solution. This is mainly because each organization must identify its requirements and cost drivers and develop a cloud service that makes the most sense in the context of its specific business model. Cloud computing is definitely not a one-size-fits-all business model.
4.2
Impacts of System Design on Total
cloud computing generally focus on the monthly service fees of outsourcing to a cloud service provider compared to establishing a private cloud infrastructure [21, 22]. By focusing on the monthly service fees these studies provide insight into the recurring operating costs associated with an infrastructure; however they generally ignore the initial capital investment required to establish this infrastructure and, more importantly, the recurring capital investments required to upgrade the cloud infrastructure to maintain current with technology trends.
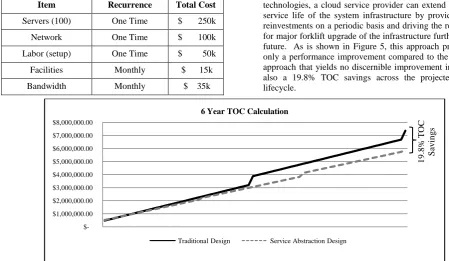
[image:6.595.316.539.71.193.2]One study by Microsoft Research indicated that the single most expensive component of the cloud computing infrastructure investment was procurement of servers [9]. Given the industry service life of computing devices, this massive capital investment in the cloud infrastructure will be considered obsolete within three years after the initial investment. In order to recover the significant investment costs, a cloud service infrastructure must provide a return on investment in time to overcome not only the recurring operating expenses but also the initial capital investment and recurring capital reinvestments necessary to maintain an adequate infrastructure. Table 2 below calculates the total ownership cost of a sample private cloud infrastructure assuming a traditional six-year lifecycle whereby major system components are upgraded every three years with the notion of keeping current with technology and improving system performance.
Table 2: TOC of Sample Infrastructure (72 Months)
Item Recurrence Total Cost
Servers (100) One Time $ 250k
Network One Time $ 100k
Labor (setup) One Time $ 50k
Facilities Monthly $ 15k
Bandwidth Monthly $ 35k
Labor (maintenance) Monthly $ 30k
Server Upgrade (100) Three Years $ 500k
Network Upgrade Three Years $ 200k
Labor (setup) Three Years $ 100k
Labor (data
migration) Three Years $ 300k
Labor (Cutover) Three Years $ 100k
6-Year TOC $ 7,360k
The problem cloud service providers face when taking this traditional upgrade approach is that (as shown in the simulation results earlier) simple hardware upgrades of the distributed system infrastructure do not necessarily improve performance.
The system abstraction techniques described previously can enable a cloud service provider to dramatically reduce total ownership cost of a cloud infrastructure. Leveraging lower-priced commodity components can reduce the capital investment required to develop the cloud infrastructure. Using distributed processing algorithms such as Map/Reduce, a cloud infrastructure provider can further reduce total ownership cost by maintaining a heterogeneous environment which allows the addition of newer equipment to the infrastructure without requiring a forklift overhaul of the entire server infrastructure.
By using commodity hardware and virtualization technologies, a cloud service provider can extend the overall service life of the system infrastructure by providing minor reinvestments on a periodic basis and driving the requirement for major forklift upgrade of the infrastructure further into the future. As is shown in Figure 5, this approach provides not only a performance improvement compared to the traditional approach that yields no discernible improvement in QoS, but also a 19.8% TOC savings across the projected six-year lifecycle.
Fig.5: Six-Year TOC Comparison
4.3
TOC Optimization
Each cloud service provider must follow a similar approach to calculating the total ownership cost of the cloud infrastructure and then perform a sensitivity analysis to determine where the optimal mix of technology, performance improvement, and cost-benefit lies. By focusing solely on capital infrastructure investment a cloud service provider, organizations often ignore the total ownership cost impacts of outsourcing to a public cloud infrastructure. This mistake can have dramatic
performance results as the service provider cedes not only responsibility for maintaining service-level agreements but also the control to make decisions on how to optimize performance.
By conducting a cost-benefit analysis using not only the capital investment and monthly recurring costs but also the periodic capital reinvestment costs associated with a private cloud infrastructure, a cloud service provider can make sound business decisions regarding which technology improvements
$-$1,000,000.00 $2,000,000.00 $3,000,000.00 $4,000,000.00 $5,000,000.00 $6,000,000.00 $7,000,000.00 $8,000,000.00
6 Year TOC Calculation
Traditional Design Service Abstraction Design
1
9
.8
%
T
OC
S
av
in
g
[image:6.595.52.502.383.644.2]to pursue or whether any performance improvement efforts will result in a cost effective performance gain. Just as selecting a cloud computing architecture is specific to the context of a given service provider’ business model business model, the degree of performance enhancements that are appropriate and cost-effective will differ among service providers.
5.
CONCLUSION
Cloud service providers face the challenge of balancing the need to provide a high level of service availability and QoS to meet its customers’ needs with the business need to operate profitably. The authors have shown through modeling and simulation that the generally accepted notion that QoS of a distributed system such as a cloud computing infrastructure can be improved by simply upgrading the servers or transitioning to a faster network backbone is not necessarily true. Other methods must be pursued at the application layer to improve the performance of distributed systems.
A number of technologies are available that promise to improve performance of distributed system architectures; however the real challenge for a cloud service provider is defining which technology improvements will deliver a significant performance gain in a cost-effective manner. Prior to selecting which technology improvement to pursue, a cloud service provider should first investigate how its infrastructure relates to its business model. Identifying the drivers of total ownership costs is the key to finding the right mix of technology and processes that will optimize a cloud service provider’s quality of service.
6.
ACKNOWLEDGMENTS
The authors would like to thank OPNET Technologies for providing an academic research license of OPNET Modeler, which was used to conduct the simulation research represented in this paper.
7.
REFERENCES
[1] Wang, P., Chen, H., Yang, X., & Lu, X. (2011) “Active queue management of delay network based on constrained model predictive control.” Proceedings of the 2011 Chinese Control and Decision Conference, pp814 – 818 doi: 10.1109/CCDC.2011.5968294
[2] IEEE Standard 802.16 Working Group, IEEE Standard for Local and Metropolitan Area Networks Part 16: Air Interface for Fixed Broadband Wireless Access Systems (Revision of IEEE Standard 802.16-2001), 2004. [3] Standard Performance Evaluation Corporation. (2011).
“The SPEC Organization.” http://www.spec.org/spec/
[4] J. D. Sterman. Business Dynamics: Systems Thinking and Modeling for a Complex World. Boston: Irwin McGraw-Hill, 2000.
[5] S. Ross. Simulation (4th ed.). Boston: Academic Press, 2006.
[6] Fusion-IO. (2012). “Fusion-IO.”
http://www.fusionio.com/
[7] Kambalta, K., Pathak, A., &Pucha, H. (2009, June). “Towards optimizing Hadoop provisioning in the cloud.” HotCloud'09: Proceedings of the 2009 Conference on
Hot Topics in Cloud Computing.
http://www.usenix.org/event/hotcloud09/tech/full_papers
[8] Zaharia, M., Konwinski, A., Joseph, A. D., Katz, R., and Stoica, I. (2011). “Improving MapReduce performance in heterogeneous environments.” Proceedings of the 8th USENIX Conference on Operating Systems Design and Implementation Conference, pp 29 – 42.
[9] Greenberg, A., et al. (2011, March). “VL2: A scalable and flexible data center network.” Communications of the ACM 54(3), pp. 95 – 104. doi: 10.1145/1897852.1897877
[10]Sandholm, Thomas & Lai, Kevin (2009, June). “MapReduce optimization using regulated dynamic prioritization.” Performance Evaluation Review 37(1), pp. 299-310. ISSN: 0163-5999
[11]VMWare (2012). “VMWare ESX Server” http://www.vmware.com/products/esx
[12]Citrix (2012). “Citrix XenServer 6.” http://www.citrix.com/English/ps2/products/
product.asp?contentID=683148
[13]Zhang, Q.i, Cheng, L., &Boutaba, R. (2010, April 20). “Cloud computing: state-of-the-art and research challenges.” Journal of Internet Server Applications 1, [online edition] pp. 7 – 18. doi: 10.1007/s13174-010-0007-6
[14]Han, Y. (2010, June). “On the clouds: A new way of computing.” Information Technology and Libraries 29(2), pp. 87 - 92. ISSN 07309295
[15]Hipes, A. (2011, August). “Virtualization and elastic provisioning in carrier-grade solutions.” http://advancedtca-systems.com/virtualization-elastic-provisioning-carrier-grade-solutions/
[16]Gantz, J. and Reinsel, D. (2011, June). “Extracting value from chaos.” IDC IVEW. http://idcdocserv.com/1142 [17]Fitchard, K. (2012, January). “Verizon charging 4G
prices but selling a lot of 3G phones.” http://gigaom.com/mobile/verizon-charging-4g-prices-but-selling-a-lot-of-3g-phones/
[18]Gartner. (2010). “Gartner Identifies the Top 10 Strategic
Technologies for 2011.”
http://www.gartner.com/it/page.jsp?id=1454221
[19]Golden, B. (2009). “How cloud computing can transform business.”
http://blogs.hbr.org/cs/2010/06/business_agility_how_clo ud_com.html
[20]Sahlin, J. (2011). Workshop: Cloud architectures for government. Presented at the NDIA Cloud Computing Symposium, San Diego, CA. http://www.ndia-d.org/attachments/article/76/Sahlin_Cloud%20for%20Go vernment %20Workshop.final.pdf
[21]Oppenheimer, C. (2012, February). “Which is less expensive: Amazon or self-hosted?” http://gigaom.com/2012/02/11/which-is-less-expensive-amazon-or-self-hosted
[22]Bain, S. A., Merchant, F., Minns, B., & Thomas, J. J. (2010, March). Building a Dynamic Infrastructure with IBM Power Systems: A Closer Look at Private Cloud TCO.
![Fig.3: Typical Layer 2/3 Tree Network Architecture (adopted from [9])](https://thumb-us.123doks.com/thumbv2/123dok_us/8121277.794266/4.595.136.466.417.557/fig-typical-layer-tree-network-architecture-adopted.webp)