2017 2nd International Conference on Computer Science and Technology (CST 2017) ISBN: 978-1-60595-461-5
Study of Prediction and Simulation of Flooding
System Modification in Oil Field
Yan WANG
1,a, Yong-liang REN
2,*and Yu-lian CHANG
31,2,3 Daqing Petroleum Institute, Daqing, China
*Corresponding author
Keywords: Flooding production, Prediction model, Scheme project, Prediction and simulation.
Abstract. The prediction model of water injection rate has been built in this paper. The rate of injection water is a function of oil yield and synthetic moisture content among predicting process. The model is calculated by LS method. Combining real geology conditions with real flooding well network, the flood pattern modification sketch can be given both to old and new development block. Injection well quantity, injection station quantity and pipe network modification have been included in this sketch. According to the prediction rate of water injection and the modifications scheme, the computer simulation experiment can be completed for different operating sketch. The iterative method was adopted to find the solution of simulation experiment, the conditions of flood pattern, injection stations and pipe network have been expressed in operating parameter. At last, the correction of method is validated by practical data of an oil field.
Introduction
The production system in oil field is a large-scale and complicated engineering system, the bigger the system is, the level of the system structure is more complicated. Oilfield production process is a dynamic process, whose production state changes dramatically with the oilfield development. It is particularly important to make the production planning and reasonable adjustment for oilfield production system in order to adapt to the change of the production status. Planning and design must be combined with the history of the development of oil field production. It is the basis of scientific management of oil fields and production plan, the basement of formulating oilfield development planning. And the basis of designing plan of oilfield development adjustment in condition that predicting future production status
Due to the traditional prediction on the output of oil and production of liquid in oil field projects based on the history of oil field production, it lacks adequate awareness about prediction project of production system. Aiming at this problem, this paper establishes the mathematical model of oilfield water injection. Make a production forecast of water injection and a simulation about the production process to keep the operation of the oil production system stable in order to achieve high efficiency and low cost.
Prediction Model of Production System of Water Injection
Forecast model of water volume can be expressed as: V k Q r R k Q A k
V( )= ( ( ) + 1( ))+ (1)
In above formula: )
(k
V ——annual forecasted water injection;
A——injection-production ratio
) (k
Q ——forecasted oil production;
R——crude oil volume factor;
r——The relative density of ground crude oil; )
( 1 k
Q ——forecasted water production of well;
V——a combination of spilling volume, washing well water volume and water
consumption of fixing;
Among independent variable is random time(k≠0)
and c
j j
k= − 0
c——constant;
0
j ——year before the year of spilling;
j——forecasted spilling year;
forecasted oil production adopting Professor Weng literature [4] formula.
( )
k A Bk e b( )
kQ = + n −k + (2)
n B
A, , ——Solved-for parameters
the relationship between water volume of well and comprehensive water rate can be expressed as: ) ( 1 ) ( ) ( ) ( 1 1 1 k X k Q k X k Q − = (3)
( )
k1X —comprehensive water rate
comprehensive water rate adopt literature [4] LogisTic fuction
( )
( )
− = + + = − 0 1 1 1 01 . 0 1 j j k k b Ee k X Fk (4) Above formula FE, —solved-for parameters;
( )
10, j, bk j
k, meaning with former;
so k1=kc
synthesize formula (1), (2), (3), (4) can reach annual forecasted water injection:
Planning Prediction of Water Injection System
In the process of oilfield production, planning and design work is indispensable and important, no matter whether it is a new developing field or a developed field for many years. It’s necessary for new oilfield to make program design according to the structure of the production system and design a production adjustment scheme for old fields in time and obtain the biggest economic benefits, which mainly accord to the change of the oil field production.
Planning Prediction of Numbers of Injection Well
In water injection system, increasing the injection wells reasonably not only maintain stratum pressure but also enhance oil recovery and reduce the comprehensive water content. According to the injected water volume prediction model, water injection production system prediction mainly calculate water injection, including oil field , water injection system structure plan. According to the scheme of oilfield water injection system and the needs of the injected water volume, make the adjustment of the network between water injection wells and stations.
The optimal injection well number calculation formula:
(
)
( 6 )2
ln
H EH
B
CH H B
H
p p
h k
r Q
n
π π
π σ ϕμ
− =
Above formulaQ—— predicted the water injection;
B
k ——water phase permeability near well;
B
μ ——Viscosity of water;
CH
r ——apparent well radius;
h——well thickness;
H
pπ ——average formation pressure
H
σ ——half of injection well spacing;
ϕ——Injection Wells pollution factor;
EH
p ——bottom pressure of Water injection well
Planning Forecast of the Number of Water Injection Station
Base on water injection prediction, calculate the volume of forecast injection. With selecting production capacity of water injection station, the number of water injection station in the new oil field can be determined.
station injection water
of capacity production
prediction injection
water =
station
n
For adjustment of old oilfields, water injection station number to determine the need to consider the number of the original water injection station in a production system and the water injection station load case, determine the water injection station number.
production a
in station injection water
prediction injection
water -station injection water
of capacity production
n=
water injection station of water flood radius. If the water injection station load rate below 50%, which is very different so shut off the water injection station planning. When the production capacity of the water injection system’s difference value is negative, the surface-area will be expected to transform planning water injection station or the new water injection station. According to the distribution of oil field injection well and water injection station load rate, determining the number and position of modification or new water injection station
The Layout of Water Injection Pipe Network Prediction
In injection, well and water injection station planning, water injection pipe network prediction should meet service requirements and a minimum investment of pipe network topology optimization design problems. Put forward the design scheme of water injection pipe network or modification design
That plan prediction process of water injection system need to apply the water injection system simulation technology. According to the requirements of predicting water injection, the different design scheme of computer simulation experiment was carried out to fit the development of oil field production water injection production structure scheme.
The Operation of the Water Injection Production System Forecast Simulation On the basis of water injection system simulation technology, the simulation experiment on the system is carried out. Simulate the system running state of the forecast period. The simulation test results can be used well respectively, and system analysis, namely the injection allocation under the planning scheme of injection Wells and water injection station load and water injection system, the change of the parameters is analyzed, according to the analysis results can be further revised production planning scheme of the system.
Water injection production system operation simulation model, the new production system, according to the planning scheme and the geometry of the network topology design system simulation model is set up; To reform the existing production system, according to the plan and adjust as the original production system simulation model is established. System simulation model is based on the theory of fluid mechanics such as literature [3], making respectively node model, according to the node flow balance principle, the yuan, node network system model, so Establish the system overall equation:
C
KH =
K ——Network feature matrix
H ——The pipe network pressure vector C ——The network input vecto
Instance Analysis
As the correctness of the test methods used in xxx oilfield prediction simulation examples. At present, the whole xxx oil field has been built 787 injections well and water injection station 6, 156 between water distribution, more than 1100 of the pipeline water injection production system. Adopting the oilfield from 1993 to 1993, 13 annual oil production and comprehensive water content data as the basis of modeling the data.
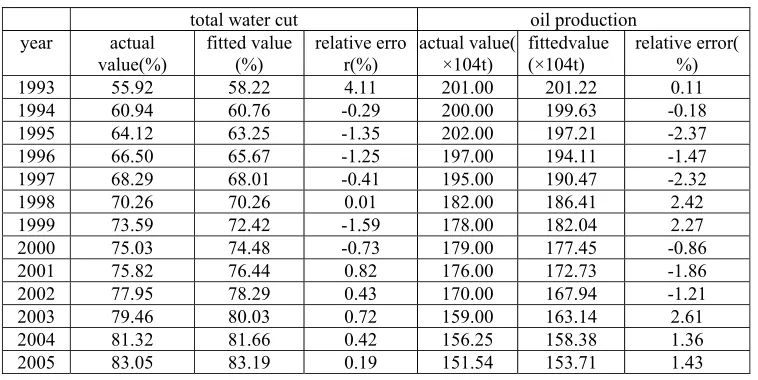
Take a year for the 1979 production years ago, to predict the year of 2007-2010. The parameter calculation of oil production and comprehensive water cut and press type (5) prediction model is established. According to the prediction model, the field of oil production and comprehensive water cut compares the calculated value with actual value which is shown in table 1.
Table 1. Prediction model calculated value compared with oil field actual values. total water cut oil production year actual
value(%) fitted value(%) relative error(%) actual value(×104t) fittedvalue(×104t) relative error(%) 1993 55.92 58.22 4.11 201.00 201.22 0.11 1994 60.94 60.76 -0.29 200.00 199.63 -0.18 1995 64.12 63.25 -1.35 202.00 197.21 -2.37 1996 66.50 65.67 -1.25 197.00 194.11 -1.47 1997 68.29 68.01 -0.41 195.00 190.47 -2.32 1998 70.26 70.26 0.01 182.00 186.41 2.42 1999 73.59 72.42 -1.59 178.00 182.04 2.27 2000 75.03 74.48 -0.73 179.00 177.45 -0.86 2001 75.82 76.44 0.82 176.00 172.73 -1.86 2002 77.95 78.29 0.43 170.00 167.94 -1.21 2003 79.46 80.03 0.72 159.00 163.14 2.61 2004 81.32 81.66 0.42 156.25 158.38 1.36 2005 83.05 83.19 0.19 151.54 153.71 1.43 Calculated from 2007 to 2010, oil production, the change of water rate and water injection in oilfields, as shown in table 2.
Table 2. Hair that predict from 2007 to 2010. time
(year)
Annual
output (104t) annual oil production(104t) output of Annual water(104t)
moisture content
(%) flooding(In water 104m3)
2007 1029.61 144.71 884.89 85.94 1331.34
2008 1094.94 140.45 954.48 87.17 1407.98
2009 1166.25 136.35 1029.90 88.30 1491.88
2010 1244.24 132.44 1111.80 89.35 1583.86
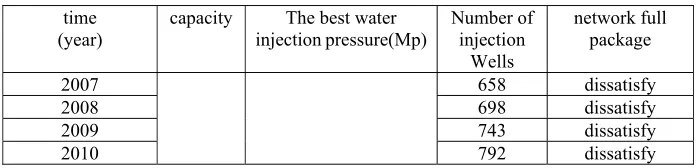
[image:5.612.118.497.250.440.2]According to the prediction of water injection, plan and forecast water injection system production. Calculated in accordance with the capacity coefficient and water injection pressure, water injection station analysis forecast analysis with production planning, as shown in table 3, 4:
Table 3. Adjust the water injection station before the load. 2007 2008 2009 2010 Standing
Table 4. The production planning forecast analysis time
(year)
capacity The best water injection pressure(Mp)
Number of injection
Wells
network full package
2007 658 dissatisfy
2008 698 dissatisfy
2009 743 dissatisfy
2010 792 dissatisfy
Visible, by 2007, due to the load is too high, the water injection station will not be able to complete tasks, water injection need to increase the ability of water injection in water injection station or improve water injection station. According to the original water injection stations ability, according to the predicted, the surface-area will water the evenly distributed in proportion to the stations, ensure that make full use of every station.
System planning adjustment scheme as shown in table 5. Table 5. System adjustment scheme. year Need to increase the
number of injection Wells
Standing filling ability Need to increase the number of
pipeline
2007 36 puI-1water injection
station2 DFG155-170×9 changeD300-150×10A
36
2008 40 No change 40
2009 45 TaiNan2#water
injection station1D155-170×10 changeD300-150×10A
45
2010 49 Pu#3 water injection
station1DFG155-170×10 changeD280-160×10
49
Setting scheme based on the above, and points the annual forecast water injection production process simulation calculation, table 6 for water injection station load situation analysis, table 7 for the system operation situation analysis.
Table 6. After adjusting water injection station load. 2007 2008 2009 2010 load(%) 93.52 98.90 96.21 95.41 The running situation of water injection system in table 7
Table 7. System operation situation analysis. time water injection
rate(m3/d)
The motor efficiency
(%)
System pump (%)
pipe network efficiency
(%)
system efficiency
(%)
power consumption
(kWh) present 32794 95.00 73.51 74.63 52.11 199364
2007 36475 95.00 73.76 74.10 51.92 223376
2008 38574 95.00 74.89 73.67 52.41 231194
2009 40873 95.00 74.27 70.18 49.52 260617
2010 43393 95.00 74.20 69.03 48.66 274896
injection station has reached the water demand. However, water injection system pipe network efficiency and system efficiency were decreased.
Forecasting method is not the only; the different methods to predict the results are not always the same. Normally, allows for forecasting error, also will have certain error. Prediction results conform to the actual, constantly using new actual data, the increase of information conditions predicted forward, so as to avoid the faults in our practical work, provide reliable basis for decision making.
Conclusion
Large-scale fluid networks of oilfield water injection system, the author of this paper, for the first time combine prediction with computer simulation technology. Based on the study, the following conclusions can be obtained:
(1) This paper is put forward by professor WengWenBo oil field oil production, with comprehensive water cut life cycle model, the prediction model established can correctly reflect the surface-area variation rules of oilfield water injection production, which can be used in actual production in order to aid in the production of oilfield water injection.
(2) According to the prediction of oilfield water injection, water injection production planning and reconstruction scheme of production system can be given, which greatly improve the efficiency of water injection system planning and design. It also improves the level of the scientific management of water injection production system.
(3) Based on the theory of computer simulation and prediction analysis of oilfield water injection production system structure, the annual performance of the system is given, including injection system efficiency, power consumption, such as the simulation production indicators, the oil field has an important guiding significance to the production planning and operation management.
References
[1] Ren Yong-liang. Oilfield water system model structure parameter inversion method research. Master degree theses of master of engineering. Daqing: Daqing Petroleum Institute.2012,3.3-11
[2] Chang Yu-lian, Gao sheng, Guo Jun-zhong. Water injection pipe network system model simplification technology and calculation method for the study. Acta Petrolei Sinica.2010,22(2):95~100.
[3] Gao sheng, Guo Jun-sheng, Chang Yu-lian. Mathematical model of oilfield water injection pipe network system and the calculation method for the research. Drilling & Production Technology. 2010,24(5):54~56.