2017 2nd International Conference on Computational Modeling, Simulation and Applied Mathematics (CMSAM 2017) ISBN: 978-1-60595-499-8
Machine Learning for Activity Recognition
from Movement Time Series Data
Young-Nam Kim
1, Jin-Hee Park
2, Gyu-Jin Jang
3, Hye-Yeon Yu
4and Moon-Hyun Kim
5,*College of Software, Sungkyunkwan University, Republic of Korea
*Corresponding author
Keywords: Activity recognition, Trajectory, Time series data, C4.5 algorithm.
Abstract. Activity recognition is the core technology of intelligent video surveillance systems and focuses on the behavior of a single object or a pair of objects. A common approach to activity recognition is to first extract and track the characteristics of moving objects from an image sequence, with the goal of converting pixel-level data into low-level functions appropriate for activity analysis. And in these methods, it is important to successfully extract good features and analyze the spatio-temporal interaction of the type of object moving from the extracted features. In this paper, we propose a three step activity recognition model that takes into account the spatial elements of the trajectory using time series data of moving pedestrian trajectories. Activity recognition modeling used the c4.5 algorithm and performed recognition experiments on the four behaviors defined in the CAVIAR dataset.
Introduction
The human behavior recognition system seeks the goal to discriminate one or more objects behavior through the observations of a given context. The interest of this type of system is increasing with the growth of intelligent surveillance video systems. These systems are able to notify the warning of potential crimes or risky actions to relative institutions when it automatically detects abnormal behavior in surveillance environment. Moreover, it helps the rehabilitation of patients by the detection of patient's behavior in case of the healthcare system. As shown in the above example, behavior recognition is one of the core elements of several applications such as visual surveillance, video retrieval and human-computer interactions. Recognition of human behaviors can be regarded as the last step of a series tasks composed with segmentation, tracking, identification and classification [1].
The research of human behavior recognition aims to enable it to learn common behaviors in video data, without including specific knowledge about the tasks performed by people in the monitoring environment. General approaches to this goal are composed with this 3 steps, (a) the segmentation and tracking of the interested objects (people), (b) the extraction of a set of features (position, motion, shape) from the tracked object, (c) the classification of the observed behaviors using extracted features into one of several classes. The learning methods such as simple rule base or statistical regularity of data are used for the classification.
In this paper, we propose a three step activity recognition model that takes into account the spatial elements of the trajectory using time series data of moving pedestrian trajectories. In the first preprocessing step, the pedestrian trajectory is divided at intervals of 1 second and expressed as a vector. Then, the displacements between adjacent frames are calculated and clustered. In the second feature extraction step, features for pedestrian activity recognition are extracted from the divided trajectories. The feature is divided into temporal feature and spatial feature. In the final step, the decision trees for recognition and classification of pedestrian activity are learned using extracted features. The decision tree is generated by the C4.5 algorithm. The experiment utilized the CAVIAR dataset and the recognition experiment was performed on the four defined activities.
Proposed Method
Trajectory Segmentation
This section describes the trajectory segmentation step. The trajectory is a sequence of the center point of the target pedestrian for each frame. In the trajectory 𝑇 = ((𝑥0, 𝑦0), … , (𝑥𝑛, 𝑦𝑛)), (𝑥𝑖, 𝑦𝑖) is the center position of the pedestrian in the 𝑖 th frame and two adjacent points on the trajectory can be expressed as (𝑥𝑖−1, 𝑦𝑖−1) and (𝑥𝑖, 𝑦𝑖). Is segmented by sub-sampling of the point sequence every
second to obtain the segmented trajectory. The video sequence used in this paper consists of 1 second of 25 frames. The segmented trajectory is expressed as 𝑇𝑠 = ((𝑥(1), 𝑦(1)), … , (𝑥(𝐾), 𝑦(𝐾))) and K is the length of the entire sequence.
Generally, in the case of moving pedestrians, it is difficult to relate the displacement of the pedestrian center point to the physical movement of the pedestrian between successive frames, since the density of the pedestrian center points constituting the trajectory is high. On the other hand, if the trajectory is divided by seconds, the number of the center points of the pedestrian constituting one trajectory is reduced to 1/25, so that the density of the pedestrian central points constituting the trajectory can be greatly reduced and the time series characteristic of the trajectory can be easily grasped.
Next, we focused on the spatial characteristics of the trajectory. In order to express the spatial characteristics of the trajectory, the motion characteristics along the region should be extracted from trajectory. First, each trajectory is transformed into a vector sequence(𝑤⃗⃗⃗⃗ , … , 𝑤1 ⃗⃗⃗⃗⃗ )𝑛 , where each vector
is a velocity vector between successive frames. The vector 𝑤⃗⃗⃗⃗⃗ 𝑛 is calculated from the 𝑖 − 1 th
trajectory point and the 𝑖 th trajectory point and can be expressed in polar coordinates as in Eq. 1 and Eq. 2.
𝑤𝑖
⃗⃗⃗⃗ = [𝛿𝑖, 𝜃𝑖], 𝑖 = 1, … , 𝑛 (1)
𝛿𝑖 = ‖(𝑥𝑖, 𝑦𝑖) − (𝑥𝑖−1, 𝑦𝑖−1)‖, 𝜃𝑖 = 𝑎𝑟𝑐𝑡𝑎𝑛 𝑣𝑖· 𝑦
𝑣𝑖· 𝑥 (2)
The velocity vector of the trajectory is clustered into several groups using the K-means algorithm. Each velocity vector belongs to one or more groups, which are described in detail in the next section. In conclusion, we performed the trajectory segmentation and vector transformation to extract features that take both time series and spatial characteristics of the trajectory into consideration.
K-means Clustering Algorithm
min𝑏,𝑤∑ ∑ 𝑤𝑖𝑗‖𝑥𝑖− 𝑏𝑗‖ 2 2 𝑘
𝑗 𝑛
𝑖 s. t. ∑ 𝑤𝑗 𝑖𝑗 = 1, ∀𝑗 (3)
The K-means algorithm has a disadvantage that it is greatly affected by the clustering result according to the initial center value. However, the K-means algorithm is easy to implement due to the simplicity of the procedure and has an advantage that the calculation efficiency is relatively higher than that of the hierarchical clustering algorithm. In this study, we performed clustering using different k values and found that the sum of distances was the best when k value was 4.
Feature Extraction
First, the temporal features are described. The instantaneous velocity 𝑠(𝑡) represents the velocity magnitude, which is the moving distance of the pedestrian for 1 second. When the center point of the pedestrian at a specific time t is 𝑃(𝑡)⃗⃗⃗⃗⃗⃗⃗⃗ = (𝑥(𝑡), 𝑦(𝑡)) and the center point of the pedestrian at the previous time t-1 is 𝑃(𝑡 − 1)⃗⃗⃗⃗⃗⃗⃗⃗⃗⃗⃗⃗⃗⃗⃗⃗⃗ = (𝑥(𝑡 − 1), 𝑦(𝑡 − 1)), the instantaneous velocity 𝑠(𝑡) is measured as
the Euclidean distance from the point 𝑃(𝑡 − 1)⃗⃗⃗⃗⃗⃗⃗⃗⃗⃗⃗⃗⃗⃗⃗⃗⃗ to the point 𝑃(𝑡)⃗⃗⃗⃗⃗⃗⃗⃗ . It is useful for classifying the movement situation and the stagnation situation of the pedestrian.
The maximum instantaneous velocity 𝑠𝑀 and the minimum instantaneous velocity 𝑠𝑚 respectively
represent the maximum instantaneous velocity and the minimum instantaneous velocity of the entire trajectory sequence.
The moving direction change, d represents the difference between the current movement direction of the pedestrian and the previous movement direction, and 𝜃𝑡 is the movement direction from t-1 to t seconds of the pedestrian. The change in the direction of movement is measured to account for the sudden movement or change of the pedestrian. The maximum direction change 𝑑𝑀 and the minimum
direction change 𝑑𝑚 are respectively calculated as the maximum and minimum values for the entire
trajectory.
The following is a description of spatial features. The trajectory T is divided into several clusters showing the local distribution of similar motions according to the kinetic characteristics by the K-means algorithm. The spatial characteristics proposed in this paper represent the regional characteristics of each cluster. The maximum average speed 𝛾𝑀 and the minimum average speed γm
are calculated as the maximum and minimum values of the average speed for all the clusters. Further, the maximum average moving direction φ𝑀 and the minimum average moving direction φ𝑚 are
calculated as the maximum and minimum values of the average moving direction for all the clusters.
C4.5 Algorithm
The C4.5 algorithm is a modified decision tree algorithm developed by J. Ross Quinlan [7]. The initial version is the ID3 algorithm [8]. The ID3 algorithm has the advantage that it can be applied to various fields of the real world because the C4.5 algorithm can process the numeric type property, unlike the case where all attributes can be processed only when they are categorical attributes. In addition, it is an improved algorithm for processing attributes by reflecting the depth problem of decision trees and different weights compared with ID3 algorithm. The C4.5 algorithm performs a Divide and Conquer operation to handle numeric attributes. In general, binary division is used rather than multiple division, and one break point must be found when dividing into lower nodes. The C4.5 algorithm uses the concept of information to calculate the information gain for each possible splitting point. Information benefit calculation is a method that can minimize the average information required to classify a given case, and to successfully partition the input training set.
When the total training set is |𝑆|, the current training set is S, and the number of cases belonging to class 𝐶𝑖(𝑖 = 1,2, … , 𝑁) is 𝐹𝑟𝑒𝑞(𝐶𝑖, 𝑆), the average information(Entropy) required to identify a given class of cases is as shown in Eq. 4.
𝑖𝑛𝑓𝑜(𝑆) = − ∑ (𝑓𝑟𝑒𝑞(𝐶𝑖,𝑆)
|𝑆| × log2(
𝑓𝑟𝑒𝑞(𝐶𝑖,𝑆) |𝑆| )) 𝑁
𝑖=1 (4)
At this time, the expected information after S is divided into n sub sets {𝑆1, 𝑆2, … , 𝑆𝑛} from a
𝑖𝑛𝑓𝑜 𝑋(𝑆) = ∑ |𝑆𝑖|
|𝑆| × 𝑖𝑛𝑓𝑜(𝑆𝑖) 𝑛
𝑖=1 (5)
The information gain obtained by dividing by X can be obtained as Eq. 6.
Gain(X) = info(S) – info X(S) (6) Although the existing ID3 algorithm selected the test X that maximizes the benefit of this information, there was a problem of excessive bias to variables with a large number of categories. Thus, the C4.5 algorithm normalizes the amount of average information needed to define a subset to which a case belongs in S. Split Info is the amount of information that occurs when S is divided into n subsets and is obtained as in Eq. 7.
𝑆𝑝𝑙𝑖𝑡 𝐼𝑛𝑓𝑜(𝑋) = − ∑ (|𝑆𝑖|
|𝑆| × log2( 𝑆𝑖
𝑆)) 𝑛
𝑖=1 (7)
If the information profit is divided into Split Info, it becomes the information ratio (Gain Ratio) which is the ratio of useful information generated by split and expressed as Eq. 8.
𝐺𝑎𝑖𝑛 𝑅𝑎𝑡𝑖𝑜(𝑋) = 𝑔𝑎𝑖𝑛(𝑋)
𝑠𝑝𝑙𝑖𝑡 𝑖𝑛𝑓𝑜(𝑋) (8)
We find a split point that maximizes the information gain ratio for each variable and selects the variable with the maximum information gain ratio among them. This separation criterion was studied to be much better in the experiment when the information gain ratio was used than the information profit standard.
Experimental
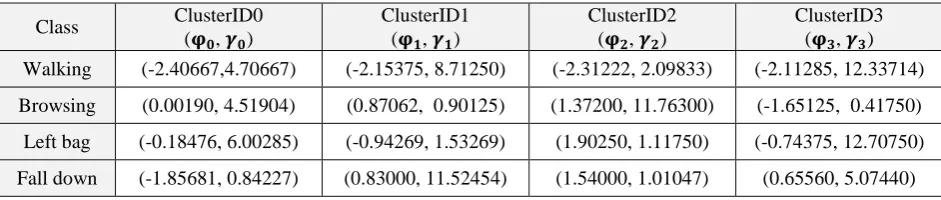
[image:4.595.62.533.498.598.2]We executed an experiment to classify the four behaviors which are defined by Caviar Test Case Scenarios dataset [9]. The four activities are as follows: walking, browsing, left bag, fall down. We prepared 100 trajectory data for each activity. At first, we conducted the trajectory segmentation for each trajectory data. And then, we extracted the four temporal features defined above. Next, we conducted Vector Transformation for each trajectory, and clustered into four groups by using K-means Algorithm. Table 1 shows Cluster Centroids for each activity.
Table 1. Cluster Centroids of four activity trajectory.
Class ClusterID0
(𝛗𝟎, 𝜸𝟎)
ClusterID1 (𝛗𝟏, 𝜸𝟏)
ClusterID2 (𝛗𝟐, 𝜸𝟐)
ClusterID3 (𝛗𝟑, 𝜸𝟑) Walking (-2.40667,4.70667) (-2.15375, 8.71250) (-2.31222, 2.09833) (-2.11285, 12.33714)
Browsing (0.00190, 4.51904) (0.87062, 0.90125) (1.37200, 11.76300) (-1.65125, 0.41750)
Left bag (-0.18476, 6.00285) (-0.94269, 1.53269) (1.90250, 1.11750) (-0.74375, 12.70750)
Fall down (-1.85681, 0.84227) (0.83000, 11.52454) (1.54000, 1.01047) (0.65560, 5.07440)
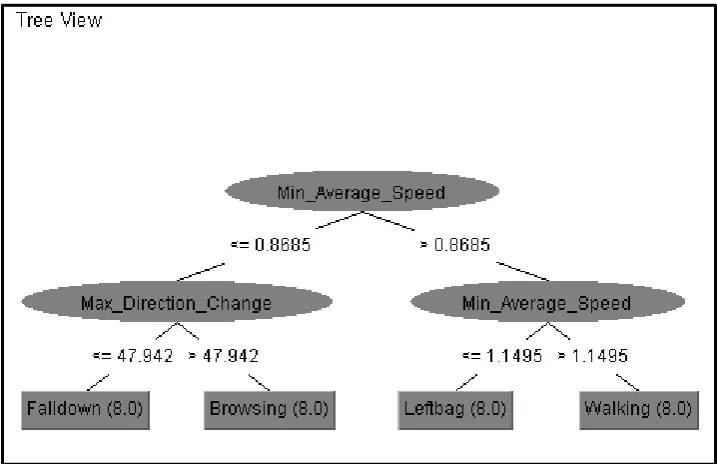
Figure 1. Decision tree using temporal features and spatial features.
In the first node, it is classified by the feature as minimum average speed and the division point is 0.8685. In the second node, it is classified by features of maximum direction change and minimum average speed. Maximum direction change feature classified Browsing Class and Fall down Class at the division point, 47.942. Minimum average speed feature classified Walking class and Left bag Class at the division point, 1.1495. We executed cross validation to avoid overfitting of data and it results 90.62% of the precision. From the results of analysis for Decision Tree which is modeled by C4.5 Algorithm, we could confirm that the spatial feature of the trajectory can be a valid feature for activity recognition.
Summary
In this paper, the new recognition methodology and technique are proposed for pedestrian activity recognition. The proposed methodology extracts temporal features as well as spatial feature from the trajectory data generated by video dataset. Previous studies show limits when Decision Tree is generated by only the temporal features from the trajectory. It does not consider regional characteristics of the trajectory to limit the activity classification precision. That is why we appended spatial feature extraction algorithm by K-Means Algorithm to promote our recognition model. The spatial features extracted from clusters of the trajectory are used to generate new Decision Tree. And, it has been shown to be effective for classification of various human activities with increased recognition precision. We still have future works for developing more temporal features and spatial features to recognize much more complicated group activities like arguing with other people or any other works.
Acknowledgement
This work was supported by the National Research Foundation of Korea (NRF) grant funded by the Korea government(MSIP) (NRF-2014R1A2A1A11053902).
References
[1] Ali, Anjum, and J. K. Aggarwal. "Segmentation and recognition of continuous human activity." Detection and recognition of events in video, 2001. Proceedings. IEEE Workshop on. IEEE, 2001.
[3] Ayers, Douglas, and Mubarak Shah. "Recognizing human actions in a static room." Applications of Computer Vision, 1998. WACV'98. Proceedings, Fourth IEEE Workshop on. IEEE, 1998.
[4] Campbell, Lee W., and Aaron F. Bobick. "Recognition of human body motion using phase space constraints." Computer Vision, 1995. Proceedings, Fifth International Conference on. IEEE, 1995.
[5] Davis, James W., and Aaron F. Bobick. "The representation and recognition of human movement using temporal templates." Computer Vision and Pattern Recognition, 1997. Proceedings, 1997 IEEE Computer Society Conference on. IEEE, 1997.
[6] MacQueen, James. "Some methods for classification and analysis of multivariate observations." Proceedings of the fifth Berkeley symposium on mathematical statistics and probability. Vol. 1. No. 14. 1967.
[7] J. Ross Quinlan, "C4. 5: programs for machine learning". Morgan Kaufmann Publishers, San Mateo, CA, 1993.
[8] J. Ross Quinlan, "Induction of decision trees." Machine learning 1.1 (1986): 81-106.
[9] Homepages.inf.ed.ac.uk, CAVIAR Test Case Scenarios.