University of Huddersfield Repository
Ali, Nadia and Peebles, David
Reactivity effects of concurrent verbalisation during a graph comprehension task
Original Citation
Ali, Nadia and Peebles, David (2013) Reactivity effects of concurrent verbalisation during a graph
comprehension task. In: Proceedings of the 35th Annual Conference of the Cognitive Science
Society. Cognitive Science Society, pp. 17201725. ISBN 9780976831891
This version is available at http://eprints.hud.ac.uk/id/eprint/17604/
The University Repository is a digital collection of the research output of the
University, available on Open Access. Copyright and Moral Rights for the items
on this site are retained by the individual author and/or other copyright owners.
Users may access full items free of charge; copies of full text items generally
can be reproduced, displayed or performed and given to third parties in any
format or medium for personal research or study, educational or notforprofit
purposes without prior permission or charge, provided:
•
The authors, title and full bibliographic details is credited in any copy;
•
A hyperlink and/or URL is included for the original metadata page; and
•
The content is not changed in any way.
For more information, including our policy and submission procedure, please
contact the Repository Team at: [email protected].
Reactivity effects of concurrent verbalisation during a graph comprehension task
Nadia Ali ([email protected])
David Peebles ([email protected])
Department of Behavioural and Social Sciences,University of Huddersfield, Queensgate, Huddersfield, HD13DH, UK
Abstract
We report an experiment investigating how concurrent verbal-isation during a task can affect performance (a so-called “re-activity” effect). Participants studied three-variable line graphs while (a) concurrently thinking aloud or (b) silently studied the graphs and provided an interpretation once they felt they had understood it. Results showed that verbalisation hindered per-formance significantly compared to the silent condition. To support the claim that the act of verbalising was hindering performance, competing explanations were also tested, which confirmed thinking aloud as the most likely cause. This contra-dicts claims by Ericsson and Simon (1993) that thinking aloud reflects but does not affect performance and provides further evidence that verbalising thought processes can hinder perfor-mance.
Introduction
Arguably one of the most important advances to have oc-curred during the cognitive revolution has been the attempt to develop theoretical justifications and rigorous methods for obtaining information about cognitive processes through the analysis of verbal reports produced during their execution.
Although the use of personal reports to infer mental pro-cesses has a long history, the approach has always remained controversial, with critics arguing that data obtained from them may be unreliable or that the methods themselves dis-tort or react with the cognitive processes under investigation. The employment of verbal reports was given a cognitive ba-sis and justification by Ericsson and Simon (1993) and their theory of protocol generation.
As a result of their analysis of the different types of ver-balisation, the use of verbal protocol methods is now consid-ered a legitimate approach for tracing thought processes and being a valid source of data about the steps involved in prob-lem solving and decision making (Wilson, 1994). Since the original proposal, the think aloud method has been widely adopted, resulting in a large body of research into the pro-cesses underlying decision making, problem solving, text comprehension, diagrammatic reasoning, writing, and vari-ous other tasks (Crutcher, 1994).
The method considered by Ericsson and Simon (1993) as being the most valuable and rigorous is theconcurrent think aloudmethod in which experiment participants are asked to simply verbalise their thoughts while carrying out a task. Ericsson and Simon (1993) claim that if appropriate instruc-tions are given and followed carefully, the reports participants provide are an accurate reflection of the thought sequence that would have been followed if participants performed the task silently.
Questions remain however concerning the possible reac-tivity effects of thinking aloud while performing a task and a number of recent studies have revealed that verbalising while performing a task can hinder performance, challenging Eric-sson and Simon’s (1993) claim that verbal reports are non-reactive.
This area of research has primarily focused on tasks such as face recognition and insight problem solving where the pro-cesses involved in reaching a solution are not accessible to the individual to report (Chin & Schooler, 2008). Schooler and Engstler-Schooler (1990) investigated whether describ-ing a previously seen face would later hinder participants’ ability to correctly recognise the face later. They found that compared to a control group who did not describe the face, those who did performed significantly worse in the recogni-tion test. Schooler and Engstler-Schooler (1990) called this effect “verbal overshadowing”, proposing that verbal over-shadowing occurs when attention is directed to information that can easily be verbalised and so eclipses information that cannot easily be put into words.
Ericsson and Simon (1993) have challenged findings such as these arguing that the method employed did not adhere to guidelines of how protocols should be elicited. They distinguish between different techniques employed to elicit verbalisations—when participants are asked only to report their thoughts (Type 1 verbalisations) and when participants are asked to explain them (Type 3 verbalisations). Numerous studies (e.g., Wilson and Hodges (1992); Wilson, Hodges, and LaFleur (1995)) have reported reactivity effects but have required participants to provide a reason for their decision (e.g., “why do you prefer this painting over the other one?”) which would elicit Type 3 verbalisations, a technique Erics-son and Simon accept is prone to reactivity effects. This is because when researchers ask “why?” questions, participants are required to process information which they would nor-mally not need to, thus altering their thought processes and making the method susceptible to reactivity effects (Ericsson & Simon, 1993). Therefore, there are only a handful of stud-ies reporting reactivity effects when employing this method which adhere to the criteria outlined for eliciting valid proto-cols.
where verbal overshadowing of information is likely to oc-cur (e.g., insight problems). Although this research is useful for identifying particular instances in which the think-aloud method may be susceptible to reactivity effects, the question remains whether these results generalise to tasks where in-formation is more readily available for verbalisation. There is a need therefore for a greater range of tasks to be tested to determine whether reactivity effects are limited to tasks where information may be difficult to verbalise, especially considering the growth in areas this method has been applied to (Wilson, 1994).
In addition, it has been assumed that it is the act of think-ing aloud itself which results in reactivity effects. There is the possibility of an alternative explanation however. When employing the think aloud method, the experimenter must be present with the participant, which may affect performance— the widely investigated “social facilitation/inhibition effect” (Zajonc, 1965; Rosenthal, 1976; Huguet, Galvaing, Monteil, & Dumas, 1999).
One study which potentially indicates this could be the case was conducted by de Vet and de Dreu (2007), who studied the effects of concurrent verbalisation on creativity in a group set-ting. They found that thinking aloud impaired performance, particularly in individuals who were sensitive to other peo-ple’s opinions of them. Although the authors concluded that the presence of others played a role in the performance im-pairments, it is difficult to generalise these results because the large groups used in the study are not typical of the scenarios used in the majority of verbal protocol studies.
Current experiment
The aim of this study is twofold. Firstly, we seek to determine whether reactivity effects found in the literature are due to the demands of thinking aloud or whether potential compet-ing explanations (e.g., experimenter presence) could account for this effect. Secondly, we also wish to investigate whether reactivity effects are limited to the types of tasks investigated in previous verbal overshadowing experiments by requiring people to think aloud while performing a task in which infor-mation is readily available for verbalisation.
To do this we employed a graph comprehension task for a number of reasons. First, in such tasks the information be-ing processed is readily available at all times, thereby reduc-ing the burden on workreduc-ing memory and freereduc-ing up resources for the interpretive task (Pinker, 1990). Second, previous re-search into graph comprehension employing verbal protocols (e.g., Ratwani, Trafton, & Boehm-Davis, 2008) has demon-strated that such methods are able to provide a reliable trace of the problem solving processes undertaken by users.
Finally, the graphs we employed, although widely used in statistics to depict relationships between more than two vari-ables, are relatively simple and constrain the interpretative processes available to users. Evidence for this assertion is provided by Halford, Baker, McCredden, and Bain (2005) who manipulated the number of graphically displayed
statis-tical interactions participants were required to process. They found performance for 2×2 problems (the type employed in our task) was near perfect but a steep drop in performance emerged when the graphical representation depicted 3 or 4 way interactions; consistent with processing capacity con-straints.
Based on these criteria, one might expect no effect of con-current verbalisation to be found in this task. However, in a previous study in which we compared graph comprehension assessed by written and verbal reports, we found the written interpretation to be superior in terms of accuracy and detail (Ali & Peebles, 2011). These findings did not reveal whether the differences were a result of a facilitation produced by the act of writing or a detriment from verbalising. The previous study laid open the possibility that this task may be suscepti-ble to reactivity effects. Therefore this study will attempt to determine whether this is the case.
Assessing potential reactivity effects in a
comprehension task
To measure reactivity effects, the output from thinking aloud is compared to that of a “silent” condition using dependent measures such as number of correct responses and this is the method adopted in this study. In problem solving tasks the output of the silent condition may be simply a solution to the problem, e.g., 29×4=116. In a graph comprehension task however, the output is a series of statements expressing the participants interpretation of the data depicted.
In the think-aloud condition this will result in participants verbalising their interpretation of the graphs until they com-plete the task. If reactivity effects are not an issue then per-formance will not differ between the think-aloud and silent condition, i.e., the demands of verbalisation will have no ef-fect on the ability of participants to successfully apply the processes involved in graph comprehension. If however per-formance is superior in the silent condition to the think aloud condition then the act of verbalising is interfering in the pro-cesses involved in graph comprehension.
However, the silent and think-aloud condition is not com-parable with these types of tasks because the silent condition involves two stages: an initial silent stage in which the partic-ipant constructs the interpretation and a second stage where this interpretation is reported to the experimenter. As this task is split into two stages it could be argued that improvement in performance could occur for a number of reasons other than remaining silent. For example, being explicitly required to communicate understanding to someone else could perhaps result in an improvement.
will be on par with the silent condition. If however the find-ings are similar to the think aloud condition then the silent and think aloud condition are comparable. This condition acted as a further control condition allowing for comparisons between the silent and think aloud condition.
Finally, the fourth condition tests any potential influence of experimenter presence on performance by including a “soli-tary” condition. These manipulations result in three condi-tions where participants are required to think aloud through-out the task and one condition where participants remain silent. If it is the demands posed by verbalisation resulting in reactivity effects performance should be superior in the silent condition than the other three conditions tested.
Method
Participants
Sixty undergraduate psychology students (41 female, 19 male) from the University of Huddersfield were paid £5 (ap-proximately $8) in grocery store vouchers to take part in the experiment. The age of participants ranged from 18.1 to 29.7 years with a mean of 22.2 years (SD=2.1). The participants were in their first year of a three year psychology degree and were randomly allocated to the experiment conditions.
Design
The experiment was an independent groups design with four between-subject variables: whether participants were in the think aloud, silent, solitary or summary condition. 15 partic-ipants were allocated to each of the graph conditions.
Materials
The stimuli used were six three-variable line graphs depicting a wide range of (fictional) content. The graphs were gener-ated using the PASW Statistics software package (produced by SPSS Inc.). Stimuli were printed in colour (with the levels of legend variable in blue and green) on white A4-sized paper. Examples of the stimuli used are depicted in Figure 1. The variables in the graphs were chosen so that no prior knowl-edge of the domain or relationships would influence interpre-tation.
Procedure
In the first think-aloud control condition participants were in-formed that they were to be presented with a sequence of six three-variable line graphs and that their task was to try to un-derstand each one as fully as possible while thinking aloud. The nature of the task was further clarified by telling partici-pants that they were being asked to try to understand the re-lationships between the variables (rather than simply describ-ing the variables in the graph), to try to comprehend as many relationships as possible, and to verbalise their thoughts and ideas as they did so. During the experiment, if participants went quiet, the experimenter encouraged them to keep talk-ing. If participants stated that they could not understand the graph, it was suggested that they attempt to interpret the parts
of the graph they could understand. If they still could not do this, they were allowed to move on to the next trial.
In the second silent condition participants were informed there were two stages to the task. In the first “quiet” stage they could take as long as they wanted to understand the graph they were viewing as much as possible. In the second “talking” stage they were required to tell the experimenter what they had understood about the graph.
In the summary condition participants were instructed that the experiment consisted of two stages—in the first “think aloud” stage they were to think aloud whilst interpreting the graph. In the second “talking” stage they were to tell the ex-perimenter what they had understood about the graph.
In the solitary condition instructions were identical to the think-aloud condition except participants were told they would be left alone throughout the experiment but it was im-portant they remember to think aloud throughout the task.
The instructions were designed to be consistent with Type 1 verbalisations, where participants are required to think -aloud throughout the task, but not explain or justify the state-ments they made. According to Ericsson and Simon (1993) eliciting protocols in this manner should result in no reactiv-ity effects.
Stimuli were presented in random order and all participants were informed that there was no time limit to the task. Ver-bal protocols were recorded using a portable digital audio recorder.
Data analysis
The verbal protocols participants produced while interpreting the graph were transcribed and their content analysed. Only statements in which a sufficient number of concepts could be identified were included for analysis. For example, the statement “low nitrogen levels have no effect on maize yield whether plant density is sparse or compact” was included whereas “low nitrogen affects. . . um. . . I’m not sure” was not. Data analysis was conducted according to the procedure and criteria employed in our original study (Peebles & Ali, 2009; Ali & Peebles, 2013). For each trial, the participant’s state-ments were analysed against the state of affairs represented by the graph. If a participant made a series of incorrect state-ments that were not subsequently corrected, then the trial was classified as an incorrect interpretation. If the participant’s statements were all true of the graph or if an incorrect inter-pretation was followed by a correct one, however, then the trial was classified as a correct interpretation. An example of a correct interpretation for the line graph in Figure 1a is “Whether nitrogen level is low or high when plant density is sparse, maize yield is two. When plant density is compact for low nitrogen level, maize yield is still at two but this increases to seven when nitrogen level is high”.
Sparse Compact 0
1 2 3 4 5 6 7 8 9 10
● ●
●
●
Maize Yield as a function of Plant Density and Nitrogen Level
Maiz
e Yield
Plant Density
Nitrogen Level
Low High
(a) Graph 4
Limestone Granite
0 1 2 3 4 5 6 7 8 9 10
●
● ●
●
Cutting Tool Wear as a function of Rock Type and Diamond Type
Cutting T
ool W
ear
Rock Type
Diamond Type
Bead Wire
[image:5.595.86.527.115.303.2](b) Graph 6
Figure 1: Two of the six line graphs used in the experiment.
the type of error against the trial. As these graphs depict a relationship between three variables, if participants failed to incorporate all three variables into their interpretation the trial was coded as an error. The nature of the fault was cate-gorised according to which of the variables had been ignored or misrepresented or whatever other error had occurred. Er-rors followed a similar pattern to the original experiment. An example of an incorrect interpretation for the line graph in Figure 1a is “When plant density is sparse, nitrogen levels remain low. When plant density is compact, nitrogen levels increase”. In this instance the graph viewer is ignoring the dependent variable, maize yield. Verbal protocol evidence revealed participants were unable to provide an interpretation incorporating all three variables. One participant providing this interpretation stated “I don’t understand how maize yield fits into it. I can understand the graph if I focus on plant den-sity and nitrogen level” and then proceeded to ignore the de-pendent variable. The occurrences and explanations for why these errors occur are explained in greater depth in Ali and Peebles (2013).
In this way, each participant’s trials were coded as being either correctly or incorrectly interpreted. The verbal protocol for each trial was initially scored as being either a correct or an incorrect interpretation by the first author and a sample (approximately 20%) of trials were independently coded by the second author. The level of agreement between the two coders was approximately 90%. When disagreements were found, the raters came to a consensus as to the correct code.
Results
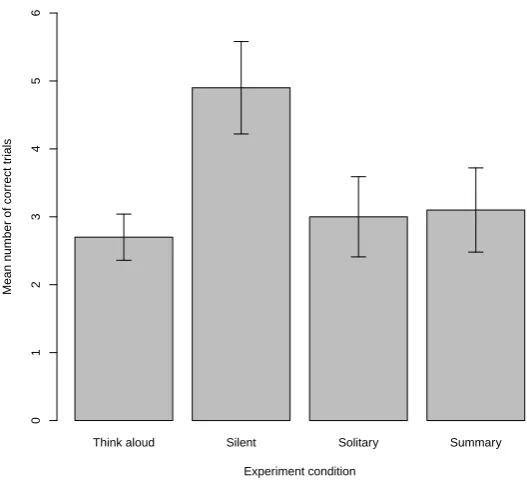
Figure 2 displays the number of correct trials in each verbal protocol condition. The silent condition resulted in a higher
number of correct trials compared to the other three condi-tions. A comparison of the number of correct trials between the think aloud, solitary, silent and summary conditions re-vealed that the silent condition resulted in a significant in-crease (Kruskal-Wallis H=7.93, d f =3, p< .05) in the number of correctly interpreted trials (mean rank =40.83) compared to the think aloud (mean rank =24.60), solitary (mean rank=27.0) and summary (mean rank=29.57) con-ditions.
Three post-hoc Mann Whitney U tests (with alpha levels Bonferroni adjusted to .017) revealed the significant differ-ence to be between the silent condition and the think-aloud condition (p=.005), but not the solitary condition (p=.713) nor the summary condition (p=.595).
Discussion
The results of this experiment reveal that participants who attempted to verbalise their interpretation of graphs were sig-nificantly less likely to provide a correct interpretation than subjects who interpreted the graphs silently before verbal-ising their interpretation. Additional control conditions re-vealed that it was not experimenter presence (the solitary con-dition) or the act of communicating understanding to some-one else (the summary condition) which resulted in the per-formance differences between the think aloud and silent con-dition. These results definitively demonstrate that verbalisa-tion results in reactivity effects; in this case a detriment in observed performance.
Think aloud Silent Solitary Summary Experiment condition
Mean n
umber of correct tr
ials
0
1
2
3
4
5
[image:6.595.163.427.95.336.2]6
Figure 2: Mean number of correct trials for the experiment conditions. Error bars indicate standard error.
to solve a series of algebra tasks with problems presented by computer in the silent condition but with cards in the verbal-isation condition. This introduced a potential confound of verbalisation condition and stimulus format.
In a recent meta-review, Fox, Ericsson, and Best (2011) identified 95 studies employing verbal protocols. Studies were excluded from the meta-analysis if they did not include a comparison to a control condition, if findings were consid-ered suspect because of potential confounding variables, or if effect sizes were not reported. Based on this analysis, the authors concluded that “Studies with confounds are common because few studies with verbal report and silent conditions are designed explicitly to test directly for reactivity” (p. 323). The experiment reported here directly addresses these is-sues. We carefully followed Ericsson and Simon’s guidelines for eliciting protocols and explicitly tested the think-aloud condition by comparing output to a silent condition as well as ruling out potential competing explanations for the differ-ence observed between the think-aloud and silent condition.
These findings provide a strong demonstration that reactiv-ity effects can emerge even when participants are asked only to report their thoughts (Type 1 verbalisations) and are not asked to explain them (Type 3 verbalisations). In addition, the task used in this experiment does not fall into a category where information is difficult to verbalise, demonstrating that reactivity effects are not limited to such tasks.
Although this task did not reveal any effect of experimenter presence, this issue deserves further investigation as tasks in the social psychology literature which can generate
self-presentation concerns may reveal findings which corroborate those of de Vet and de Dreu (2007). The increasing use of the verbal protocol method in the social psychology literature indicates further research is required to establish this method is appropriate for these types of research questions (Wilson, 1994).
Our knowledge of why reactivity effects emerge when em-ploying the verbal protocol method is limited primarily be-cause of the lack of studies explicitly testing for such effects. Based on previous findings, it appears that this effect is most likely due to a number of interacting factors and so such find-ings will not emerge consistently. Our findfind-ings demonstrate reactivity effects occur due to the demands of verbalisation and this effect is not restricted to tasks where information is difficult to verbalise.
One potential explanation which could account for the ef-fect observed in our experiment is a competition for pro-cessing resources explanation. Russo, Johnson, and Stephens (1989) argued that the additional demands for processing re-sources (which occurs when individuals are required to ver-balise whilst performing a task) can explain deterioration in performance. In order to deal with additional demands of ver-balisation, participants can draw upon any unused resources which are not being employed. When the demands of the task exceed processing resources however, reactivity effects can occur, resulting in a detriment in performance due to the resources being divided between completing the task and ver-balising throughout (Russo et al., 1989).
performance will be distorted by the generation of a concur-rent protocol. Even when a task adheres to established guide-lines for when the think aloud method is appropriate to use reactivity effects can emerge (Russo et al., 1989). Control conditions as standard practice when employing this method would help establish the conditions under which reactivity effects emerge; a necessary precursor for a theory of proto-col generation which can account for reactivity effects. This practice would also allow more confidence in findings em-ploying this method.
References
Ali, N., & Peebles, D. (2011). The different effects of think-ing aloud and writthink-ing on graph comprehension. In L. Carl-son, C. Holscher, & T. Shipley (Eds.),Proceedings of the twentieth annual conference of the cognitive science soci-ety.Mahwah, NJ: Lawrence Erlbaum Associates.
Ali, N., & Peebles, D. (2013). The effect of Gestalt laws of perceptual organisation on the comprehension of three-variable bar and line graphs. Human Factors,55(1), 183– 203.
Chin, J. M., & Schooler, J. W. (2008). Why do words hurt? Content, process, and criterion shift accounts of ver-bal overshadowing. European Journal of Cognitive Psy-chology,20, 396–413.
Cook, J. L. (2006). College students and algebra story prob-lems: Strategies for identifying relevant information. Read-ing Psychology,27, 95–125.
Crutcher, R. J. (1994). Telling what we know: The use of verbal report methodologies in psychological research.
Psychological Science,5, 241–244.
de Vet, A. J., & de Dreu, C. K. W. (2007). The influence of articulation, self-monitoring ability, and sensitivity to oth-ers on creativity. European Journal of Social Psychology,
37, 747–760.
Ericsson, K. A., & Simon, H. A. (1993). Protocol analysis: Verbal reports as data(Revised ed.). Cambridge, MA: MIT Press.
Fox, M. C., Ericsson, K. A., & Best, R. (2011). Do proce-dures for verbal reporting of thinking have to be reactive? A meta-analysis and recommendations for best reporting methods.Psychological Bulletin,137, 316–344.
Halford, G. S., Baker, R., McCredden, J. E., & Bain, J. D. (2005). How many variables can humans process? Psy-chological Science,16(1), 70–76.
Huguet, P., Galvaing, M., Monteil, J., & Dumas, F. (1999). Social presence effects in the stroop task: Further evidence for an attentional view of social facilitation. Journal of Personality and Social Psychology,77, 1011–1025. Peebles, D., & Ali, N. (2009). Differences in
compre-hensibility between three-variable bar and line graphs. In N. Taatgen, H. van Rijn, J. Nerbonne, & L. Schoemaker (Eds.),Proceedings of the thirty-first annual conference of the cognitive science society(pp. 2938–2943). Mahwah, NJ: Lawrence Erlbaum Associates.
Pinker, S. (1990). A theory of graph comprehension. In R. Freedle (Ed.), Artificial intelligence and the future of testing(pp. 73–126). Hillsdale, NJ: Lawrence Erlbaum As-sociates.
Ratwani, R. M., Trafton, J. G., & Boehm-Davis, D. A. (2008). Thinking graphically: Connecting vision and cognition during graph comprehension.Journal of Experimental Psy-chology: Applied,14(1), 36–49.
Rosenthal, R. (1976). Experimenter effects in behavioural research. New York: Irvington.
Russo, J. E., Johnson, E. J., & Stephens, D. L. (1989). The validity of verbal protocols. Memory and Cognition, 17, 759–769.
Schooler, J. W., & Engstler-Schooler, T. Y. (1990). Verbal overshadowing of visual memories: Some things are better left unsaid. Cognitive Psychology,22, 36–71.
Schooler, J. W., Ohlsson, S., & Brooks, K. (1993). Thoughts beyond words: When language overshadows insight. Jour-nal of Experimental Psychology: General,122, 166–183. Wilson, T. D. (1994). The proper protocol: Validity and
com-pleteness of verbal reports. Psychological Science,5(5), 249–252.
Wilson, T. D., & Hodges, S. D. (1992). Attitudes as tem-porary constructions. In A. Tesser & L. Martin (Eds.),The construction of social judgment(pp. 37–65). Hillsdale, NJ: Erlbaum.
Wilson, T. D., Hodges, S. D., & LaFleur, S. J. (1995). Effects of introspecting about reasons: Inferring attitudes from ac-cessible thoughts. Journal of Personality and Social Psy-chology,69, 16–28.