2020 4th International Conference on Modelling, Simulation and Applied Mathematics (MSAM 2020) ISBN: 978-1-60595-674-9
Simulation and Risk Assessment of Sand Mixing Equipment
Based on Function Failure Propagation
Shu-jie PANG and Jian JIAO*
School of Reliability and Systems Engineering, Beihang University, Beijing, China *Corresponding author
Keywords: Sand mixing equipment, Function failure identification, Fuzzy theory, Matlab Simulink.
Abstract. Sand mixing equipment is one of the key equipment in the process of shale gas exploitation. There is a complex interaction between various components of the sand mixing equipment. The failure of a single component could trigger a cascade of system failures. In view of this problem, we proposed a function failure identification and propagation model based on fuzzy theory. Matlab Simulink software was used for modeling and simulation. The as low as reasonably practicable principle is used to evaluate the risk levels of different failure conditions. By comparing the analysis results of traditional FFIP method and fuzzy FFIP method, the practicability and effectiveness of fuzzy FFIP method were proved.
Introduction
Shale gas is a kind of natural gas energy. Accelerating the exploitation of shale gas can alleviate the energy crisis to some extent. In the process of shale gas exploration, sand mixing truck is one of the most important equipment. However, there are complex energy transfer among its systems. At present, scholars' research on the failure of sand mixing equipment is very limited: they mainly study a single fault of sand mixing equipment [1-3]. In addition, there is a lack of research on fault propagation and risk assessment of the whole system of the equipment. The simulation and risk assessment for the sand mixing vehicle can guide the operators identify the faults quickly and propose solutions.
At present, the risk analysis methods have been developed very mature. However, the shortages of these methods in common are: heavy workload, strong subjectivity and inapplicable using in the complex systems. In addition, it is difficult for analysts to predict the failure behavior of the system completely, which requires analysts a very rich level of experience and knowledge of the system. Therefore, the model based safety analysis is formed. For example, the Failure Propagation Transformation Notation (FPTN) [4], the Hierarchically Performed Hazard Origin and Propagation Studies (Hip-hops) [5], Petri net [6] and Functional Failure Identification and Propagation (FFIP) [7]. FFIP method is a graphical processing technology based on the mapping between component-function-behavior. FFIP allows functional failures and fault propagation to be analyzed at a highly abstract system topology level before any potential high-cost design commitment is made. However, this method is seriously affected by the subjective judgment of personnel. For example, the analysis results are not accurate according to some data that is unclearly defined.
In this paper, we added the theory of fuzzy logic to the FFIP and proposed a new analysis method: Fuzzy FFIP Method. This novel method was used to analyze the failure propagation of sand mixing equipment with Matlab/ Simulink. To solve the problem of risk assessment of sand mixing equipment, we combine ALARP principle to classify the risk level. Finally, the influence degree of different components of sand mixing equipment on the system was explored, so as to provide safety measures.
Methods
Step 1. Establish functional and structural models:
The functional model reflects the transfer of functions between components of the system. The data flow among the functions is represented by variables such as signals, flow rate and pressure. The structural model describes the structural relationship of system components. It can use the same inputs and outputs as the functional model to describe map and components from the functional model to the structural model.
Step 2. Introduce process variables and variable deviations:
The system will generate complex data in the process of operation, so it is necessary to select appropriate process variables before establishing the models. The variable deviations can indicate the degree to which its actual value deviates from its design value. Therefore, the introduction of process variables and the calculation of its deviations are the basis for the analysis of behavior rules and functions of sand mixing equipment. The calculation method of variable deviation is shown in (1) and (2). 100%, 0 RV DV D D DV
(1)
100%, 0
D RVDV D (2)
Note: D is deviation; RV is real value; DV is design value. Step 3. Establish the fuzzy membership function:
The establishment of membership function is the key step of fuzzy control. Membership functions are obtained mainly through the experience of experts and operators [36].
Step 4: Inference the Behavior rules:
Behavior rules represent the behavior state of components according to the transitive relationship between process variables. First, we need to describe the possible states of components. Second, these states are expressed by process variables.
Step 5: Analyze the function failure logic:
The analysis of functional failure logic is to infer the functional state of components by using variable deviation and behavior rules. Generally, the functional states of components and systems can be divided into normal state, degraded state and failure state. However, the boundaries among these three cases is unclear, so fuzzy logic is introduced to describe them.
Step 6: Establish the model simulation and fault simulation
The simulation models are established by Matlab/Simulink software to carry out the fault simulation and obtain the simulation data.
Step 7: Evaluate the risk of functional failure:
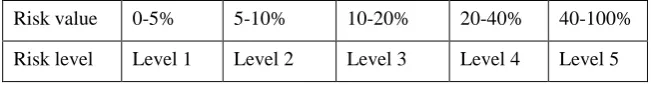
First, the weighted average method [8] is used to transform the fuzzy set into the determined deviation value. Through inductive reasoning, formula (3) is established to represent the general trend of the relationship between variable deviation and risk value. According to the ALARP principle, comparing the risk grading methods of various engineering fields [9-11], the functional failure risk of sand mixing equipment is divided into five grades. Table 1 shows the relationship between risk values and risk levels. Thus, the assessment of risk level is carried out.
2
0.05 (0 x 38) 150 102(38 100) 33 x y x x (3)
[image:2.595.135.461.744.787.2]Note: x is variable deviation; y is risk value.
Table 1. The relationship between risk value and risk level.
Risk value 0-5% 5-10% 10-20% 20-40% 40-100%
Demonstration
Structure and Function Modeling of Hydraulic Drive Subsystem of Sand Mixing Equipment
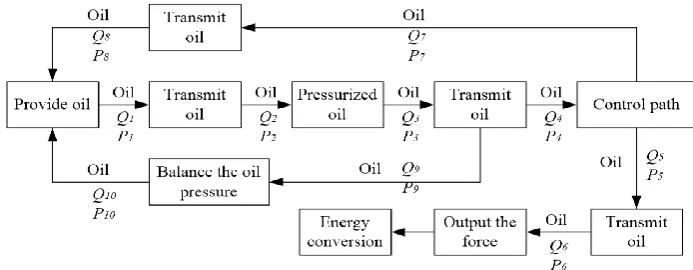
[image:3.595.111.489.199.330.2]This section takes the hydraulic drive subsystem of sand mixing equipment as an example to elaborate the process of function failure risk assessment. Figure 1 is the schematic diagram of the hydraulic transmission subsystem. According to the schematic diagram, the structural model (figure 2) and the functional model (figure 3) are established.
[image:3.595.124.467.361.503.2]Figure 1. Schematic diagram of hydraulic transmission subsystem.
Figure 2. Flow chart of hydraulic transmission subsystem structure.
[image:3.595.120.467.560.695.2]Note: Qi (i = 1, 2, … , 10) is quantity of flow, Pi (i = 1, 2, … , 10) is pressure.
Figure 3. Hydraulic transmission subsystem function model diagram.
Behavior Rules of Hydraulic Drive Subsystem of Sand Mixing Equipment
Table 2. Behaviour rules of hydraulic transmission subsystem.
Component Behavior rules
Oil tank
Nominal:Q1+Q9 = CQ1 > 0,P1+P9 = CP1 > 0; Leak:Q1+Q9 = CQ1 – Qleak,P1+P9 < CP1
Blocking:Q1+Q9 < CQ1,P1 +P9 < CP1; Breakage:Q1 = Q9 =0,P1 =P9=0
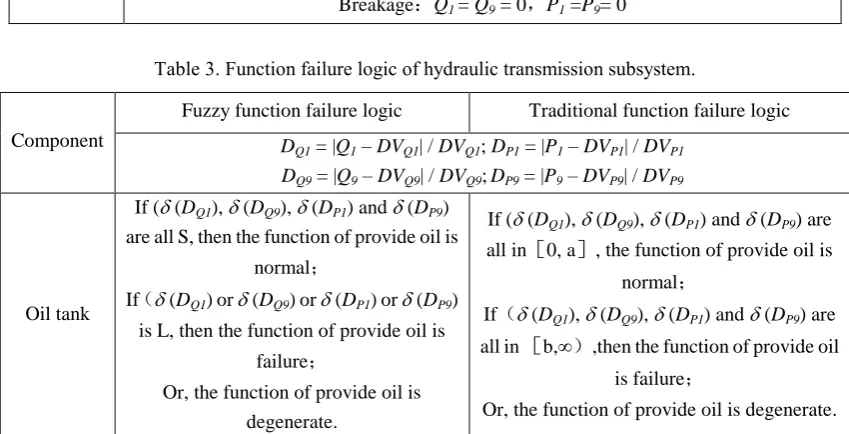
Table 3. Function failure logic of hydraulic transmission subsystem.
Component
Fuzzy function failure logic Traditional function failure logic DQ1 = |Q1 – DVQ1| / DVQ1; DP1 = |P1 – DVP1| / DVP1
DQ9 = |Q9 – DVQ9| / DVQ9;DP9 = |P9 – DVP9| / DVP9
Oil tank
If ((DQ1), (DQ9),(DP1) and(DP9) are all S, then the function of provide oil is
normal;
If((DQ1) or (DQ9) or (DP1) or (DP9) is L, then the function of provide oil is
failure;
Or, the function of provide oil is degenerate.
If ((DQ1), (DQ9),(DP1) and(DP9) are all in[0, a], the function of provide oil is
normal;
If((DQ1), (DQ9), (DP1) and (DP9) are all in [b,∞),then the function of provide oil
is failure;
Or, the function of provide oil is degenerate.
Note: variable deviation is represented by , then the normal state is = S, the degenerate state is
= M, and the failure state is = L
Simulink Simulation Model Design
According to the schematic diagram and structure flow chart of the hydraulic drive system of the sand mixer, Matlab Simulink software was used to build the simulation model. The Hydraulic toolbox in Simscape was mainly used in this model. Refer to the operation manual of HSC210 type sand mixer to obtain relevant parameter values of the hydraulic transmission subsystem. The Simulink model established in this paper is shown in figure 4.
The Fault Simulation
This model contains a total of 20 process variables, and Matlab is used for random simulation in situation of a single fault. For example, the output flow Q1 of the oil tank was reduced from
89.95L/min to 86.96L/min. The simulation results are shown in figure 5.
As can be seen from figure 5, the propagation path of functional failure is as follows: oil tank → pipeline 1→ hydraulic pump → pipeline 2→ three-position reversing valve and overflow valve → oil tank. Taking this faliure as an example, the fault simulation results are analyzed.
(1) Calculation the deviations: DQ1 = DQ2 = DQ3 = DQ4 = 3.324%; DQ9 = DQ10 = 16.473%;
(2) According to the behavior rules, the fault can be diagnosed as oil tank leakage.;
(3) Based on the empirical data obtained from the user manual of sand mixing equipment, we established the fuzzy membership function[12] of variable deviation based on ALARP principle. The calculated fuzzy set is {normal, degradation, failure} = {0.671, 0.255, 0}, and the reasoning condition of this system is in a normal state.
Figure 4. Hydraulic transmission subsystem simulation diagram.
Figure 5. Simulation results of fault scenario 1.
Results and Discussions
We first changed one variable at a time to simulate the single fault situation. Similarly, we changed two variables at a time to simulate the double faults. On this basis, we get 8 kinds of single faults and 56 kinds of double faults. Since the simulation results of double faults were more significant, we listed the simulation results of double faults, as shown in the Figure 6. It shows the risk assessment results of the fuzzy FFIP method and traditional FFIP.
[image:5.595.85.512.366.493.2]Figure 6. Risk assessment results of double faults.
[image:6.595.107.496.400.505.2]Furthermore, we compared the traditional FFIP method with the fuzzy FFIP method in another way. We selected three typical single failure scenarios: pump blockage, oil tank leakage, and pipe 3 blockage. According to Monte-Carlo stochastic simulation method [13], each scenario is simulated by changing its parameters for 100 times. Then, the mean and variance of the risks in different degrees of the same fault are calculated, as shown in table 4. Table 4 shows that the variance of the risk level simulated by the above three fault conditions is all larger than that of the fuzzy FFIP method. It indicated that the risk assessment results based on fuzzy FFIP have certain stability. Therefore, the fuzzy FFIP method can avoid the uncertainty and wrong judgment effectively.
Table 4. Monte-Carlo stochastic simulation results.
Fault
Fuzzy FFIP Traditional FFIP
Mean (L/min) Variance (L/min) Mean (L/min) Variance (L/min)
Pump block 0.2321 0.1543 0.2438 0.1824
Tank leakage 0.2184 0.1693 0.2953 0.2741
Pipe 3 block 0.1329 0.1735 0.1153 0.2225
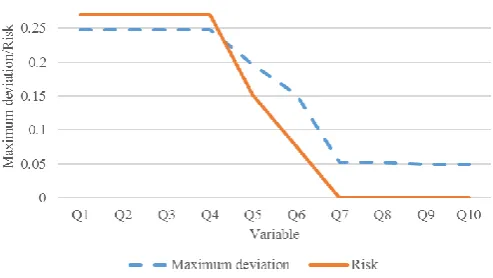
Finally, we adjusted the design value of each component to the original 95% to evaluate which component of the hydraulic transmission subsystem has the greater impact on the whole system. Then, we assessed the risk level. However, Figure 7 shows that the failure of oil tank and hydraulic pump has the greatest impact on the hydraulic transmission subsystem. Therefore, in the early design we should pay attention to improve the reliability of hydraulic pump. Moreover, we should strengthen the inspection and maintenance of the oil tank in the equipment operation phase.
[image:6.595.175.422.603.742.2]Conclusion
Sand mixing equipment is one of the key equipment for shale gas exploitation. However, there is a lack of research on risk assessment of sand mixing equipment. In this paper, we proposed the fuzzy FFIP method for risk assessment of sand mixing equipment. Then, we used MATLAB Simulink for modeling, fault simulation and result analysis. It was concluded that the oil pump was the most likely component to cause fault propagation. Finally, Monte-Carlo analysis result showed that the fuzzy FFIP method is more stable and accurate than the traditional FFIP method. This paper provided feasible suggestions and methods to analyze failure causes. While the proposed approach is quite practical, it can also be applied to other similar devices.
References
[1] Yuming Liu. Solutions to the fault of excessive oil temperature in the hydraulic system of the sand mixer [J]. Science and technology information, 2010, 7(29):527.
[2] Changyong Jiang. Handling of vibration failure of t36/20 sand mixer [J]. Equipment management and maintenance, 2012, 8(02):67.
[3] Lianhui Wen. Analysis of two faults of resin liquid supply system of sand mixer [J]. China foundry equipment and technology, 2012, 13(03):17-18.
[4] Fenelon P., Mcdermid J.A. An Integrated Tool set For Software Safety Analysis [J]. Journal of Systems and Software. 1993: 2/1-2/16.
[5] Papadopoulos Y., Mcdermid J. A. A new method for Safety Analysis and the Mechanical Synthesis of Fault Trees in Complex Systems: ICSSEA '99, 12th International Conference on Software and Systems Engineering and their Applications [C], Paris, 1999, 1-9.
[6] Mohammed Taleb-Berrouane, Faisal Khan, etc. Bayesian Stochastic Petri Nets (BSPN)- A new modelling tool for dynamic safety and reliability analysis[J]. Reliability Engineering and System Safety, 2020, 193.
[7] Kurtoglu T, Tumer I Y. A graph-based fault identification and propagation framework for functional design of complex systems [J]. Journal of Mechanical Design, 2008, 130: 051401.
[8] Jianhong Shen, Liting Gai, Suoni Wan etc. Risk assessment of deep foundation pit construction based on fuzzy set and improved evidence theory [J]. Journal of civil engineering and management, 2019, 36(02):28-34+41.
[9] Cassanelli, Fantini, Serra, and Sgatti. "Reliability in Automotive Electronics: A Case Study Applied to Diesel Engine Control." Microelectronics Reliability 43.9 (2003): 1411-416.
[10] Nianping Liu. Research on early warning of coal mine safety production risk [D]. Chongqing University, 2012.
[11] Yingxia Sheng, Qi Cheng, Xiao Zeng, etc. Decomposition of risk assessment index of hazardous chemical process in petrochemical enterprises [J]. China production safety science and technology, 2012, 8(03):96-101.
[12] Yong Chen, Xiaogen Wu. Research on safety risk assessment methods of industrial enterprises [J]. China public security (academic edition), 2008, 15(03):33-35.