2017 2nd International Conference on Wireless Communication and Network Engineering (WCNE 2017) ISBN: 978-1-60595-531-5
The Measurement and Analysis of Bluetooth Signal RF
Lu GUO
1, Jing SONG
2,*, Si-qi REN
2and He HUANG
21
Xi’ an ASN Technology Group Company, Xi’ an 710065, China
2
Chang'an University Electronic and Control Engineering School, Xi’ an 710064, China
*Corresponding author
Keywords: Measurement, Analysis, Bluetooth, Power control, Communication.
Abstract. Aiming at the traditional Bluetooth signal test method exists the problem which can’t capture the characteristics of the signal frequency with time, a system to test the RF power of Bluetooth signal based on the frequency hopping characteristic of Bluetooth signal is proposed. Test system based on Bluetooth signals in single and multiple common abrupt pulse power measurement, a comprehensive study of the transmission power and test method, this paper analyzes the ACPR, ACLR, CCDF several parameters, such as performance indexes and its impacts on the Bluetooth signal power. The results in the paper will provide theoretical basis for the systematization and automation of Bluetooth RF power control, which has a great significance to maintain the quality of communication links, reduces the overall interference of the system and improves the overall performance.
Introduction
The Bluetooth signal is essentially a digital radio frequency signal, its main characteristics are not only to occupy a certain frequency band, and the more important attribute is the time of frequency control (sometimes microseconds, sometimes a few seconds, several minutes even longer). Frequency hopping is one of the key technologies that is used in Bluetooth. Using the frequency hopping, the Bluetooth system has high enough anti-interference ability, the hardware is simple and the performance is superior. Under the condition of frequency hopping, whether frequency hopping pattern is carried out in accordance with the design of the frequency hopping pattern pseudo random jump or not will directly affect the frequency hopping anti-jamming performance of the system and the success of the whole design, so you need to test validation of frequency hopping pattern. Because the traditional test methods can't capture the Bluetooth signal frequency characteristics along with the change of time, we have to research a test method that can reflect essential features of the current signal by trigger, capture and analysis.
The article is in accordance with the Bluetooth RF technology protocol, as for the frequency hopping characteristics of the Bluetooth signal system and the RF power of the Bluetooth signal are tested. Through the test and analysis, the various performance parameters of the Bluetooth signal can be conveniently obtained, making the communication quality more reliable
Standard Summary of Bluetooth Radio Frequency
Bluetooth Radio Frequency Technology
suppression. The antenna switch should be used if the level of the level is too high to overload the receiver.
[image:2.612.135.472.167.256.2]Technology has its original purpose that is using low power consumption, low cost of wireless interface to replace the existing complex cable interface, so the Bluetooth radio frequency part don’t develop the new technology, but uses the protocols and algorithms that have been mature in the technology and the market, thus Bluetooth radio frequency standard is the first introduced, including the fewest mistakes and changes.
Figure 1. The circuit structure of Bluetooth technology.
Bluetooth Band and Channel Arrangement
As for the wireless communication system, the radio frequency part is “the air interface of communication system”, as for different manufacturers of equipment, the realization of the interaction of compatible or interoperability whose minimum requirement is the unity of the radio frequency specifications, and the communication quality is also determined by radio frequency. Bluetooth RF specification is Bluetooth radio frequency planning and channel arrangement and the performance of Bluetooth radio frequency transceiver. Specifically, to define the Bluetooth radio frequency modulation way, jumping parameters, transmit power, receiver sensitivity and so on.
Bluetooth works in the unlicensed 2. 4GHz Industrial, Scientific and Medical band. There are various wireless devices such as microwave oven and wireless LAN in the spectrum of Bluetooth. The Bluetooth uses the frequency hopping spread spectrum technology to avoid the disturbance. Bluetooth radio frequency spectrum of the lowest frequency in China is 2. 402 GHZ, the highest frequency of 2.48 GHZ frequency center frequency interval is 1 MHz, jump points are 79, and upper and lower guard bands are 3.5 MHz and 2 MHz, 79 jump frequently points should have at least 75 for pseudo random jump, in a period of 30 seconds, the using time of any one frequency point should not be more than 0.4 seconds.
Bluetooth RF Modulation Features
The binary frequency shift keying of the gaussian filter is used for Bluetooth RF (Gaussian Frequency Shift Keying, GFSK), the code element bandwidth BT=0.5, and a modulation index is between 0.28 and 0.35. The Bluetooth RF data speed is 1Mbps, the minimum frequency is not less than 115KHz, and the zero error is less than 1/8 code element period. The binary "1" is represented by positive frequency, and "0" is represented by negative frequency deviation. The symbol timing accuracy is higher than. The minimum frequency deviation of the launch sequence 1010 is not less than 80% of the launch sequence of 00001111 frequency deviation.
The Physical Channel of Bluetooth Physical Channel
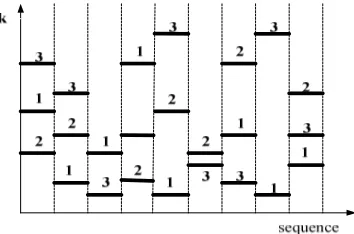
Figure 2. Bluetooth channel hopping pattern.
Time SLot
The frequency rate of the Bluetooth is 1600 times per second, and the duration time of each frequency is 1/1600= 625, which is called a time slot. The time slot is numbered according to the main equipment clock of piconet, and the cycle is 227. Data transmission is carried out between the device and the master in the same piconnet by the way of the Time Division Duplexer. As it is shown in figure 3, the main device sends data in even time slots, and the data is sent from the device that receives the data in the odd slots immediately following. The receiving and sending start time of data packet must be in exact synchronization with the time slots. Depending on the size of the data packet, a data packet can take up one to five time slots to send and receive.
6 2 5µs 6 2 5µs
1
f f2 f3
[image:3.612.173.443.347.434.2]6 2 5µs
Figure 3. Time-division duplex.
[image:3.612.193.425.537.652.2]The frequency of radio frequency remains constant during the time when the duplex is sent in a packet, and the frequency of radio frequency is determined by the current Bluetooth clock value for a single time slot that occupies only one time slot; The frequency of radio frequency is kept constant during the whole packet transmission during the multigap grouping of two or more time slots. See figure 4.
Figure 4. Characteristics of the constant signal frequency in a multi time slot.
spectrum. Between the two devices by time division multiplexing (TDD) communication, the sender and receiver alternately transmit in the interval of time, the one next to another, also adopt a fast frequency hopping scheme (1600 jump/SEC), in order to increase the link reliability in the crowded band. The FCC expects that band utilization will continue to increase, so reliability is the most basic requirement.
Bluetooth Query Signal Testing
In the test of Bluetooth query signal, agilent E4411B ESA spectrum analyzer was used, and the capture frequency was 2.4GHZ, and the amplitude was 0 dBm Bluetooth signal. The Bluetooth device has been transmitting the query signal before it is formed, and the Bluetooth query signal is analyzed. In order to simulate the actual traffic volume, the preloaded data is used as the pseudo random sequence PRVBS9, as they are shown in Fig.5,6,7, which are taken as the screenshots of the scan at 500ms, 50ms and 5ms, respectively.
[image:4.612.81.529.240.609.2]
Figure 5. Measurement of Bluetooth query signal at 500ms. Figure 6. Measurement of Bluetooth query signal at 50ms.
Figure 7. Measurement of Bluetooth query signal at 5ms. Figure 8. The time domain diagram of the Bluetooth Test signal.
Through the analysis of the spectrum are under different scanning speed, which can be seen that the Bluetooth query signal is composed of multiple different frequency components. In the case of 5ms scan time in Figure 7, the frequency of the Bluetooth signal is constantly hopping over a certain bandwidth.
Measurement of the Power Ratio of Adjacent Channels
Figure 9 shows a screenshot of channel power measurement for Bluetooth test signal, figure 8 shows the adjacent channel power (ACP) measurement of Bluetooth test signal.
Figure 9. A screenshot of channel power measurement
[image:5.612.92.522.114.296.2]for Bluetooth test signal.
Figure 10. The adjacent channel power (ACP) measurement of Bluetooth test signal.
Adjacent channel power (ACP) measurements are also known as adjacent channel power ratios (ACPR) and adjacent channel leakage ratios (ACLR) measurements. The two vertical white lines above indicate the bandwidth limitations of the central channel being measured. Through the analysis, what can be found that the Bluetooth signal is concentrated in the fixed bandwidth, and the interference of adjacent channels is very small, so the utilization rate is very high.
The Measurement of Complementary Cumulative Distribution Function
Figure 9. Complementary cumulative distribution function (CCDF) curve.
Summary
Based on Bluetooth radio frequency under the agreement of the Bluetooth signal system for time domain and frequency domain, the power of the measured results are analyzed, and the us for its various performance indicators have a deeper understanding, such as Bluetooth query signals is made, a number of different frequency component on a certain amount of bandwidth is constantly jumping frequency. The Bluetooth signal is concentrated in the fixed bandwidth, and the interference of adjacent channels is small and the utilization rate is very high. According to this indicator, the quality of the Bluetooth signal can be directly judged. The above test and analysis can make the parameters of the Bluetooth signal more deeply, and provide some theoretical basis for the future systematic and automation of Bluetooth signal testing.
References
[1] Chun Jin, Guang-chen Xu, Rui Sun. Bluetooth technology[M]. BeiJing: The electron industry book concern, 2001.
[2] You-yun Xu, Research on the intertexture of iterative decoding [D]. Shanghai: Shanghai Jiao tong University Press, 1999.
[3] Guang-yu Chen. New design method of RF vector network analyzer [J], foreign electronic measurement technology, 2001.
[4]Agilent Technologies. User's and Programmer's Reference, Volume 1 Core Specturm Analyzer Functions and ESA Series Spectrum Analyzers. April 2004.
[5] Lu-lin Zhang. Bluetooth protocol and its implementation [M]. Beijing: electronic industry press, 2001
[6] Jun-hua Liu. Design of modern detection technology and test system [M]. Xi’an: xi’an jiaotong university press, 1999.
[7] Chun Zuo, Fan Jiang. An improved bluetooth device discovery process and simulation [J]. Computer simulation, 2007, (05):94-97.
[8] Drula C, Amza C, Rousseau F, et al. Adaptive energy conserving algorithms for neighbor discovery in opportunistic Bluetooth networks[J]. IEEE Journal on Selected Areas in Communications, 2007, 25(1):96-107.