ISBN: 978-1-60595-504-9
Theoretical and Experimental Study of Ultra-smooth
Surface Based on Gaussian Topography
YUMING ZHU
ABSTRACT
All natural surface heights conform to the law of Gaussian distribution. Thanks to this law, researchers can measure the topography of different surfaces. To function, modern precision optical instruments need extremely smooth surfaces whose RMS is usually controlled under 0.5nm. A Surface that meets this condition is called ‘Ultra smooth Surface.’ Researchers normally use X-ray reflectance test, Atomic Force Microscope (AFM) scanning and Contour scanning when they characterize smooth surfaces. However, not all the optimal conditions of the research instruments can be met in real experiments. Hence, when scientists want to measure ultra-smooth surfaces, results of these methods are often limited. Furthermore, important statistics such as the fractal index and the lateral correlation length cannot be obtained, and redesigning the current measurement devices doesn’t help much to increase accuracy. X-ray scattering not only empowers scientists with scattering models that determine the surface roughness of a given object, but also offers a PSD curve that functions on a wider spectrum. In this experiment, I put two 15mm*15mm silicon chips on the X-ray scattering device, used the glancing incidence of 0.1 degrees and 0.15 degrees respectively, and analyzed the data. Data from the Detecting Scan is analyzed by the First Order Vector Perturbation theory, and a Power Spectrum Density (PSD) is obtained. Adding on to that the Global Optimization Algorithm—Simulate Anneal Arithmetic, the PSD function is fully fitted, Thus, the surface roughness sigma, the fractal index h, and the lateral correlation length, a, is obtained. Comparing the PSD function of X-ray scattering with results obtained by the Atomic Force Microscope and Contour scanning, this project proved the validity and strength of using the new method of X-ray scattering to measure surface roughness.
INTRODUCTION
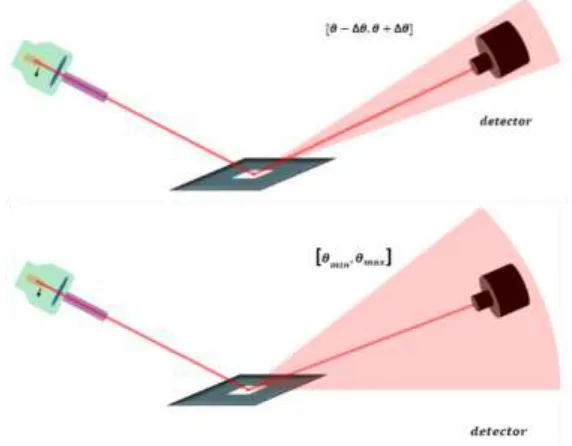
The methods to characterize ultra-smooth surfaces are vital for modern optics. The stability and isotropy of silicon chip makes it easy to be experimented, and thus an optimal choice for characterization. The approximate average surface roughness of ultra-smooth silicon chips is 0.1nm to 1nm, too small that it cannot be measured by visible-light interference. The only method that satisfies high sensitivity, high accuracy and large view is using short-wave X-rays that falls into the same order of magnitude with surface height.
__________________________________
Figure 1. Up: Rocking Scan. Down: Detecting Scan.
The research project uses specialized copper Kα X-ray that has a wavelength of λ=0.154nm. Since the subject is surface roughness, this project selects the method of X-ray scattering, and validates the result with AFM and contour scanning.
Since the X-ray has a short wavelength and carries high energy, the reflectance of X-ray is low. Thus, the angle of total reflection is small. At glancing incidence, this experiment collects the information of the electro-magnetic wave resulted from the interference of X-ray and target subject. In this project, I created a statistics model of surface roughness according to Born Assimilation, derived the correlation function of the difference of surface height, and fitted the data to deduce the surface parameters. By using the method of detecting scan and processing the data with Fourier transformation, the correlation between the following statistics: surface roughness 𝜎𝑟, fractal index h, horizontal correlation length 𝜉∥ is found.
THEORIES
Fractal Theory
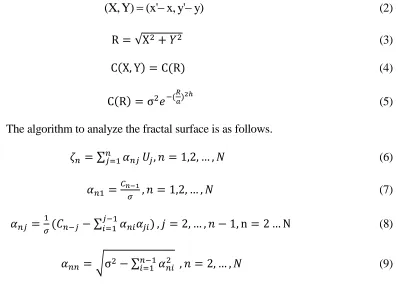
In 1973, Mandelbrot first proposed the concept of fraction. The character of fraction means that a part of the figure resembles the entire figure. In this project, fraction is used to describe the surface height of an ultra-smooth surface. Since the surface of the silicon has self-similarity, the fraction index is an important parameter of surface topology. The fractal theory provides the analysis part of the experiment with a more accurate result. In 1988, Sinha established the theory of X-ray and neutron scattering. To calculate the X-ray diffuse scattering, a statistic model must be established according to the surface or interface. The correlation function of a single surface or interface is as follows.
2 2
(X, Y) (x' x, y' y) (2)
R = √X2+ 𝑌2 (3)
C(X, Y) = C(R) (4)
C(R) = σ2𝑒−( 𝑅 𝑎)
2ℎ
(5)
The algorithm to analyze the fractal surface is as follows.
𝜁𝑛 = ∑𝑛𝑗=1𝛼𝑛𝑗𝑈𝑗, 𝑛 = 1,2, … , 𝑁 (6)
𝛼𝑛1 =𝐶𝑛−1
𝜎 , 𝑛 = 1,2, … , 𝑁 (7)
𝛼𝑛𝑗 = 1
𝜎(𝐶𝑛−𝑗− ∑ 𝛼𝑛𝑖𝛼𝑗𝑖) 𝑗−1
𝑖=1 , 𝑗 = 2, … , 𝑛 − 1, n = 2 … N (8)
𝛼𝑛𝑛= √σ2− ∑ 𝛼 𝑛𝑖2 𝑛−1
𝑖=1 , 𝑛 = 2, … , 𝑁 (9)
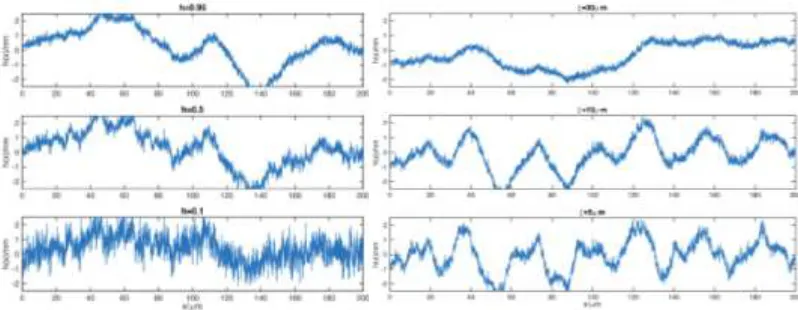
[image:3.612.107.505.54.340.2]This essay simulates 2000 points that conforms to a standard distribution with a standard deviation of 1. Figure 2 shows the simulation results of how fractal index (Left: σ=1nm, a=20μm, N=2000, L=200μm, ∆X=L/N=10nm) influences the surface roughness and how horizontal correlation length (Right: σ=1nm, h=0.95, N=2000, L=200μm, ∆X=L/N=10nm) influences the surface roughness.
TABLE I. DESCRIPTION OF SYMBOLS.
Symbol Description Symbol Description
σ surface height
𝑈𝑗
random numbers that conform to
standard distribution
a lateral correlation
length
ℎ fractal index C(R) Self-correlation
function
R random distance
between points 𝜁𝑛
Figure 2. Left: Different Fractal Index. Right: Different Horizontal Correlation Length.
X-ray Scattering Theory
Measuring the light distribution of X-ray scattered from rough surfaces, the X-ray scattering method obtains the surface statistics without directly touching the sample. X-ray scattering not only scans fast, but also measures fine details of both the surface and the interior of the sample. In addition, it measures a large surface area. The scattering formula is as follows.
2 2 0 ( ) 1 1 ( , ) sin s i A q dQ
Q d d r
(10)2 2 2 Re( ) ( ) ( ) 2 2
( ) [ 1]
z
y z
q
iq r q c r
s z e
A q d r e e
q
(11)First-order Vector Perturbation Theory (FOVPT)
The afore-mentioned scalar quantity can only be applied in the condition of glancing incidence, and cannot obtain the surface height information. The first order vector perturbation theory can obtain the PSD information of the target surface. In the process of characterization of the roughness statistics of optical instruments, the PSD function is the most perceptual expression. When ϕ = 0, the FOVPT can be expressed as follows.
2 2
3
0
1
0 0 0
1 ( ) ( ) 1
( ) ( )
16 sin cos cos
scatt
D
k t t
dW PSD p W d
(12)
0 1
cos cos
p
2
2sin ( )
sin cos
t
[image:5.612.96.498.57.191.2] (14)
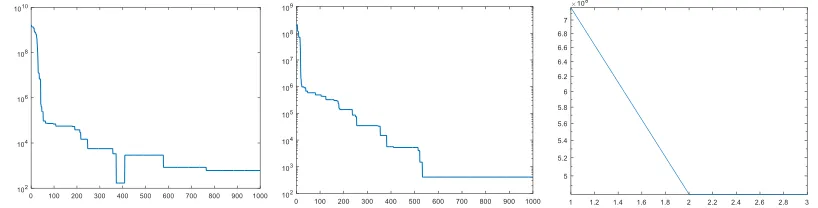
Figure 3. Simulation Results at Different T. Left: Y=14.991X2+8.644X+0.887 at T=1000. Middle: Y=14.989X2+8.492X+7.344 at T=100. Right: Y=15.024X2+9.438X+3.805 at T=10.
Figure 4. Simulation Results at Different a1. Left: a1=0.99. Middle: a1=0.95. Right: a1=0.97.
2
(1 i )
(15)
2
1 1
2 2 2
1 ( )
2 2
( )
( )
(1 )
D
h h
a
PSD p
h
a p
(16)
Simulated Annealing Algorithm (SAA)
The Simulated Annealing Algorithm is a heuristic optimization algorithm. Conforming to the Metropolis criterion, a procedure that uses the afore-mentioned algorithm first set up a target function M analogical to the intrinsic energy E initially found in the object awaiting to be annealed. Meanwhile, the temperature T is simulated by the control parameter a1. The SAA solves the problem with seven steps.
The initial temperature of the SAA determines how the probability of finding the optimal solution. Figure 3 shows the simulation results of a 3-parameter quadrilateral polynomial using different SAA parameters.
Left: T=1000; T0=0.01; a1=0.95; maxstep=1000; L=100; Middle: T=100; T0=0.01; a1=0.95; maxstep=1000; L=100; Right: T=10; T0=0.01; a1=0.95; maxstep=1000; L=100;
[image:5.612.90.499.244.348.2]The control parameter a1 is the most important parameter (see Figure 4). If a1 is too close to 1, the optimal choice will likely be eliminated. If a1 is too small, finding the optimal choice will be too long.
EXPERIMENTS
AFM Results
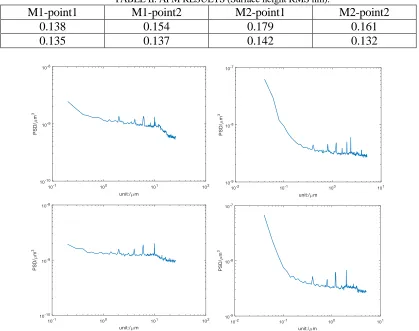
[image:6.612.89.508.254.585.2]AFM uses the interaction force between atoms to measure the probe and the object. Hence, the surface height can be measured. AFM forms its image by three methods: contact, non-contact, and tapping. In this project, tapping mode is utilized to measure the surface roughness. Samples: two 15mm*15mm square silicon chips (M1 and M2).
TABLE II. AFM RESULTS (Surface height RMS nm).
M1-point1 M1-point2 M2-point1 M2-point2
0.138 0.154 0.179 0.161
0.135 0.137 0.142 0.132
X-ray Scattering Results
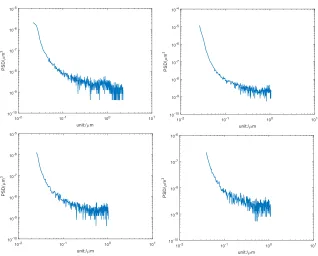
Figure 6. PSD Curves of X-ray Scattering Results (Upper Left: M1-0.1deg, Upper Right: M1-0.15deg, Lower Left: M2-0.1deg, Lower Right: M2-0.15deg).
TABLE III. WHITE LIGHT INTERFEROMETRY RESULTS (Surface height RMS nm).
Surface roughness under 10×
Surface roughness under 50×
M-1
Area 1 0.51 0.31
Area 2 0.57 0.30
Area 3 0.51 0.47
M-2
Area 1 0.49 0.33
Area 2 0.54 0.32
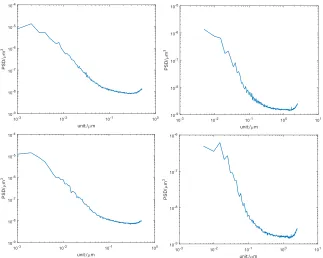
[image:7.612.95.506.379.508.2]Figure 7. PSD Curves of White Light Interferometry Results (Upper Left: 10nm, Upper Right: M1-50nm, Lower Left: M2-10nm, Lower Right: M2-50nm).
White Light Interferometry Results
The contour scanning device uses interference pattern to obtain the entire 3-dimensional morphology data. Since the contour scanning device cannot obtain extremely accurate data, it can only be utilized to validate the X-ray scattering device.
Comparison of Results
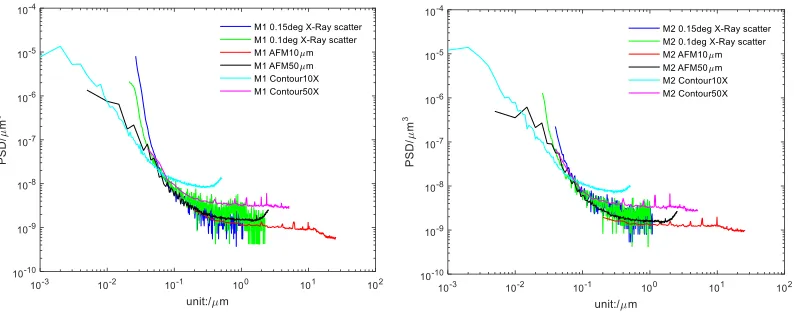
Putting all the afore-mentioned experimental data on a single figure, the different data of chip M1 is compared. The ten times Contour Scanner stands out at the outlier because the PSD function from 10-3 to 5×10⁻² dissatisfies theoretical condition. In the right part of the data, all measurement methods except X-ray scattering appears to be smooth. This is largely because of the white noise in the data. X-ray scattering tends to perform well on all frequencies.
Figure 8. Comparison of Results (Left: M1, Right: M2).
TABLE IV. DATA FITTING RESULTS.
M1(0.1) M1(0.15) M2(0.1) M2(0.15)
Fraction index 0.686 0.646 0.603 0.589
Surface height(nm) 0.135 0.145 0.189 0.197
Lateral correlation length(nm) 131.875 281.983 258.861 270.654
Data Fitting Using Annealing Algorithm
See Table IV.
CONCLUSION & DISCUSSION
The independent variable p falls between 0.01-10/μm.
1
2 12 2 2
1
2 2 2 2 2 2
1
( )
2 2
log ( ) log
( )
(1 )
1
( )
2 2 1
log * log((1 ) ) 1 ( ) *log(1 )
( ) 2
D h h h a PSD p h a p h
a a p C h a p
h (17)
Since h appears on the exponential term, it is the crucial parameter in the simulation. Its fit is the closest to the real value. The other important factor, σ, also falls between 0.09±0.01nm. Although this result has a maximum of 7.4% margin of error, it is already much more accurate than the 1nm range of Contour scanning devices. Meanwhile, the greatest margin of error appears on the horizontal correlation parameter M1. This is because M1 shows the periodicity of surface fluctuation. Therefore, it is normal that this parameter fluctuates, as long as it is in the same order.
along with Simulated Anneal Algorithm, supersedes Contour Scanning and AFM on both accuracy and stability.
REFERENCES
1. Sinha S, Sirota E, Garoff S, et al. X-ray and neutron scattering from rough surfaces. Physical Review B, 1988, 38(4): 2297. [2].
2. De Boer D. X-ray reflection and transmission by rough surfaces. Physical Review B, 1995, 51(8): 5297.
3. de Boer D K. X-ray scattering and x-ray fluorescence from materials with rough interfaces. Physical Review B, 1996, 53(10): 6048.
4. Stearns D. X‐ray scattering from interfacial roughness in multilayer structures. J Appl Phys, 1992, 71(9): 4286-4298.
5. Gu T, Goldman A, Mao M. Characterization of interfacial roughness in Co/Cu multilayers by x-ray scattering. Physical Review B, 1997, 56(11): 6474.
6. Kozhevnikov I V, Pyatakhin M V. Use of DWBA and perturbation theory in X-ray control of the surface roughness. Journal of X-ray science and technology, 1998, 8(4): 253-275.
7. Holy V, Kubena J, Ohli I, et al. X-ray reflection from rough layered systems. Physical review B, 1993, 47(23): 15896.
8. Sinha S K. X-ray diffuse scattering as a probe for thin film and interface structure. Journal De Physique Iii, 1994, 4(9): 1543-1557.
9. Salditt T, Lott D, Metzger T, et al. Interfacial roughness and related growth mechanisms in sputtered W/Si multilayers. Physical Review B, 1996, 54(8): 5860.
10. Bajt S, Stearns D G, Kearney P A. Investigation of the amorphous- to-crystalline transition in Mo/Si multilayers. J Appl Phys, 2001, 90(2): 1017-1025. [11]
11. Yulin S, Feigl T, Kuhlmann T, et al. Interlayer transition zones in Mo/Si superlattices. J Appl Phys, 2002, 92(3): 1216-1220.
12. Mandelbrot B B, Pignoni R. The fractal geometry of nature[M]. New York: WH freeman, 1983. 13. Salditt T, Metzger T H, Brandt C, et al. Determination of the static scaling exponent of self-affine