2017 International Conference on Computer, Electronics and Communication Engineering (CECE 2017) ISBN: 978-1-60595-476-9
Morphology-based Train Compartment Number Extraction
Dun ZHOU and Hai-fang ZHOU
College of Computer, National University of Defense Technology, Changsha 410073, China
Keywords: Image processing, Morphology, LPR, Train number extraction.
Abstract. A morphology-based train compartment number extraction algorithm was introduced to provide an accurate and effect service to subsequent recognition process. First, a preprocess which included gray-scale transformation, image normalization, morphological closing operation filter, OTSU threshold segmentation was applied to the input image. Second, an extraction process to train number followed, which included a coarse character selection scheme, a union-find-based characters cluster method and a fine characters selection procedure, to form train number region candidates. To the end, a train number recovery algorithm was proposed to recover the boundary of the candidate with left-expansion and right-expansion so that all missed train number characters could be recovered. In this paper, the proposed was applied to 100 train carriage images for testing. The experiment results show that the proposed algorithm is robust and is adaptable to the illumination conditions, train number position, tilt, background and font, and 95% recognition ratio is achieved, which improves much the validity of recognition process.
Introduction
statistical analysis, hierarchical-based license plate location, and morphology-based license plate extraction. Similarly, mathematical morphology-based operators were also applied in [6,8], instead of taking advantage of the car-plate edge features straight, they localized the car-plate by Hough line detection precisely. However, they did not take the effect of light and the tilt to detection into consideration, and the whole extraction process relied on the inherent rectangular characteristics of car-plate. Different from that above, the algorithm proposed in this paper took into account the illumination condition, tilt and font, without using the prior knowledge. Firstly, a preprocess which included gray-level conversion to convert the original RGB image to gray image, and a local normalization process to eliminate the influence of illumination, is applied on the raw image. After that, mathematical morphology-based operation are applied. The threshold segmentation process is done by OTSU global threshold method. Then, the analysis of connected components could be carried out to get the train number character candidate regions. Candidate regions then are filtered through a coarse character selection scheme to filter regions too large or too small out. To effectively form the train number region, the regions that remained go through a clustering process by union-find set operation after defining a similarity principle such that the regions which had similar height, positioned in approximately similar y-direction position allowing a bias of ±10°and close tightly in x-direction can be classified into the same category. And, the regions which overlapped each other in same category should be merged into one region. Finally, the category that has the most number of characters is selected as the train numbers candidate area. Due to the impact of noise, the number area could be segmented into different regions, a train number recovery algorithm is proposed to recover the boundary of the candidate with left-expansion and right-expansion so that all missed train number characters can be recovered and formed the final train number region. The experimental results showed that the proposed algorithm was robust to and was adaptable to the different illumination conditions, train number positions, skew, background and font, without using prior knowledge such as the license plate shape, color and texture characteristics which provided a good input for train number identification system, and guaranteed the effectiveness of recognition, and effectively improved the train number recognition accuracy.
The rest of this paper is organized as follows. In the next section, the flowchart of the proposed method is first illustrated. The details of preprocess which including gray-level conversion, local standardization, morphology filtering, Otsu threshold segmentation and connected component analysis are described in sect .3. The sect. 4 introduces the train number region extraction process, and the details of the train number recovery are discussed in sect. 5. Sect. 6 reports the experimental results. Finally a conclusion will be presented in sect. 7.
Figure 1. Flowchart of the proposed system.
Overview of the Proposed Algorithm
adjacent regions which have similar character features such similar height, similar aspect ratio and so on can be classified into one same train number line. Finally, due to noise, there are some false positive number character regions which should be excluded. Specifically, the regions which actually belong to same character candidate region with the relationship of including or intersection should be merged into one region. Usually, the train number region possess the maximum number of characters, and according to this characteristic, a candidate train number can be extracted. Meanwhile, the region can be adjusted by the slope of the straight line fitted by means of the character region center points. Despite this, a train number region may be segmented into different regions because of noises, and a train number recovery stage is introduced to recovery the whole train number.
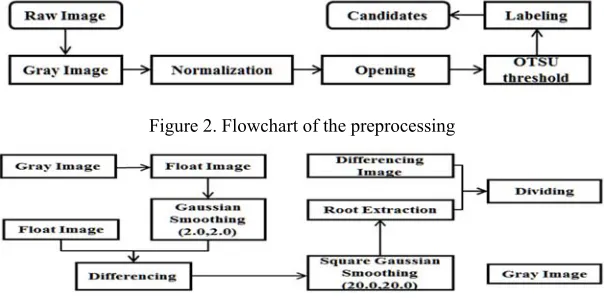
Figure 2. Flowchart of the preprocessing
Figure 3. Flowchart of normalization.
Preprocess
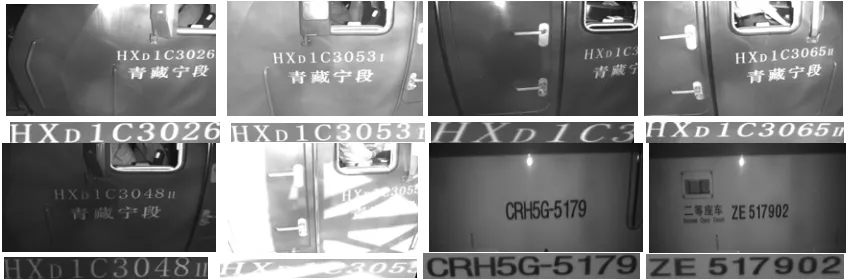
The purpose of the image preprocessing is to reduce the interference of noise and provide a good basis for the subsequent processing, and it has a great impact on the follow-up train number region extraction. The flowchart of preprocessing is illustrated in Figure 2. First the raw input RGB image (as shown in Figure 4a and Figure 4b) is converted into gray-level image. Out of the fact that it can perform poorly for the segmentation in next step in case of the images apper too bright or too dim locally due to the uneven illumination, it is necessary to remove such noise interference to improve the accuracy of the segmentation. In data analysis, it is usually preferable to normalizing the data to eliminate the impact of dimension or reducing the interference of the outliers. The most commonly standard method adopted is z-score zero mean normalization, whose formal formula is shown in Eq. 1.
x
‘ x
processing. In what follows is the bianrization operation, which usually is based on the mathematical morphological filter.
[image:4.612.94.512.100.180.2]
a b c d Figure 4. Result of processing, a and b are raw images, c and d are preprocessing results.
Mathematical morphological closing operation which can narrow the gap and fill the small hole consists of two basic morphological operations, that are dilation operation and erosion operation. In general, according to the different object to operate on, there are two kinds of morphological operations, namely, operations on binary images and operations on gray-level images. Assuming that F is denoted as the raw image, S is the structure element which is defined in domain Ds. , represent dilation operation and erosion operation respectively. In addition, is denoted as closing operation. The formal definitions are described as follows:
Gray-level dilation operation:
} ) , ( | ) , ( ) , ( max{ ) , )( ' ' ' ' ' ' S D y x y x S y y x x F y x S
F
( . (2)
Gray-level erosion operation:
} ) , ( | ) , ( ) , ( { in ) , )( ' ' ' ' ' ' S D y x y x S y y x x F m y x S
F
( . (3)
Gray-level closing operation:
S S F y x S
F )( , )( )
( . (4)
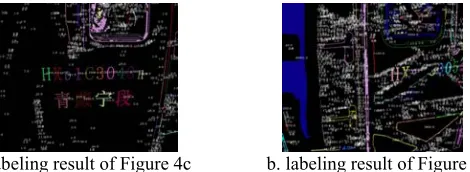
Actually, the structural element can be regarded as a special kind of gray-level morphological structure element with a height of zero when a morphological operation is applied on binary image. In this paper, all morphological operation is imposed on gray image. To be specific, a morphological closing operation with its size of 7 * 7 is applied to smooth the gap and fill the holes, and Otsu threshold segmentation follows. Because of its simplicity and stability, Otsu is widely used as a method of global threshold segmentation. By the definition of intra-class variance and between-classes variance, the optimization can be done by means of minimizing the intra-class variance and maximizing the between-classes variance to obtain the optimal global threshold for segmentation. A morphological closing operation which is the same as before is again applied to smooth the narrow gap and fill the small holes. The results of morphological operation and threshold segmentation are illustrated in Figure 4c and Figure 4d. As shown in Figure 4, the image segmented with OTSU has a large number of connected regions, so the opencv library is used to label every conncected component(as shown in Figure 5,random color and number reprensent different regions).
[image:4.612.191.426.598.684.2]
Train Number Extraction
The last section illustrates the details of preprocessing which produce a large number of candidate character regions including many false positive candidates. In order to extract the whole train number region, this pseudo character regions need to be effectively filtered out. According to the train carriage number characters features such as aspect ratio, pixel density, character area and the area of the minimum bounding rectangular, a coarsely selection and filtering process is proposed to remove the false positives coarsely in this section. Assume that is candidate region, the width and height of is denoted as . and . respectively. In addition, . denotes the area of
which presents the number of no-zero pixels. The . ⁄ . ∗ . denotes the density of . The principles of filtering include mainly three rules as follows.
Rule 1: the aspect ratio of , AspectRatio = max . ⁄ . , . ⁄ . , if has too small or too large AspectRatio , it should be filtered out. Under this condition, the reasonable range of AspectRatio for a candidate character region is [0.25,10] by rule of thumb, which makes the long and narrow false positives to be screened.
Rules 2: should be larger than 0.1.
Rule 3: . should not be less than 30 pixel, and should not be grater 7500 pixel
A coarsely selection is applied on the candidates extracted based on the three rules, the result is illustrated in Figure 6, which shows all the connected components remained in original image. It can be seen from the results that the coarse filter process excludes most of the pseudo character regions, but there are still a small number of false positives that cannot be excluded.
In order to effectively locate the complete candidate number region, the regions that belong to the same line need to be clustered to form the final train number region. It can be seen in Figure 6 that train carriages have single background and the train numbers usually have similar height, similar width and the center points align approximately in the same line. So, five similarity criteria are proposed to classify the candidates. Assume that HeightRatio max . ⁄ . , . ⁄ . denotes similarity of heights. In addition,
. and . denotes the center point of and respectively. If two regions and were similar, they should meet the first 4 of 5 rules or the last rule as follow:
Rule 1:Heights should be similar. HeightRatio should be less than 3 in this paper. Rule 2:The slope of the line connecting . and . belongs to [-10, 10]. Rule 3:There should have an intersection if both region and are projected into y axis. Rule 4: and position nearly.
Rule 5: If and intersect, they are similar.
The union-find set is a very sophisticated and practical data structure, which is mainly used to solve the problem of merging some disjoin sets, such as the problem of minimum spanning tree of the Kruskal algorithm, connected subgraph and the recent public ancestors, etc.. Assume there are disjoin sets , , … , , ∀ ∈ , ∈ 1, , and ∈ ,any element in a set can represent the set,∀ ∈ , ∈ , if and are similar, and should be merged into one set. As shown in Figure 7, at the beginning, there are eight sets each set includes one element, input – denotes that , are similar so as to the set belongs to and the set belongs to should be merged into one set. For instance, to input 3–2, 6–7,3–6,4–8 can divide 8 elements into 4 categories, that is 1 and 5 belongs to two sets separately, and 2 ,3 ,6 as well as 7 are classified into one set, besides, 4 and 8 belong to the same set.
In this paper, the union-find set is applied on the basis of five similarity rules defined above for clustering the candidate character regions (red rectangle as showed in Figure 6) coarsely selected. Assuming that there remain candidate character regions, of which 1 2⁄ pairs are taken into account to determine whether they should merge or not. In what follows, the details of train number characters cluster algorithm is described.
Step 1: Initialize the union-find set unionFindSet = , , … , , among which , 1,2, … contains one candidate character region.
Step 2: for each , , 1,2, … , 1, if and are similar under the condition of five rules defined above and do not belong to the same set, merger takes place among and .
The result of clustering in Figure 6 are shown in Figure 8, in which the number that centers rectangle represents the label of the set. As we can see that in Figure 8a, there are six sets labeled by numbers 1,2,3,4,5,6 separately, and the set labeled by 1 consists of 11 candidate character regions. In Figure 8b, fourteen candidates are classified into eight sets, and the set labeled by 3 contains 7 candidates.
[image:6.612.155.458.186.574.2]
a. Clustering result b. Clustering result Figure 6. The result of coarse selection.
Figure 7. The procedure of union-find set.
a b Figure 8. The result of cluster by union-find set.
Figure 9. The result of slant correction.
is fitted through least square method. Correction happens when the slope of the straight line is out of range [-10, 10]. The result of slant correct is shown in figure 9. But, the “train number plate” obtained is not complete, some regions are missed. In next section, a “train number plate” recovery algorithm is described in details.
Train Number Recovery
On the last section, the candidate “train number plate” is extracted through the character region selection and clustering. In addition, a possible slant correction may happens. However, due to noise (such as illumination conditions), it is possible for a “train number plate” to break into different segments as shown in Figure 9 which the last character region of the “train number plate” is missed. This paper propose a train number recovery algorithm to form an complete “train number plate”. Essentially, it is a process of left-expansion and right-expansion. During the left-expansion or right-expansion, if any suspect character region is found, expansion happens. The details is described as follows. Assume that the “train number plate” extracted in sect.3 is denoted as , which has the minimal bounding rectangular . . , . is the left-top coordinate of . represents the raw RGB input image. Firstly, a rectangular region image with the size of ( . , . ) is captured from , and . is the height of , while . is the column of . In addition , ⊆ , a preprocess similar to the sect. 2 is applied on , so a binary image is obtained. Besides, assume that the average train number character width can be acquired by prior knowledge. - image of can be computed. The details of the extension algorithm is described as follows:
Step 1: //left-expansion
Create a rectangular region from the left bounding of , . max 0, . 2 ∗
, . . , . 2 ∗ , . . . It should
be noted that when . is equal to 0, the width of can’t reach 2 ∗ . It should be adjusted to . . .
Step 2: - projection of should be calculated according to .
Step 3:Check whether there is an isolated character in under the order of the right to left. If a character exists, assuming that its left-bounding is , right-bounding is . Left expansion is carried out according to . . , . , and go to step 1; otherwise, go to step 4.
Step 4: //right-expansion
Create a rectangular region from the right bounding of , r. x Rect. x Rect. width 1, . . . . 2 ∗ , . . .It should be noted that when the width of can’t reach 2 ∗ ,that is . . . 1 2 ∗
,some adjust should be made that is . . . . Step 5: - projection of should be calculated according to .
Step 6:Check whether there is an isolated character in under the order of the left to right. If a character exists, assuming that its left-bounding is , right-bounding is . Right expansion is carried out according to . . , go to step 4, otherwise, expansion is over.
Experimental Result
convenience of processing, a Gauss Pyramid down sampling is applied to make the images with the size of 640*250. The results of experiment are illustrated in Table 1. As we can see, the total accuracy is up to 95%. Under the poor lighting conditions, it has the worst-performance, which is because under the extremely strong lighting condition the train numbers can not be recognized even by human that only the part of train number can be extracted and can not carry out expansion algorithm. The proposed algorithm performan best when images are under normal condition. Some results of extraction are illustrated in Figure 10.
Table 1. Experiment data.
Conditions Total images No. of extracted numbers accuracy
Poor lighting 20 17 85%
normal 40 40 100%
skew 20 19 95%
CRH 20 19 95%
total 100 95 95%
When the lighting conditions are normal and there is no obvious tilt, when different degrees of tilt happens, and when illumination is poor, the algorithm performs well, as we can see in Figure 10 that the “train number plate” is not only extracted precisely, but also is corrected to be aligned horizontally. In order to further illustrate the effectiveness of the algorithm, 20 images taken from CRH train carriage side are tested. The last two images in Fig.10 shows the parts of results of the extraction. Clearly, no matter how the light conditions, degrees of tilt and background are, the proposed algorithm works well and is very robust.
Figure 10. Result of extraction.
Conclusion
[image:8.612.94.520.350.490.2]References
[1] Yang T., Zhang S.L. Approach of vehicle plate extraction based on HSV color space and SIFT feature [J]. Application Research of Computers, 2011, 28(10): 3937-3936.
[2] Guo J., Shi P.F. Color and texture analysis based vehicle license plate location [J]. Journal of Image & Graphics, 2002, 7(5): 472-476.
[3] Li G., Yuan R., Yang Z., et al. A Yellow License Plate Location Method Based on RGB Model of Color Image and Texture of Plate [C]// Digital Media and its Application in Museum & Heritages, Second Workshop on. IEEE Xplore, 2007: 42-46.
[4] Wang Y.X., Huang F.G., Han J.Y., et al. License Plate Location Based on Color Matches and Texture Feature [J]. Journal of Image & Graphics, 2009..
[5] Bai H., Liu C. A hybrid License Plate Extraction Method Based On Edge Statistics and Morphology [C]// International Conference on Pattern Recognition. IEEE Xplore, 2004: 831-834 Vol. 2.
[6] Zhou L., Liu Y. An Approach Based on Morphology for Car License Plate Extraction [J]. Computer Knowledge & Technology, 2007.
[7] Saha S., Basu S., Nasipuri M. License Plate Localization Using Vertical Edge Map and Hough Transform Based Technique [J]. 2012, 132: 649-656.
[8] Wang P., Di G., Liu Y. An Efficient Approach for Slant Correction of Vehicle Licenses Based on Hough Transform and Mathematics Morphology [C]// International Conference on Transportation Engineering. 2007: 1972-1977.