R E S E A R C H A R T I C L E
Open Access
Cortical thickness and emotion processing
in young adults with mild to moderate
depression: a preliminary study
Bernice A. Fonseka
1, Natalia Jaworska
1,2, Allegra Courtright
1, Frank P. MacMaster
1,3,4,5and Glenda M. MacQueen
1*Abstract
Background:Major depressive disorder (MDD) is a multifaceted illness involving cognitive, emotional, and structural brain changes; illness onset typically occurs in adolescence or young adulthood. Cortical thickness modulations may underlie, or accompany, functional brain activity changes in the prefrontal cortex (PFC) during emotional processing that tend to be observed in MDD.
Methods:Thirteen unmedicated young adults with mild to moderate MDD, aged 18–24, completed a facial expression Go/No Go task and underwent a magnetic resonance imaging (MRI) scan to assess cortical thickness. Cortical thickness and performance on the Go/No Go task was also assessed in age-matched healthy comparison subjects (HCs;N= 14).
Results:Participants with depression had thicker left pars opercularis cortices than HCs. They also exhibited
impaired response inhibition to neutral faces when responding only to sad faces, and a faster response time overall. Conclusions:Though our sample size is limited, this pilot study nevertheless provides evidence for cortical
thickening in left frontal brain regions in a non-severely depressed, young adult group compared to healthy controls. There was also evidence of disturbances in emotion processing in this group.
Keywords:Major depressive disorder, Cortical thickness, Emotion processing, Adolescents/young adults
Background
Major depressive disorder (MDD) is a prevalent and multi-faceted illness involving both cognitive and emo-tional symptoms, among others [1]. Illness onset typic-ally occurs during adolescence and early adulthood [2], and psychiatric morbidity during this critical neurodeve-lopmental period can adversely impact education, occu-pational outcomes, and relationships [3]. From a treatment and prevention perspective, understanding MDD in its early stages is highly valuable; however, the neurobiological and behavioural profile of the disorder in younger populations is not well characterized. Two features of interest are cortical thickness, a brain mor-phometric measure, and emotion processing, which is
highly relevant to the cognitive and social aspects of MDD.
Cortical thickness & MDD
Across all ages, potential cortical thickness modulations in MDD are relatively under-explored despite the possi-bility that these could serve as diagnostic markers, or as targets for therapeutic intervention. Much of the existing literature on cortical thickness has focused on late-life MDD (>60 years of age). These studies generally show no differences between MDD and healthy control groups (e.g., [4, 5]), or cortical thinning in frontal and para/post-central regions as well as the cuneus/isthmus in MDD patients [6–8].
A handful of studies have assessed cortical thickness patterns in depressed non-elderly adults (<60 years of age). For example, one study found cortical thickness re-ductions in the dorsal and ventrolateral prefrontal corti-ces (PFC) in actively depressed subjects, compared to
* Correspondence:[email protected]
1
Mathison Centre for Mental Health Research & Education, Department of Psychiatry; Hotchkiss Brain Institute (HBI), University of Calgary, 7th Floor, Teaching, Research & Wellness (TRW) Building, 3280 Hospital Drive NW, Calgary, AB T2N 4Z6, Canada
Full list of author information is available at the end of the article
those in remission and controls [9]. Unexpectedly, mitted patients had increased thickness in several re-gions compared to controls, including the pregenual and subgenual anterior cingulate cortices, the anterior PFC, right inferior parietal lobule, and superior temporal gyrus. This could represent a trait marker related to re-mission, or reflect the consequences of effective pharma-cotherapy. Another group found that individuals with both early- (before 25) and late-onset MDD showed cor-tical thinning in the dorsolateral PFC (DLPFC) com-pared to non-depressed individuals [10]. However, the early-onset group also demonstrated thickening in some regions (posterior cingulate and fusiform gyrus), and thinning in others (parahippocampal gyri) when com-pared to the late-onset group. Jaworska et al. [11] re-ported thickening of the frontal poles in early onset MDD patients (before 24). In yet another study, Han et al. [12] reported no differences in cortical thickness be-tween first episode MDD participants and controls, al-though a volumetric reduction of the caudal anterior cingulate gyrus existed in patients. Overall, the spatial patterns of cortical thickness alterations in both elderly and non-elderly depressed adults remain unclear and factors such as childhood trauma, medication use, and age of disorder onset may play modulating roles.
Even less research has focused on cortical thickness in depressed children and adolescents. One study found that depressed children had reduced cortical thickness in parietal and temporal regions, yet increased thickness in the temporal poles [13]. Given the involvement of frontal regions/PFC in MDD [14], and based on some of the existing adult literature, Reynolds et al. [15] hypothe-sized that adolescents with MDD would show cortical thinning in the middle frontal gyrus (part of the DLPFC), but instead found thickening in this region and the anterior cingulate. In contrast, another study found that young adults with a family history of mood disor-ders had reduced cortical thickness in the right parahip-pocampal and fusiform gyrus [16]. As such, these conflicting results warrant further examination of cor-tical thickness in younger depressed cohorts, in whom the effects of prolonged disease burden and medication use can be minimized.
Emotion processing in MDD
Depression is associated with reduced accuracy in facial expression identification (e.g., [17]). People with depres-sion have been shown to exhibit a memory bias and en-hanced neural processing for sad faces and/or interpret neutral faces more negatively than non-depressed indi-viduals [18–20]. Disturbances in emotion processing cir-cuits involving cortico-limbic connections are generally thought to underlie these behavioural abnormalities [21].
One paradigm used to examine cognitive control of emotion processing is the emotive Go/No Go task. Typ-ically, participants respond to certain facial expressions (“Go” trials) embedded among infrequent non-target fa-cial expressions (“No Go” trials). This assesses an indi-vidual’s ability to recognize and respond to goal-relevant emotive stimuli, while withholding preponent responses to non-target expressions.
In a version of the task where participants responded to emotive words, two research groups showed that medicated and unmedicated depressed patients exhibited an attentional bias toward sad stimuli as reflected by fas-ter response times to sad versus happy targets [22, 23]. A subsequent facial expression Go/No Go study found comparable results, wherein depressed children and ado-lescents had faster reaction times to sad faces than con-trols [24]. However, a second facial expression Go/No Go study of depressed adolescents/young adults failed to find any reaction time differences compared with non-depressed controls, though faster reaction times to emo-tive faces in the MDD cohort were associated with greater depression symptom severity [25].
Although the neural processes associated with the Go/ No Go task are not well understood, response selection to non-emotive Go, and inhibition to No Go, stimuli has been associated with activity in the pre-supplementary motor area [26]. Additionally, Elliot et al. [27] reported that the inferior frontal gyrus and anterior/subgenual cingulate cortex are engaged when responding to targets of differing emotional valence. Emotion processing can be modulated by treatment since performance on an affective Go/No Go task improved following repetitive transcranial magnetic stimulation (rTMS) of the DLPFC in depressed patients [28]. As such, the Go/No Go task appears to involve largely frontal regions; though atten-tion and visual networks likely play a large role in task execution.
correlated with poorer performance on an emotion regu-lation task. These data suggest that attention, inhibition, and emotion processing may be related to cortical thick-ness, particularly in MDD. Assessing older adolescents and young adults with depression is particularly useful for isolating the early stages of the disease, as younger patients are less likely to have an extensive disease bur-den or medication load. This study therefore investigated cortical thickness and emotion processing using the fa-cial expression Go/No Go task in young adults with and without MDD. We hypothesized that compared to healthy controls, young adults with MDD would show cortical thickness disruptions in PFC regions, as well as impaired response inhibition to emotive stimuli on a fa-cial expression Go/No Go task.
Methods Participants
Study participants were young adults (18–24 years old) with MDD (N= 13) and non-depressed healthy controls (HCs, N= 14). Following an initial telephone screen, po-tentially eligible participants were invited for an in-person clinical assessment (Mini International Neuropsychiatric Interview [MINI]; [34]). The Hamilton Rating Scale for Depression (HAMD17; [35]) was administered to
deter-mine depression severity; eligible MDD participants had a minimum score of 14 (moderate severity). Those with scores of 8–13 (mild severity) or those with scores of >19 (severe MDD) were considered on a case-by-case basis. A primary MDD diagnosis was confirmed by the study psychiatrist (G.M.). All MDD patients were untreated (i.e., not taking antidepressant drugs or engaged in formal psy-chotherapy) at the time of testing (testing commenced after >1 month wash-out for previously-medicated partici-pants). Patients with severe depression were not actively recruited as they were more likely to be on some kind of antidepressant intervention, and it would have been un-ethical to ask them to stop. Seven patients had previously taken antidepressant medication for their MDD; the
number of previous major depressive episodes (MDE) ranged from 0 to 9 (average: 3.1 lifetime episodes, includ-ing current one), and age of first MDE onset ranged from 9 to 22 years of age (average: 15.3 years).
Notable exclusion criteria were: history of bipolar dis-order, psychosis, anorexia/bulimia or seizures; current substance abuse; and significant suicide risk. Written in-formed consent was obtained prior to study initiation and this study was approved by the Conjoint Health Research Ethics Board at the University of Calgary. As part of the informed consent process, participants agreed to the publication of the aggregated and anono-mized data that was collected.
Facial expression Go/No Go task
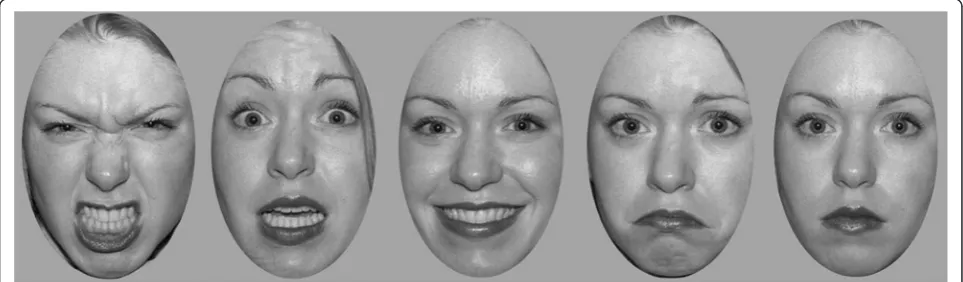
In our facial expression Go/No Go task [24], participants responded to frequent “Go” trials while withholding their preponent response to infrequent “No Go” trials. The stimuli consisted of faces depicting four emotions (anger, fear, happy, sad) and neutral expressions (adapted from the NimStim Face Stimulus Set; http://www.mac-brain.org/resources.htm). Faces were black and white photographs of young adult males and females (equal proportion; various ethnicities), not wearing glasses or makeup. The neck, hair, and ears were excluded (i.e., im-ages were presented in an oval-shaped mask; Fig. 1).
Stimuli were presented on a PC laptop using ePrime software (Psychology Software Tools, Pittsburgh, PA), and participants either had to respond (via a keyboard press) to a target emotion and not respond to neutral faces, or vice versa, yielding eight conditions (Anger/ Fear/Happy/Sad Go & Neutral No Go; Neutral Go & Anger/Fear/Happy/Sad No Go). In this paper, these con-ditions are referred to by the emotion only (e.g., Anger Go or Anger No Go). For each condition, there were 30 Go trials and 10 No Go trials (40 trials total). Faces were presented for 500 ms, followed by an inter-trial interval consisting of a variable length fixation cross, presented in the middle of the screen (900–1200 ms). The
[image:3.595.57.539.572.713.2]percentage of correct hits, false alarms (FA; response to a No Go trial) and mean response time (RT; ms) to hits were assessed for each of the eight conditions.
Structural MRI acquisition and cortical thickness analyses All neuroimaging was carried out with a General Electric Discovery 750 W 3 T scanner with a 24-channel head coil. A high-resolution T1-weighted anatomical scan in the axial orientation was obtained using the following parameters: repetition time (TR) = 8160 ms, time to echo (TE) = 3.16 ms, flip angle = 10°, 300 × 300 matrix, field of view (FOV) = 240 mm, 226 axial slices, and 0.8 mm slice thickness.
Cortical thickness analysis was conducted using FreeSur-fer software (http://surFreeSur-fer.nmr.mgh.harvard.edu). Briefly, brain images were corrected for intensity and contrast ir-regularities due to magnetic field inhomogeneities [36]. After an automated skull-stripping procedure, images were manually edited to remove remaining extra-cerebral voxels. In the segmentation step, the gray and white matter inter-face was determined based on intensity and geometric in-formation [36]. A triangular surface tessellation was then applied to each hemisphere, and smoothed using a deform-able surface algorithm [36]. The surface of each image was inflated to better visualize cortical folding patterns and sulci [37]. The inflated cortical surface was then trans-formed into a parameterizable surface [37] and aligned with a reference brain template [38]. Cortical thickness was calculated by taking the smallest distance between the pial surface and gray-white matter interface. FreeSurfer parcel-lates each hemisphere into 34 regions and derives an average thickness (mm) for each of these [39].
Statistical analyses
Group differences (MDD, HC) in HAMD17 scores, age,
and years of education were assessed using student’s t-tests. Sex ratio was assessed using a Chi-square analysis.
We divided our Go/No Go task analyses into two parts. The first dealt with “Emotion Go” conditions where emotional faces (anger, fear, happy or sad) were the Go and neutral faces the No Go conditions. The sec-ond dealt with “Emotion No Go” conditions where neutral faces were the Go trials and emotional faces the No Go trials. Repeated-measures analyses of variance (rmANOVAs; p< .05) were conducted for hits, FAs, and RT with group (MDD, HC) as the between-subjects fac-tor and emotion as the within-subjects facfac-tors for each of the “Emotion Go” and “Emotion No Go” analyses. Significance was set atp< .01 for all post hoc tests.
Cortical thicknesses were imported as average mm values from FreeSurfer into the Statistical Package for the Social Sciences (SPSS) software for Macintosh, Version 20 (IBM, Armonk, NY), which was used to carry out all statistical analyses. Student’s t-tests were used to assess for group dif-ferences in each of the 34 regions per hemisphere (p< .01).
Exploratory Spearman’s correlations (p< .001) were per-formed between cortical thickness of regions that tended to be (p< .05-.01) or were different (p< .01) between groups, and continuous clinical/demographic characteristics (i.e., age, education, HAMD17score) and Go/No Go outcomes.
Results
Participant characteristics
Demographics and clinical characteristics are presented in Table 1. One HC did not complete the emotive task. No group differences (MDD vs. HCs) existed in terms of sex ratio, age or years of education. As expected, MDD pa-tients had higher HAMD17scores than HCs [t(25)=9.89,
p< .001]. The main outcome measures for the affective Go/No Go task are presented in Table 2. Pairwise compari-sons, used to follow-up significant main effects of emotion, are presented in Table 3.
Go/No Go task performance
No main effects or interactions existed on hits in the Emo-tion Go analysis. However, there was a main effect of emo-tion on hits in the Emoemo-tion No Go analysis [F(3,72) = 6.10,
p= .001; Table 3]. Additionally, the MDD group tended to exhibit more hits than HCs in the Emotion No Go analysis [F(1,24) = 3.98,p= .06]. Assessment of the significant emo-tion × group interacemo-tion [F(3,72) = 3.85, p= .01] did not reveal any significant group differences, although MDD pa-tients tended to have more hits to neutral targets than HCs in the Happy No Go condition (p= .02).
[image:4.595.305.538.547.715.2]In terms of FAs, a main effect of emotion existed for the Emotion Go analysis [F(3,69) = 67.74, p< .001; Table 3]. A main effect of group was also found [F(1,23) = 14.74, p= .001], with patients having more FAs than HCs (i.e., responses to neutral faces). Follow-up of the significant emotion × group
Table 1Demographics and clinical characteristics of depressed (MDD) and healthy control (HC) groups
MDD (N= 13) HC (N= 14) Gender (M/F) 7/6 7/7 Age (yr) 21.5 ± 1.5 21.0 ± 1.8 Education (yr) 14.5 ± 1.7 15.0 ± 1.5 HAMD17score*** 15.3 ± 5.0 1.4 ± 1.6
Age of onset (yr) 15.6 ± 3.9 – Time since diagnosis (yr) 5.9 ± 3.8 – Ethnicity
% Caucasian 84.6 50.0 % Asian 15.4 21.4 % East Asian – 21.4 % Middle Eastern – 7.1
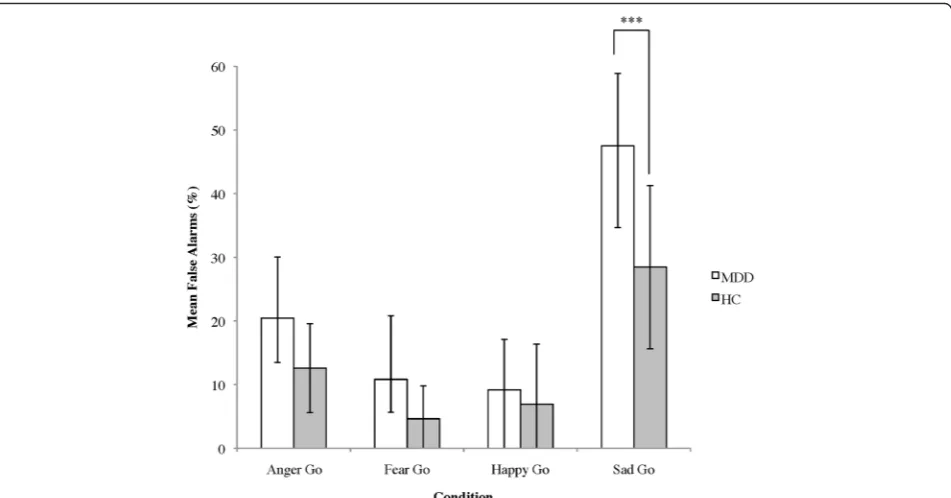
interaction [F(3,69) = 4.35, p= .007] indicated that MDD patients had more FAs than HCs in the Sad Go condition (p< .001; Fig. 2). Similarly, there were main effects of both emotion [F(3, 72) = 59.72, p < .001] and group [F(1, 24) = 7.44, p= .01] on FAs in Emotion No Go conditions (Table 3). MDD patients had nearly twice the number of Emotion No Go FAs as HCs, but no emotion × group interaction existed.
There was a main effect of emotion on RT in both the Emotion Go [F(3,69) = 4.02, p= .03] and Emotion No Go [F(3,72) = 3.76,p= .03] analyses (Table 3). Patients tended to have faster RTs than HCs [F(1,23) = 4.00, p= .06] in Emotion Go conditions; this was significant in the Emotion No Go analysis [F(1,24) = 6.65, p= .02]. No group × emotion interactions existed.
Cortical thickness
The MDD group had a thicker left pars opercularis com-pared to HCs, while eight other regions tended to exhibit greater cortical thickness in MDD patients [t(24) = 3.12,
p= .005; Table 4]. Exploratory Spearman correlations
were carried out between cortical thickness in the nine regions listed in Table 4 with Go/No Go outcomes. These were conducted across groups to maximize our ability to detect significant relations. Left pars opercu-laris cortex thickness was positively related to FAs in the Sad Go [ρ(23) = .72,p< .001] and Sad No Go condi-tions [ρ(23) = .63,p= .001]. Similarly, the left supramar-ginal cortex thickness was positively correlated with FAs in the Sad Go condition [ρ(23) = .61, p= .001]. When split by group, none of these were significant at
p< .001. Similar correlations between cortical thickness and continuous clinical/demographic characteristics yielded no significant results.
Discussion
[image:5.595.57.547.99.252.2]This pilot study investigated emotion processing and cortical thickness in young adults with MDD compared with non-depressed controls. Group differences in per-formance on the facial expression Go/No Go task were noted, particularly in FAs and RT. Patients tended to have thicker cortices in a number of brain regions. Table 2Main outcomes from the Go/No Go task for all eight conditions by diagnostic group
Mean Hits (%) Mean FA (%) Mean RT (ms)
Condition MDD (N= 13) HC (N= 13) MDD (N= 13) HC (N= 13) MDD (N= 13) HC (N= 13) Anger Go 96.6 ± 1.5 91.5 ± 17.2 20.5 ± 9.6 12.6 ± 7.0 378.0 ± 42.6 443.4 ± 118.6 Fear Go 95.8 ± 9.6 95.4 ± 10.1 10.8 ± 10.0 4.6 ± 5.2 411.0 ± 43.3 466.8 ± 100.7 Happy Go 98.9 ± 3.9 98.0 ± 3.5 9.2 ± 7.9 6.9 ± 9.5 379.0 ± 39.6 429.3 ± 111.9 Sad Go 95.6 ± 4.6 93.3 ± 7.2 47.5 ± 11.4 28.5 ± 12.8 436.4 ± 32.3 475.0 ± 106.6 Anger No Go 97.5 ± 5.3 93.3 ± 8.6 14.2 ± 6.7 11.5 ± 3.8 402.1 ± 40.6 474.0 ± 105.1 Fear No Go 93.9 ± 11.4 86.9 ± 13.2 13.3 ± 13.0 3.1 ± 4.8 419.7 ± 50.5 521.6 ± 140.1 Happy No Go 95.6 ± 8.6 80.3 ± 19.7 13.3 ± 13.0 3.1 ± 4.8 427.0 ± 67.7 484.1 ± 82.6 Sad No Go 89.7 ± 7.5 86.4 ± 11.1 44.2 ± 15.1 32.3 ± 14.8 450.3 ± 53.8 509.1 ± 93.9 All conditions 95.4 ± 6.3 90.6 ± 6.3 21.6 ± 6.3 13.1 ± 6.3 412.9 ± 67.0 475.4 ± 67.0
Means ± standard deviation presented
MDDdepressed group,HChealthy control group,FAfalse alarms,RTresponse time
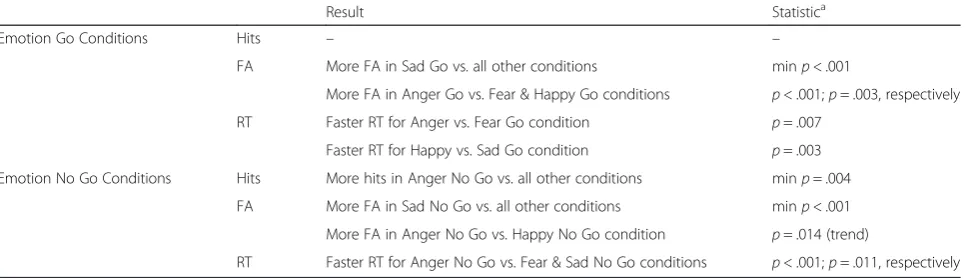
Table 3Pairwise comparisons between emotions from the Go/No Go task
Result Statistica
Emotion Go Conditions Hits – –
FA More FA in Sad Go vs. all other conditions minp< .001
More FA in Anger Go vs. Fear & Happy Go conditions p< .001;p= .003, respectively RT Faster RT for Anger vs. Fear Go condition p= .007
Faster RT for Happy vs. Sad Go condition p= .003 Emotion No Go Conditions Hits More hits in Anger No Go vs. all other conditions minp= .004
FA More FA in Sad No Go vs. all other conditions minp< .001 More FA in Anger No Go vs. Happy No Go condition p= .014 (trend)
RT Faster RT for Anger No Go vs. Fear & Sad No Go conditions p< .001;p= .011, respectively
FAfalse alarms,RTresponse time a
[image:5.595.58.542.576.715.2]Exploratory assessments yielded a handful of significant correlations between cortical thickness and Go/No Go performance outcome measures. However, these results have to be interpreted cautiously, given our small sample size. Nevertheless, there is some indication that cortical thickness in the left frontal and parietal lobes were re-lated to response inhibition under conditions involving sad stimuli.
Emotion processing
Depressed participants demonstrated a speed-accuracy trade-off in that they responded faster to emotional stimuli but had more FAs, especially in the Sad Go
condition, than healthy controls. The faster RT across conditions is unintuitive given that psychomotor retard-ation is a feature of depression [40]. Our findings are consistent, however, with previous work showing that faster RT in the facial expression Go/No Go task was as-sociated with depression in adolescents [24] and young adults [25]. Han et al. [25] speculated that faster RTs may be a product of emotional reactivity and reduced executive control. In support of this, Hare et al. [41] showed that emotional reactivity in adolescence (e.g., impaired response inhibition to emotive No Go stimuli) is related to enhanced amygdala activity combined with reduced top-down PFC regulation.
[image:6.595.62.538.87.336.2]Fig. 2False alarms from the facial expression Go/No Go task in emotion Go conditions. MDD: depressed group, HC: healthy control group. Values indicate the mean, error bars represent standard deviation, stars indicate significance (***p< .001)
Table 4Select regional cortical thickness values
Region Mean thickness (mm) Group comparison MDD (N= 13) HC (N= 14)
LH pars opercularis 2.61 ± .10 2.49 ± .10 t(24) = 3.12,p= .005 LH pars orbitalis 2.77 ± .18 2.60 ± .19 t(24) = 2.38,p= .026 LH pars triangularis 2.51 ± .11 2.41 ± .12 t(24) = 2.33,p= .029 LH precuneus 2.45 ± .80 2.38 ± .06 t(24) = 2.61,p= .015 LH rostral middle frontal 2.42 ± .09 2.32 ± .10 t(24) = 2.63,p= .015 LH supramarginal 2.52 ± .11 2.43 ± .08 t(24) = 2.41,p= .024 RH fusiform 2.76 ± .17 2.64 ± .11 t(24) = 2.30,p= .032 RH pars opercularis 2.62 ± .13 2.50 ± .11 t(24) = 2.49,p= .020 RH posterior cingulate 2.77 ± .10 2.65 ± .14 t(24) = 2.51,p= .020
[image:6.595.57.550.562.714.2]Increased FAs in depressed participants in the Sad Go condition is consistent with findings that MDD patients tend to interpret neutral faces more negatively than con-trols [42]; in other words, they tend to exhibit a negative cognitive bias [43]. However, another Go/No Go study in adult females revealed that depressed participants also had impaired response inhibition tonon-emotive stimuli (letters); this was attributed to compromised inhibitory control [17]. As such, disrupted executive/inhibitory control may have played some role in the elevated FAs evident in this study, and sad stimuli may have led to further perturbation of executive function, or induced a greater interaction between emotive and cognitive con-trol centers. These explanations are supported by an event-related potential [electroencephalography (EEG)-derived] study suggesting that healthy controls actively attend away from sad faces, while MDD patients fail to display the same inhibitory processes [44]. Other neuroimaging work has shown that depressed subjects have increased activation of the left parahippocampal gyrus and left amygdala in response to sad faces, compared with healthy individuals [18]. Biased emo-tional processing and altered inhibitory control may also contribute to some of the emotional and social features of the illness [45].
Across diagnostic groups, angry expressions seemed to elicit similar behavioural responses as sad expressions in terms of FAs. However, all participants generally responded to angry faces more rapidly than to sad ones. This increased emotional reactivity may be related to the evolutionary and ecological value of angry faces as threatening stimuli [46].
Cortical thickness
Participants with depression had a thickening of the left pars opercularis (orbital aspect of the inferior frontal gyrus) compared to HCs. A number of other left hemi-sphere structures, including the adjacent pars orbitalis and pars triangularis, and DLPFC regions also tended to be thicker in the MDD group. This is consistent with one study that reported thicker cortices in the nearby frontal poles of depressed adults with pediatric onset MDD [11]. The structural and functional maturation of the frontal lobe continues into early adulthood [47]; as such, our participant cohort was likely in a stage of ac-tive cortical development. Longitudinal imaging has pre-viously shown that cortical thickness in different brain regions follow different developmental curves – for ex-ample, thickness in most of the lateral frontal cortex peaks at adolescence, declines briefly, and stabilizes in adulthood [48]. It is possible that the thicker cortices in specific brain regions in MDD participants reflect a de-velopmental trajectory that is modulated by the presence of depression. These changes could also represent a
neurocompensatory response to MDD or perhaps result from previous treatment (though, at testing, participants were treatment-naïve).
Interestingly, the left inferior frontal gyrus has been im-plicated in response inhibition [49]; abnormalities in this region in MDD patients may be related to the heightened reactivity observed in the facial expression Go/No Go task. However, it is difficult to draw direct relations be-tween structural disturbances and cognitive performance, as our behavioural task likely recruited multiple brain re-gions and complex processing systems [41, 50, 51].
Limitations and future directions
Several study limitations should be acknowledged. The primary weakness is the relatively limited sample size, which also prevented the investigation of putative sex ef-fects. In terms of the facial expression Go/No Go task, our experiment did not explicitly investigate the functional correlates of emotion processing. Future studies should involve a functional imaging component to better under-stand how emotion processing differs in young adults with MDD. Further, assessing the influence of depression sever-ity on cortical thickness and emotional processing in a young adult cohort is warranted in comparable future work. Additionally, possible confounding effects of past medication or psychotherapy were not controlled for, and individuals in the age range we tested are in an active stage of brain development. These issues may have in-creased variability and made it especially difficult to detect any group differences in cortical thickness.
Conclusion
In summary, we examined emotion processing and cortical thickness in young adults with MDD. There was evidence for cortical thickening in left frontal brain regions in the MDD group, and a number of behavioral differences com-pared to HCs on a facial expression Go/No Go task, namely faster RTs and impaired response inhibition in MDD particularly in the context of sad expressions. Our results may reflect interactions of MDD with brain devel-opment in young adults, or represent a neurocompensa-tory response to MDD that occurs early in the disease.
The young adult age group has been largely under-explored with regard to depression, and this paper helps to characterize the neurobiological and behavioural pro-file of the disorder in younger populations.
Abbreviations
DLPFC:dorsolateral prefrontal cortex; EEG: electroencephalography; FA: false alarm; FOV: field of view; HAMD17: hamilton rating scale for depression
Competing interests
The authors declare that they have no competing interests.
Authors’contributions
GM, FM and NJ designed and oversaw the study. NJ and AC were responsible for data collection. BF analyzed and interpreted the data, and drafted the manuscript; NJ assisted with this process. GM oversaw all of the clinical assessments. All authors read and approved the final manuscript.
Acknowledgments
The authors would like to acknowledge Chris Gordon, Elisea de Somma, Mariko Sembo, and Chelsea Beyer for their contributions to the data acquisition process. We would also like to thank Dr. Lisa Marie Langevin, in particular, for her instruction in the cortical thickness analysis.
This study was funded by investigator-initiated funds. BF and NJ received student and post-doctoral funding, respectively, funding from Alberta-Innovates Health Solutions. FM received funding from the Cuthbertson and Fischer Chair in Paediatric Mental Health, Alberta Children’s Hospital Foundation, Canadian Foundation for Innovation, and the Hotchkiss Brain Institute.
Author details 1
Mathison Centre for Mental Health Research & Education, Department of Psychiatry; Hotchkiss Brain Institute (HBI), University of Calgary, 7th Floor, Teaching, Research & Wellness (TRW) Building, 3280 Hospital Drive NW, Calgary, AB T2N 4Z6, Canada.2Department of Psychiatry, McGill University,
Montreal, QC, Canada.3Child and Adolescent Imaging Research (CAIR) Program; Alberta Children’s Hospital Research Institute, University of Calgary, Calgary, AB, Canada.4Department of Paediatrics, University of Calgary,
Calgary, AB, Canada.5Strategic Clinical Network for Addictions and Mental
Health, Alberta Health Services, Calgary, Canada.
Received: 26 June 2015 Accepted: 12 February 2016
References
1. McClintock SM, Husain MM, Greer TL, Cullum CM. Association between depression severity and neurocognitive function in major depressive disorder: a review and synthesis. Neuropsychology. 2010;24(1):9–34. 2. Kessler RC, Amminger GP, Aguilar-Gaxiola S, Alonso J, Lee S, Ustün TB. Age
of onset of mental disorders: a review of recent literature. Curr Opin Psychiatry. 2007;20(4):359–64.
3. Birmaher B, Arbelaez C, Brent D. Course and outcome of child and adolescent major depressive disorder. Child Adol Psych Cl. 2002;11(3):619–37.
4. Koolschijn PCMP, van Haren NEM, Schnack HG, Janssen J, Hulshoff Pol HE, Kahn RS. Cortical thickness and voxel-based morphometry in depressed elderly. Eur Neuropsychopharmacol. 2010;20(6):398–404.
5. Colloby SJ, Firbank MJ, Vasudev A, Parry SW, Thomas AJ, O’Brien JT. Cortical thickness and VBM-DARTEL in late-life depression. J Affect Disord. 2011;133(1–2):158–64.
6. Mackin RS, Tosun D, Mueller SG, Lee JY, Insel P, Schuff N, et al. Patterns of reduced cortical thickness in late-life depression and relationship to psychotherapeutic response. Am J Geriatr Psychiatry. 2013;21(8):794–802. 7. Lim HK, Jung WS, Ahn KJ, Won WY, Hahn C, Lee SY, et al. Regional cortical
thickness and subcortical volume changes are associated with cognitive impairments in the drug-naive patients with late-onset depression. Neuropsychopharmacology. 2012;37(3):838–49.
8. Sheline YI, Disabato MDBM, Hranilovich MDJ, Morris C, Angelo GD, Carl PD, et al. Treatment course with antidepressant therapy in late life depression. Am J Psychiatry. 2012;169(11):1–15.
9. Salvadore G, Nugent AC, Lemaitre H, David A, Tinsley R, Cannon DM, et al. Prefrontal cortical abnormalities in currently depressed versus currently remitted patients with major depressive disorder. Neuroimage. 2011;54(4):2643–51. 10. Truong W, Minuzzi L, Soares CN, Frey BN, Evans AC, Macqueen GM, Hall
GBC. Changes in cortical thickness across the lifespan in major depressive disorder. Psychiatry Res. 2013;214(3):204–11.
11. Jaworska N, Macmaster FP, Gaxiola I, Cortese F. A preliminary study of the influence of age of onset and childhood trauma on cortical thickness in major depressive disorder. Biomed Res Int. 2014;2014:410472. 12. Han K-M, Choi S, Jung J, Na K-S, Yoon H-K, Lee M-S, Ham B-J. Cortical
thickness, cortical and subcortical volume, and white matter integrity in
patients with their first episode of major depression. J Affect Disord. 2014;155:42–8.
13. Fallucca E, Macmaster FP, Haddad J, Easter P, Dick R, May G, et al. Distinguishing between major depressive disorder and obsessive-compulsive disorder in children by measuring regional cortical thickness. Arch Gen Psychiatry. 2011;68(5):527–33.
14. Beauregard M, Paquette V, Lévesque J. Dysfunction in the neural circuitry of emotional self-regulation in major depressive disorder. Neuroreport. 2006;17(8):843–6.
15. Reynolds S, Carrey N, Jaworska N, Langevin LM, Yang X-R, Macmaster FP. Cortical thickness in youth with major depressive disorder. BMC Psychiatry. 2014;14:83.
16. Papmeyer M, Giles S, Sussmann JE, Kielty S, Stewart T, Lawrie SM, et al. Cortical thickness in individuals at high familial risk of mood disorders as they develop major depressive disorder. Biol Psychiatry. 2015;78(1):58–66. 17. Langenecker SA, Bieliauskas LA, Rapport LJ, Zubieta J-K, Wilde EA, Berent S.
Face emotion perception and executive functioning deficits in depression. J Clin Exp Neuropsychol. 2005;27(3):320–33.
18. Surguladze S, Brammer MJ, Keedwell P, Giampietro V, Young AW, Travis MJ, et al. A differential pattern of neural response toward sad versus happy facial expressions in major depressive disorder. Biol Psychiatry. 2005;57(3): 201–9.
19. Gollan JK, Pane HT, McCloskey MS, Coccaro EF. Identifying differences in biased affective information processing in major depression. Psychiatry Res. 2008;159(1–2):18–24.
20. Ridout N, Astell AJ, Reid IC, Glen T, O’Carroll RE. Memory bias for emotional facial expressions in major depression. Cogn Emot. 2003;17(1):101–22. 21. Leppänen JM. Emotional information processing in mood disorders: a review of behavioral and neuroimaging findings. Curr Opin Psychiatry. 2006;19:34–9.
22. Murphy FC, Sahakian BJ, Rubinsztein JS, Michael A, Rogers RD, Robbins TW, Paykel ES. Emotional bias and inhibitory control processes in mania and depression. Psychol Med. 1999;29:1307–21.
23. Erickson K, Drevets WC, Cannon DM, Bain EE, Zarate CA, Charney DS, Sahakian BJ. Mood-congruent bias in affective go/no-go performance of unmedicated patients with major depressive disorder. Am J Psychiatry. 2005;162(11):2171–3.
24. Ladouceur CD, Dahl RE, Williamson DE, Birmaher B, Axelson DA, Ryan ND, Casey B. J. Processing emotional facial expressions influences performance on a Go/NoGo task in pediatric anxiety and depression. J Child Psychol Psychiatry. 2006;47(11):1107–15.
25. Han G, Klimes-Dougan B, Jepsen S, Ballard K, Nelson M, Houri A, et al. Selective neurocognitive impairments in adolescents with major depressive disorder. J Adolesc. 2012;35(1):11–20.
26. Simmonds DJ, Pekar JJ, Mostofsky SH. Meta-analysis of Go/No-go tasks demonstrating that fMRI activation associated with response inhibition is task-dependent. Neuropsychologia. 2008;46(1):224–32.
27. Elliott R, Rubinsztein JS, Sahakian BJ, Dolan RJ. The neural basis of mood-congruent processing biases in depression. Arch Gen Psychiatry. 2002;59:597–604.
28. Bermpohl F, Fregni F, Boggio PS, Thut G, Northoff G, Otachi PTM, et al. Effect of low-frequency transcranial magnetic stimulation on an affective go/no-go task in patients with major depression: role of stimulation site and depression severity. Psychiatry Res. 2006;141(1):1–13.
29. Yuan P, Raz N. Prefrontal cortex and executive functions in healthy adults: a meta-analysis of structural neuroimaging studies. Neurosci Biobehav Rev. 2014;42:180–92.
30. Dickerson BC, Fenstermacher E, Salat DH, Wolk DA, Maguire RP, Desikan R, et al. Detection of cortical thickness correlates of cognitive performance: reliability across MRI scan sessions, scanners, and field strengths. Neuroimage. 2008;39(1):10–8.
31. Schilling C, Kühn S, Romanowski A, Schubert F, Kathmann N, Gallinat J. Cortical thickness correlates with impulsiveness in healthy adults. Neuroimage. 2012;59(1):824–30.
32. Schilling C, Kuhn S, Paus T, Romanowski A, Banaschewski T, Barbo A, et al. Cortical thickness of superior frontal cortex predicts impulsiveness and perceptual reasoning in adolescence. Mol Psychiatry. 2013;18:624–30. 33. Mak AKY, Wong MMC, Han S-H, Lee TMC. Gray matter reduction associated
34. Sheehan DV, Janavs J, Baker R, Harnett-Sheehan K, Knapp E, Sheehan M, et al. MINI-Mini International neuropsychiatric interview-english version 5.0. 0-DSM-IV. J Clin Psychiatry. 1998;59:34–57.
35. Hamilton M. A rating scale for depression. J Neurol Neurosur Psychiatry. 1960;23(1):56–62.
36. Dale AM, Fischl B, Sereno MI. Cortical surface-based analysis I: segmentation and surface reconstruction. Neuroimage. 1999;9:179–94.
37. Fischl B, Sereno MI, Dale AM. Cortical surface-based analysis II: inflation, flattening, and a surface-based coordinate system. Neuroimage. 1999;9:195–207. 38. Fischl B, Sereno MI, Tootell RB, Dale AM. High-resolution intersubject
averaging and a coordinate system for the cortical surface. Hum Brain Mapp. 1999;8(4):272–84.
39. Fischl B, Kouwe A, Destrieux C, Halgren E, Segonne F, Salat DH, et al. Automatically parcellating the human cerebral cortex. Cereb Cortex. 2004;14(1):11–22.
40. Buyukdura JS, McClintock SM, Croarkin PE. Psychomotor retardation in depression: biological underpinnings, measurement, and treatment. Prog Neuropsychopharmacol Biol Psychiatry. 2011;35(2):395–409.
41. Hare TA, Tottenham N, Galvan A, Voss HU, Glover GH, Casey BJ. Biological substrates of emotional reactivity and regulation in adolescence during an emotional go-nogo task. Biol Psychiatry. 2008;63(10):927–34.
42. Leppänen JM, Milders M, Bell JS, Terriere E, Hietanen JK. Depression biases the recognition of emotionally neutral faces. Psychiatry Res. 2004;128(2):123–33. 43. Kircanski K, Joormann J, Gotlib IH. Cognitive aspects of depression. Wiley
Interdiscip Rev Cogn Sci. 2012;3(3):301–13.
44. Deveney CM, Deldin PJ. Memory of faces: a slow wave ERP study of major depression. Emotion. 2004;4(3):295–304.
45. Bourke C, Douglas K, Porter R. Processing of facial emotion expression in major depression: a review. Aust N Z J Psychiatry. 2010;44(8):681–96. 46. Marsh AA, Ambady N, Kleck RE. The effects of fear and anger facial
expressions on approach- and avoidance-related behaviors. Emotion. 2005;5(1):119–24.
47. Romine CB, Reynolds CR. A model of the development of frontal lobe functioning: findings from a meta-analysis. Appl Neuropsychol. 2010;12(4):190–201.
48. Shaw P, Kabani NJ, Lerch JP, Eckstrand K, Lenroot R, Gogtay N, et al. Neurodevelopmental trajectories of the human cerebral cortex. J Neurosci. 2008;28(14):3586–94.
49. Swick D, Ashley V, Turken AU. Left inferior frontal gyrus is critical for response inhibition. BMC Neurosci. 2008;9:102.
50. Elliott R, Rubinsztein JS, Sahakian BJ, Dolan RJ. Selective attention to emotional stimuli in a verbal go/no-go task. Neuroreport. 2000;11(8):1739–44. 51. Garavan H, Ross TJ, Stein EA. Right hemispheric dominance of inhibitory
control: an event-related functional MRI study. Proc Natl Acad Sci U S A. 1999;96(14):8301–6.
• We accept pre-submission inquiries
• Our selector tool helps you to find the most relevant journal
• We provide round the clock customer support
• Convenient online submission
• Thorough peer review
• Inclusion in PubMed and all major indexing services
• Maximum visibility for your research
Submit your manuscript at www.biomedcentral.com/submit