The London School of Economics and Political Science
Essays on International Trade and Firm
Organization
Giuseppe Berlingieri
Declaration
I certify that the thesis I have presented for examination for the PhD degree of the London School of Economics and Political Science is solely my own work.
The copyright of this thesis rests with the author. Quotation from it is permitted, provided that full acknowledgement is made. This thesis may not be reproduced without the prior written consent of the author.
I warrant that this authorization does not, to the best of my belief, infringe the rights of any third party.
I declare that my thesis consists of 71,450 words.
London, December 5, 2013
Giuseppe Berlingieri
Contents
Acknowledgement vi
Abstract vii
1 Outsourcing and the Rise in Services 1
1.1 Introduction. . . 1
1.2 The Rise of the Service Sector in the U.S. . . 5
1.2.1 The Change in the Input-Output Structure of the U.S. Economy . . . 5
1.2.2 The Rise in PBS and Outsourcing . . . 7
1.3 A Simple Gross Output Accounting Model. . . 10
1.3.1 The Economic Environment . . . 11
1.3.2 Accounting for Outsourcing: Three Simple Counterfactual Exercises . . . 14
1.4 Sectoral Reallocation in the U.S., 1948-2002 . . . 15
1.4.1 Calibration . . . 15
1.4.2 Results and Counterfactuals . . . 16
1.5 Final Demand Channels . . . 19
1.5.1 Back to the Accounting Model: Preferences . . . 20
1.5.2 Calibration . . . 21
1.5.3 Results with Variation in Final Uses . . . 23
1.6 Mechanisms of Service Outsourcing . . . 25
1.6.1 Outsourcing as Relabeling? Evidence from Occupations . . . 26
1.6.2 Determinants of Service Outsourcing . . . 29
1.7 Conclusions . . . 32
Figures . . . 34
Appendix . . . 44
1.A Data . . . 44
1.A.1 Data Description . . . 44
1.A.2 Construction of Aggregate I-O Tables . . . 50
1.A.3 Construction of the Price Indexes. . . 50
1.B Extra Results . . . 52
1.B.1 Results until 2007 . . . 52
1.B.2 Results with Standard I-O Tables. . . 53
1.B.3 Results with Investment . . . 54
1.C Determinants of PBS Outsourcing: Census data. . . 56
1.D The Rise of Business Services in OECD Countries . . . 58
2 Exporting, Coordination Complexity, and Service Outsourcing 61 2.1 Introduction. . . 61
2.2 Evidence on Service Outsourcing . . . 65
2.2.1 Industry Level Data . . . 66
2.2.2 Anecdotal Evidence and the Determinants of Service Outsourcing . . . . 67
2.3 Existing Literature . . . 68
2.3.1 Service Outsourcing Literature . . . 68
2.3.2 The Boundaries of the Firm . . . 69
2.4 The Model . . . 69
2.4.1 Buyer and Suppliers . . . 70
2.4.2 Firm Boundaries, Contracts and Timing . . . 71
2.4.3 Optimal actions . . . 74
2.4.4 Communication and Monitoring Costs . . . 76
2.4.5 The Optimal Outsourcing Share and the Effect of Globalization. . . 77
2.4.6 A General Condition on the Communication/Monitoring Cost Function . 79 2.5 Econometric Evidence from France . . . 79
2.5.1 Data . . . 79
2.5.2 The Impact of Coordination Complexity on PBS Outsourcing . . . 81
2.5.3 Outsourcing versus Internal Production . . . 88
2.5.4 Timing: Sunk versus Fixed Costs . . . 92
2.5.5 Endogeneity: Is Reverse Causality a Problem? . . . 95
2.6 Non-linear Effects: Evidence on Proposition 4 . . . 99
2.7 Conclusions . . . 100
Figures . . . 102
Appendix . . . 106
2.A Extensions to the Model . . . 106
2.A.1 Enforceable Contracts . . . 106
2.A.2 Adapting to the Average Action . . . 107
2.B Data . . . 108
2.B.1 Data Description . . . 108
2.B.2 Variable Definitions . . . 109
2.B.3 Data Cleaning . . . 112
2.C Extra Results . . . 113
3 Variety Growth, Welfare Gains and the Fall of the Iron Curtain 115 3.1 Introduction. . . 115
3.3 Data and Macro Evidence . . . 118
3.4 Empirical Strategy . . . 122
3.4.1 Theory . . . 122
3.4.2 Estimation Method. . . 124
3.4.3 The Impact of the Good Definition . . . 126
3.4.4 Measurement Error and Robustness to the Weighting Scheme . . . 127
3.5 Results. . . 132
3.5.1 Welfare Gains in the UK and Robustness to the Good Definition . . . 132
3.5.2 Welfare Gains over Time and Robustness to the Classification. . . 137
3.5.3 The Fall of the Iron Curtain. . . 138
3.6 Conclusions . . . 143
Figures . . . 145
Appendix . . . 148
3.A Theory. . . 148
3.A.1 Log-Change Ideal Weights . . . 148
3.A.2 Methodology for the Estimation of the Elasticity of Substitution . . . 148
3.B Extra Results . . . 150
List of tables 153
List of figures 155
Bibliography 156
Acknowledgement
I am greatly indebted to my supervisors Luis Garicano and Gianmarco Ottaviano, and my advisor Emanuel Ornelas for invaluable guidance and advice. I am also very thankful to Stephen Redding and Daniel Sturm who advised me during the first part of my PhD.
Many individuals have provided feedback on the chapters of this thesis. I would like to thank Rachel Ngai and Silvana Tenreyro for their numerous comments and suggestions on Chapter 1, Mirabelle Muˆuls for her help with the data of Chapter 2, and John Romalis for the support on Chapter 3. I have also benefited from feedback and comments from Swati Dhingra, Guy Michaels, John Morrow, Veronica Rappoport, Thomas Sampson, as well as colleagues and sem-inar participants at the Centre for Economic Performance (CEP) and the LSE.
Financial support from UniCredit & Universities Foundation through the “Crivelli” scholar-ship is very gratefully acknowledged.
Many friends I have met during these years have made the PhD experience less painful and much more enjoyable, especially Patrick Blanchenay, Andrea Buffa, Luca Fornaro, Fadi Hassan, Michele Piffer, Rosa Sanchis-Guarner, and Dimitri Szerman just to name few. And the fellow PhD students of the CEP Globalisation group have made the new 32L - 2.35 open space an incredibly inspirational working environment, many thanks to Johannes Boehm, Ben Faber, Jason Garred, Frank Pisch, and Claudia Steinwender.
Abstract
This thesis analyses the impact of globalisation on the boundary of the firm and, in turn, how outsourcing policies have shaped the reallocation of labour across sectors.
The first chapter (“Outsourcing and the Rise in Services”) investigates the impact of out-sourcing on sectoral reallocation in the U.S. over the period 1947-2007. Roughly 40% of the growth of the service sector comes from professional and business services, an industry highly specialized in the production of intermediates and where most of the service outsourcing activity is concentrated. As a result, business services have experienced an almost fourfold increase in their forward linkage, the largest change among all industries. I find that the overall change in input-output structure of the economy accounts for 33% of the increase in service employment, and business services outsourcing contributes almost half of that amount.
The second chapter (“Exporting, Coordination Complexity, and Service Outsourcing”) in-vestigates the determinants of service outsourcing, and professional and business services in particular. Drawing on the insights of a model of the boundary of the firm based on adaptation costs and diminishing return to management, I argue that an increase in coordination complex-ity (e.g.: more inputs in the production process) leads firms to outsource a higher share of their total costs and to focus on their core competences. Since country-specific inputs are needed to export to a particular country (e.g.: a specific advertisement campaign), I proxy coordination complexity with the number of export destination markets and I find support for the theory using an extensive dataset of French firms. Over time, firms that export to more countries increase the amount of purchased business services; the finding is very strong and robust to size and many other determinants of outsourcing proposed in the literature. The firm-level evidence also contributes to opening the black box of fixed export costs and to establishing a new causal link between globalization and structural transformation exploiting plausibly exogenous demand shifters.
The third chapter (“Variety Growth, Welfare Gains and the Fall of the Iron Curtain”) analyses two key issues in the literature of international trade: the welfare gains from trade and the estimation of the elasticity of substitution across goods. In particular I investigate the welfare gains coming from the increase in the number of varieties in the U.K. I find that the fall of the Iron Curtain and the expansion of trade with the countries of the former Soviet contribute for roughly 10% of the total gains. China, in comparison, accounts for 5% of the gains. The methodology is an improved version of the one proposed by Broda and Weinstein (2006) and Feenstra(1994), which is more robust to the definition of goods and to the classification used.
Chapter 1
Outsourcing and the Rise in Services
1.1
Introduction
The process of economic development is characterized by the reallocation of resources across the broad sectors of agriculture, manufacturing and services. As Kuznets noted in his Nobel Prize lecture, restricting attention to advanced stages of development, structural transformation coincides with the rise of the service sector and the decline of manufacturing.1 In the U.S., the service sector (including government) today accounts for more than 83% of total employment, compared to 60% in 1947. In order to explain structural change in recent years, it is therefore key to understand the reasons behind the remarkable rise in services.
The literature on structural transformation has mainly focused on final demand channels. Yet final demand is not the only driver of the increase in services, as firms are in turn ‘consumers’ of goods and services through intermediate inputs. A closer look at the data reveals that a large share of the growth of the service sector is explained by industries for which final demand plays a relatively small role, namely professional and business services, finance and real estate.2 In
particular, professional and business services account for roughly 40% of the total growth, both in terms of total GDP and total employment; when finance and real estate are added, these three industries account for 50% of the service sector growth in terms of employment and 94% in terms of GDP. Starting from this basic fact, this paper analyzes the production side of the economy and the role played by firms in shaping the reallocation of labor across sectors. I propose two unexplored channels that help explain the recent rise in services: changes in the composition of intermediates and their sourcing mode.
Intermediate goods account for roughly 50% of total gross output across a large number of countries (Jones,2011b). However, a large intermediate multiplier is not sufficient per se to affect sectoral reallocation over time: some additional variation is needed. In this paper, I first provide novel evidence for the evolution of the input-output structure of the U.S. economy over the past
1
“The rate of structural transformation of the economy is high. Major aspects of structural change include the shift away from agriculture to non-agricultural pursuits and, recently, away from industry to services.” Lecture to the memory of Alfred Nobel, December 11, 1971.
2
Professional and business services include accounting, engineering, consulting, legal services but also main-tenance, janitorial services just to cite few. See the Appendix for the precise definition. I will also refer to this industry as business services or PBS.
60 years. In particular, I show that the most important changes are related to service sectors that are intensive in the production of intermediates. For instance professional and business services have experienced an almost fourfold increase in their forward linkage, a measure of the interconnection of an industry to the rest of the economy through the supply of intermediate inputs. Second, by providing a simple gross output accounting model that captures the full sectoral linkages of the economy, I show that changes in intermediate demand account for a significant share of the total reallocation of labor across sectors, improving the predictive power of a traditional value added model. Third, I quantify the contribution of service outsourcing to the rise of the service sector.
The strong empirical regularities unveiled by Kuznets have spurred a large body of literature, which can be divided into two main categories, depending on the explanation put forward to rationalize sectoral reallocation. The first explanation, often referred to as “utility-based” or “demand-based”, highlights the role of different income elasticities for different goods and dates back to Engel.3 The second explanation, labeled “technological” or “supply-side” and first proposed by Baumol (1967), rationalizes structural change drawing on the different rates of sectoral productivity growth and on standard homothetic preferences with a less than unitary elasticity of substitution between goods.4
Despite the extensive work on the subject, there is still no consensus on the empirical identi-fication of the key economic forces that drive structural transformation, as argued byHerrendorf et al.(2013b). They show that the choice of consumer preferences is just an empirical issue and depends on how final consumption is measured. This is a key point of disagreement between the two streams of existing literature, as both mechanisms ultimately depend on the form of consumer preferences. MoreoverBuera and Kaboski (2009) argue that the standard theories of structural change cannot account for the steep decline in manufacturing and rise in services in recent years, and for the large deviations between value-added shares and labor shares. This paper departs from the existing literature by analyzing the production side of the economy and proposing new channels that shape structural transformation and at the same time are unrelated to final demand.
Changes in the composition of intermediates are reflected in the structure of input-output tables. Despite the growing use of input-output data, there is no systematic evidence for the evolution of the structure of sectoral linkages over time.5 Jones (2011b) compares the input-output structure of the U.S., Japan and China in 2000, and argues that they are not very
3
This strand of the literature employs non-homothetic preferences to achieve non-unitary income elasticities. A non-exhaustive list of works in this area includes: Matsuyama(1992),Laitner(2000),Gollin et al.(2002),Caselli and Coleman II(2001), Restuccia et al.(2008) for two-sector models focusing on the movement of labor away from agriculture;Echevarria(1997) andKongsamut et al.(2001) for three-sector models, where the latter authors propose a model that features both structural change and constant aggregate growth. Foellmi and Zweim¨uller (2008) also combine the Kaldor and Kuznets’ facts in a model with hierarchic preferences.
4Two recent contributions that combine structural change and aggregate balanced growth are: Ngai and Pissarides(2007) in a standard three-sector model; andAcemoglu and Guerrieri(2008) in a two-sector model of high versus low capital intensive industries.
5
different: they all display a sparse pattern with a strong diagonal (output of an industry used as intermediate input in the same industry) and similar intermediate multipliers. The main difference Jones points out is that business activities are less important in China, in that they are not as widely used as in Japan and in the U.S. I find the same difference for the U.S. over time. I show that the largest change in the structure of the input-output tables involves an increase in the use of services specializing in the production intermediates, especially by manufacturing industries. Professional and business services have experienced an almost fourfold increase in their forward linkage and the use of finance and real estate has also risen, albeit to a lesser extent, with their forward linkages increasing by 83% and 42%, respectively.
I study the changes in intermediate demand in a standard growth accounting model with intermediate inputs as in Hulten (1978), expanded to capture the fully fledged input-output structure of the economy similar toHorvath (1998,2000).6 In this setting, not only do sectoral labor shares depend on consumption shares as in a standard value added model, but also on the input-output structure of the economy through the Leontief inverse matrix. Changes in intermediate demand therefore induce a reallocation of labor across sectors. I find that, when final demand is kept constant over time, the sole evolution of the input-output structure of the economy accounts for 33% of the total increase in service employment. Although demand-side factors are certainly important, this exercise quantifies the proposed channels in a neat and simple setting, which avoids confounding the results with the choice of data and parameters not specifically related to the forces under study. Then I allow final demand to evolve over time and show that the results are not wiped out by other channels previously discussed in the literature. In fact, accounting for intermediates improves a traditional value added model prediction for the share of services by 4.7 percentage points of total employment, an amount that corresponds to 21% of the actual increase in services over the period.
What drives the changes in the use of intermediates over time? I show that one of the key forces is outsourcing. The intuition is simple: if firms contract out part of their production processes, they will have to buy these inputs from external providers, and this change will be reflected in the data as an increase in the use of intermediates. In particular, if a manufacturing firm outsources part of its headquarter services, the intermediate use of services will increase because it is likely that these inputs will be purchased from firms specializing in services. The idea that outsourcing might drive structural transformation goes back toFuchs(1968) but, to the best of my knowledge, it has never been formally tested in a model of structural transformation.7 Herrendorf et al.(2013b) briefly discuss this idea, arguing that outsourcing is unlikely to play a major role. Although outsourcing alone certainly cannot explain the entire process of structural transformation, at the same time the data reveal that its impact can be sizable. In fact more than 90% of the output of professional and business services is used by firms, either as intermediate input or in the form of investment. Hence final demand plays essentially no role in the growth
6Recent examples that employ a framework with intermediate inputs and full sectoral linkages include, among
others,Ngai and Samaniego(2009) andCaliendo and Parro(2012).
7
Fuchs points out that: “As an economy grows, there is some tendency for specialized firms to be organized to provide the business and professional services that were formerly taken care of within manufacturing and other goods-producing firms or were neglected.”
of an industry that accounts for almost half of the total rise of the service sector.
Given the high share of intermediate production and the high substitutability that charac-terize business services, it is common in the literature to identify the rise of this industry as an increase in outsourcing. I take a similar approach in this paper and improve on the literature by controlling for internal production. In principle input-output data do not clearly distinguish the boundary of the firm. However, in the case of business services, most of the internal production is classified in auxiliary units (headquarters), which can be excluded. I show that the increase in the demand of business services comes from transactions across the boundary of the firm, and is not matched by a parallel increase in internal production. I then quantify how much of the change in intermediate use is due to business services purchased by other firms, thereby providing an estimate of the contribution of service outsourcing to the change of sectoral em-ployment shares.8 I do this performing a simple counter-factual exercise that fixes the demand of business services to their 1947 level and keeps it constant over time. I find that, had firms produced all their business services in-house, the service sector employment share would have been 3 percentage points smaller, which is equivalent to 14% of the total increase in the share of services.
There is much evidence that many other types of services have been outsourced over the same period, especially bearing in mind the very long time frame of the analysis. By focusing on business services only, I therefore take a conservative approach and provide a lower bound for the contribution of outsourcing to structural change. Yet I capture a large share of the total actual contribution. For instance I find that finance, despite having experienced an almost double increase in its forward linkage and having contributed to the recent rise of macroeco-nomic volatility as showed by Carvalho and Gabaix (2013), does not play a major role in the reallocation of labor across sectors. A potential concern is that final demand might drive the rise in business services indirectly, with firms increasing their use of services as a result of a shift in consumers’ tastes. Yet an analysis of occupational data shows that, to a first approximation, the overall composition of business services has not changed over time, supporting the view of an organizational change with a reallocation of activities across the boundaries of the firms; and even where specific activities have increased their importance over time, final demand is unlikely to play a role in that change.
The paper is organized as follows. The next section discusses the main stylized facts on the rise of the service sector and critically assesses the measure of outsourcing used in the analysis. I then outline the accounting framework in Section 1.3, and present the main results of the paper in the following section. Section 1.5 shows that the results are robust to the inclusion of traditional final demand channels. Finally section 1.6 discusses potential determinants of outsourcing and Section 1.7concludes. The details on the data and extra results are presented in the Appendix.
8
1.2
The Rise of the Service Sector in the U.S.
Over the past 60 years, structural transformation in developed countries has mostly coincided with the impressive rise in the share of services. For instance, in the U.S., the share of services in total GDP has risen to 80% in 2007 from 60% in 1947, as displayed in Figure1.1a(left-hand side axis). This is a well-known fact but what has not been sufficiently appreciated in the literature is that this growth is almost entirely explained by three industries only, namely Professional and Business Services (hereafter PBS), Finance and Real Estate.9 Figure 1.1a also shows the total growth of the service sector and its components (right-hand side axis); PBS, Finance and Real Estate account for a growth of 18.8 percentage points of GDP, versus a total growth of 20.1 points. Adding Health Care, these four industries account for more than the total growth, meaning that other service sectors have seen their shares decreasing. PBS have increased their share in total GDP by 8.8 percentage points, accounting for 43.6% of the total growth of the entire service sector, the biggest contribution among all industries. The same graph drawn for employment is revealing (Figure 1.1b). PBS have grown by 9.2 percentage points of total employment, roughly the same amount in terms of GDP. On the other hand, Finance and Real Estate combined have increased their share in total employment by only 2.3 percentage points, versus a combined increase of 10.1 in terms of GDP. This highlights the asymmetric contribution of these industries; Finance and Real Estate contributed a lot in terms of value added but not that much in terms of employment. Given the importance of PBS, the rest of this section will investigate the implications of their rise on the structure of the economy and the determinants of the rise itself, which can be ascribed mainly to outsourcing.
1.2.1 The Change in the Input-Output Structure of the U.S. Economy
The PBS industry is unusual. In fact, in 2002 roughly 83% of its output was sold to firms as intermediate inputs compared to 44% for the economy as a whole; an additional 8% of its output was used for investment, while final consumption accounted for just 7%. One of the implications of these characteristics is that the remarkable growth in the share of PBS is reflected in a parallel change of the Input-Output (I-O, hereafter) structure of the economy; a fact that has been overlooked in the literature despite the widespread use of I-O data. Jones(2011b) asks the question how much the I-O structure of an economy differs across countries; his answer is “not much”. Looking at the I-O matrices for the U.S., Japan and China in 2000, he notices that they all display a sparse pattern with a strong diagonal and just a few inputs that are widely used by all other sectors. The main difference is that business activities are less important in China: they are not as widely used as in Japan and in the U.S. A very similar picture holds true for the U.S. over time. Figure1.2shows the evolution of the total requirements table from
9
Many authors have discussed the important contribution of PBS to job growth; see for instanceAbramovsky and Griffith(2006),Abramovsky et al.(2004) for the U.K.;Goodman and Steadman(2002), andYuskavage et al. (2006) for the U.S. But, to the best of my knowledge, no previous work has attempted to quantify the impact of PBS outsourcing on structural transformation.
1947 to 2002.10 The main change is the significant increase in the use of PBS (sector 73) in the production of all other goods, and to a smaller extent the increase in the use of Finance (sector 70) and Real Estate (sector 71), other two industries for which final demand plays a relatively small role. The horizontal line corresponding to PBS was almost absent in 1947 but becomes more and more visible over time. This change is clearly depicted in Figure1.3a that shows, for all commodities in the economy, the increase in the share of PBS in the total requirements.
The horizontal sum of the coefficients in the total requirements table is usually referred to as forward linkage, a measure of the interconnection of a sector to all other sectors through the supply of intermediate inputs. In light of the insights provided by Acemoglu et al. (2012), the sharp rise of the PBS forward linkage implies that this sector has greatly increased its influence on the rest of the economy and any shock to it will now propagate directly to a large part of the economy. Figure 1.3b shows, for some selected industries, the evolution of the forward linkage divided by the total number of sectors; inAcemoglu et al.’s (2012) setting, this quantity essentially corresponds to the elements of what they define “influence vector” (up to the labor share). The figure confirms that PBS have experienced a sharp increase in their forward linkage, overcoming sectors with a traditionally high forward linkage like transportation. PBS have in fact become the sector with the highest influence on the rest of the economy, considerably higher than the influence of the average or median sector. The forward linkage of the finance sector (sector 70) has also increased, although more moderately compared to PBS. This fact is in line with the results of Carvalho and Gabaix (2013), who show that the recent rise of macroeconomic volatility is largely explained by the rise of finance, or more specifically of its Domar weight. Their results are suggestive for the impact that the PBS sector might have on aggregate outcomes. Finally, this change is not a specific characteristic of the U.S economy; in fact, in Appendix 1.D, I show that the same pattern holds true for most OECD countries.11
The PBS intrinsic nature of being mainly specialized in the production of intermediate inputs calls for an investigation of the role of firms in driving the rise of the PBS share in total employment. In particular, changes in intermediate demand or managerial decisions like producing in-house or outsourcing affect the share of services in total intermediates, increasing the use of PBS. These channels remain unexplored in the literature of structural change, given the focus on final demand. PBS are the industry where most of the service outsourcing takes place; it is very common in the literature to identify the rise in use of PBS as an increase in outsourcing, and the same approach is taken here. There could be other explanations though: an overall increase in service activity both inside and outside the firm or, more simply, problems in precisely identifying the boundary of the firm in the data. The next sub-section provides evidence showing that the rise in the use of PBS is mainly driven by outsourcing.
10
The total requirement table shows for each commodity at the bottom of the table the inputs required, both directly and indirectly, from all industries in the economy to produce a dollar of output. The strong diagonal in this case is obtained by construction.
11
1.2.2 The Rise in PBS and Outsourcing
The identification of the rise in PBS use with a rise in outsourcing is quite common in the literature12, but this assumption could raise some concern since the I-O data do not clearly distinguish the boundary of the firm. The data are collected at the establishment level; hence, all the in-house services provided by the headquarters or by separate service-providing units will be accounted within services, and the increase of PBS use could just be an increase in the use of services produced by the same firm and not purchased from the market. Yet, a deeper analysis of industry data shows that most of the transactions take place across the boundaries of the firms, and they are not matched by a parallel increase of services produced inside the firms. Mainly using occupational data, Section1.6will provide further insights and evidence on the potential mechanisms that drive the rise in outsourcing.
Industry data, on which I-O data are based, offer two main arguments in support of the idea that the increase in PBS mostly coincides with an increase in service outsourcing. First of all, it is true that the data are collected at the establishment level, but service reporting units are classified within services only under the new NAICS classification, which was adopted in 1997. This means that for all previous years, under the SIC classification, the establishments providing support services were classified on the basis of the industry of the establishment they were serving, and not their primary activity.13 Hence, all the establishments providing support services to manufacturing firms were classified within manufacturing, and the increase of PBS use by these firms necessarily coincided with transactions outside the boundary of the firm. Secondly, the share of value added or employment accounted by auxiliary units is remarkably constant over time, and it cannot explain the increase in the share of PBS. Figure1.4and Table 1.1 show the share of PBS in GDP and in total employment over time, according to the two different classifications. It is evident that their difference does not vary much over time. In fact, when the sub-sector corresponding to auxiliary establishments is removed from the NAICS data, the series look extremely similar under the two different classifications.
One could think of the creation of auxiliary units as a temporary phase in the life-cycle of a manufacturing company. At en early stage, services are performed internally. For instance the accounting, billing, and marketing activities are performed at the back of the production site; no separate unit exists and no separate records are kept, hence the production of these services does not show up in the data. Even when the company becomes bigger and sets up separate accounting and marketing departments, the production of these services will remain undetected unless separate records are kept. These services will appear in the data only at a further stage, when the company has grown further and has become a large multi-establishment enterprise, establishing a separate auxiliary unit that can charge intra-company users and even sell services to other enterprises. It is at this stage that the two classifications differ. Under
12Among others, see Abraham and Taylor (1996), Fixler and Siegel (1999), ten Raa and Wolff (2001) and Abramovsky and Griffith(2006).
13
These establishments were called auxiliaries units in the SIC nomenclature. For further details see the U.S. Census Bureau Clarification Memorandum (http://1.usa.gov/104BWsf) andOffice of Management and Budget (1987).
Table 1.1: Professional and Business Services (PBS) (a) Share of GDP
1948 1957 1967 1977 1987 1997 2007
PBS (NAICS) 3.34 4.10 4.87 5.62 8.12 10.11 12.09
Auxiliary Units 1.49 1.52 1.47 1.42 1.62 1.49 1.83
PBS - Aux. 1.86 2.58 3.40 4.19 6.49 8.62 10.26
PBS (SIC) 1.75 2.55 3.46 4.37 6.86 8.93 n.a.
(b) Share of Total Employment
1948 1957 1967 1977 1987 1997 2007
PBS (NAICS) 3.34 3.88 4.82 6.13 9.18 12.01 12.56
Auxiliary Units 1.13 1.12 1.09 1.10 1.15 1.27 1.29
PBS - Aux. 2.21 2.76 3.73 5.03 8.03 10.74 11.26
PBS (SIC) 1.49 2.05 3.09 4.40 7.30 9.92 n.a.
Note: see notes in Figure1.4.
SIC, this new auxiliary unit is classified according to the industry of the establishment it serves, that is manufacturing. Under NAICS, instead, the unit is classified on the basis of its primary activity, which is PBS; hence the data will display an increase of PBS intermediate use, despite coming from within the boundary of the firm. Eventually, increased economic specialization may lead the enterprise to outsource its service inputs to external providers. At this final stage both classifications will allocate these activities to PBS, and the services bought by the manufacturing enterprise will be correctly accounted as an increase of PBS intermediate use outside the boundary of the firm.
By excluding auxiliary units in the main results of the paper, I will be able to control for internal production under both classifications and hence correctly identifying outsourcing. Unfortunately the same sharp conclusion cannot be drawn for I-O data in recent years, or at least not entirely. In fact, although the Bureau of Economic Analysis (BEA) constructs I-O tables using the same definition of industries, it applies some modifications in the case of commodities.14 As for industry data, the BEA classifies establishments according to their primary activity; occasionally, however, it identifies some secondary products and re-classifies them into other commodities, in contrast with the Economic Census that classifies everything in the industry of the primary product. This re-classification only affects small single establishment firms with one single secondary product (but large enough to keep separate records).15 In fact, whenever two or more support activities cross six-digit NAICS industries, they are treated as auxiliary units and classified in NAICS sector 55 (Management of Companies and Enterprises),
14
The definition of industries corresponds to the SIC or NAICS definition when the standard tables (before industry redefinitions) are used. See the Online Appendix1.B.2.
15
which I will exclude. This is the case for medium and large multi-establishment enterprises that usually internally produce more than one support activity.
The problem of internal transactions therefore only remains for those small firms whose secondary products are re-classified by the BEA from manufacturing to PBS. These transactions are small in absolute terms and they are unlikely to drive the results. This statement is consistent with the evidence for goods provided byAtalay et al.(2012) for the domestic operations of U.S. multi-plants firms, and by Ramondo et al. (2012) for intra-firm trade of U.S. multinational firms. Both papers show that shipments between establishments owned by the same firm are surprisingly low and extremely skewed towards towards large plants: the internal shipments of the median plant are zero or very low in both studies. Hence, by controlling for the internal transactions of medium and large plants, I am likely to capture the vast majority of internal service production recorded in the data.16
Moreover, there are two extra reasons to believe that the results will provide a robust estimate for outsourcing. First, I only consider PBS outsourcing, while there is much evidence that many other types of services have been outsourced, especially bearing in mind the long time frame of the analysis: transportation and warehousing are good examples.17 Even though a
small fraction of the change in PBS use accounted as outsourcing might come from internal transactions, many other types of services are not included, possibly causing an even larger bias in the opposite direction. I do not include them in the baseline results to be more conservative. In fact other services like transportation and wholesale trade are not classified within auxiliary units, hence contrary to PBS I would not be able to properly control for internal transactions. The second reason is that only the difference in service outsourcing will matter in the analysis. If the internal production of secondary products stays constant in relative terms over time, these internal transactions cannot possibly drive the result. The constant share accounted by auxiliary units, as shown in Table1.1and Figure 1.4, confirms this view.
This fact also provides evidence that the increase in the intermediate use of services is not a simple progressive shift towards service activity: the increase of purchased services is not matched by an equal increase of services internally produced. Or, to put it another way, even if firms started using more services for technological or other motives, they decided to purchase them from the market rather than produce them in-house. PBS are intrinsically very substitutable: for instance, a firm always has the option to employ an accountant or an engineer in-house instead of buying accounting and engineering services from specialized firms. Whether a firm today needs more accounting inputs due to the more complex regulatory environment or the firm is simply outsourcing the very same tasks it used to produce with internal employees,
16
Appendix1.B.2shows that the industry redefinitions performed by the BEA have a negligible impact on the magnitude of the results. It is reasonable to assume that the commodity re-classifications, which unfortunately cannot be observed, will have a similar small effect. Moreover any re-classification that takes place within manufacturing will not matter for the analysis; only the re-classifications from manufacturing to services, and PBS in particular, are a source of concern. The only examples provided by the BEA that fall into this category are advertising and data processing services.
17
For instance, as reported byAlvarenga and Malmierca(2010), most companies managed the physical distri-bution of their own products in the ’50s. Then two new companies, FedEx and DHL, together with UPS, started specializing only in that and quickly their logistical skills significantly eclipsed those of many manufacturing companies. What was done in-house in the ’50s now is seen as a function best performed by external providers.
it is not of primary importance for the quantitative analysis performed in this paper. Despite the option of internal production the firm decided to purchase the input from the market, so whatever the fundamental reason behind this choice may be, what is key in order to calculate the impact of outsourcing on the reallocation of labor across sectors is to correctly identify market transactions. Of course understanding why firms are outsourcing more services today is another interesting - albeit difficult - question to answer; the main problem is that it is hard to observe what a firm produces in-house. Despite a full analysis being beyond the scope of the paper, Section 1.6will try to shed some light on this important issue and show that, to a first approximation, the overall composition of business services has not changed over time.
Overall, the analysis of industry level data supports the view that most of the increase in the share of PBS has been driven by outsourcing. Firms, and manufacturing firms in particular, have increasingly bought services from the market instead of producing them in-house, causing a reallocation of resources across sectors. Herrendorf et al. (2013b) briefly discuss the role of outsourcing in shaping structural transformation; they claim that is not a major driving force arguing that PBS account for less than half of the increase in services and that a substantial share of PBS might reflect purchases directly made by consumers. Yet final demand accounts for just 7% of total PBS output and, according to their findings, PBS account for 41.5% of the total increase in services. Even though structural transformation cannot be entirely driven by outsourcing, at the same time the data reveal that its impact can be sizable. A back-of-the-envelope calculation using their results shows that, once the share of intermediates in Finance and Real Estate is also included, more than 53% of the total change in services comes from an increase in the use of intermediates.18 Firms can therefore play an important role in driving structural transformation, and managerial decisions like outsourcing are likely to have a sizable impact.
1.3
A Simple Gross Output Accounting Model
I use a simple accounting framework in order to quantify the contribution of the evolution of sectoral linkages, and of outsourcing in particular, to the reallocation of employment across sectors. The framework builds on standard growth accounting with intermediate inputs, widely used in the productivity literature sinceHulten(1978), and expanded to capture the fully fledged I-O structure of the economy as in the work ofHorvath(1998,2000). The main aim of this study is to perform an accounting exercise and not to explain why firms are changing their sourcing behavior over time.19 The changes in the I-O structure of the economy are therefore taken as given and simply regarded as exogenous changes in the production function. In this respect, the approach is close in spirit to the work of Carvalho and Gabaix (2013), who take the change of 18This result is simply obtained by summing up the contributions of Finance & Real Estate and PBS to the
total increase in services, 48.8% and 41.5% respectively, weighted by the average share of intermediates in their output, which is 39% for the former and 82% for the latter. If owner-occupied dwellings are excluded, the share of intermediates in Finance & Real Estate output increases to 61% (in 2002) and the overall contribution to 64%.
19
the Domar weights as given. The model is in a closed economy. The main reason for this choice is that, although the importance of imported services has risen in recent years, their magnitude is still very low, accounting for just 2.7% of total PBS in 2004 as reported byYuskavage et al. (2006). This fact is also confirmed by the results of this paper, which find that imported services play a very small role in the change of the I-O structure of the economy over time. Therefore the measure of outsourcing considered in this paper almost coincides with domestic outsourcing, given that the international dimension still plays a small role in the case of services.
1.3.1 The Economic Environment
1.3.1.1 Technology and Production
There is an arbitrary number ofJ sectors in the economy, even though in the baseline case I will consider just three aggregate sectors: agriculture, manufacturing and services. The production function for the good in sectorj is given by:
Yj =AjLβjj " J
Y
k=1
Mγkj
kj #1−βj
(1.1)
whereAj is the level of productivity,Lj is the amount of labor andβj ≥0 is the share of value added in sector j. Mkj is the amount of intermediate good from sector k used to produce the good in sector j. Note that the production function employs intermediate goods potentially from all sectors;γkj ≥0 is the share of intermediates from sector kand such thatPJk=1γkj = 1 for any sectorj. There is no capital in the model, so there is no dynamics and the equilibrium is simply a sequence of static economies. Hence time subscripts are not reported unless explicitly needed.
The Cobb-Douglas formulation for the production of gross output is quite common in growth accounting.20 It is assumed here to keep the model as standard as possible and, most impor-tantly, because it can be very easily and intuitively calibrated in the data. On the other hand, the intuition for outsourcing in its starkest form is a pure relabeling effect, according to which the same tasks previously performed inside the firm are simply outsourced to external providers. If the new supplier is classified in a different sector, for instance a manufacturing firm that con-tracts out its accounting to a specialized service provider, this will bring about a reallocation of resources across sectors. Under this interpretation, the outsourced task is considered as es-sentially the same, regardless whether it is produced inside or outside the firm.21 Therefore the Cobb-Douglas formulation is not the ideal one, as one would think of those tasks as almost perfectly substitutable. Nevertheless, for the reasons just outlined, the production function is
20Ngai and Pissarides(2007) show that a Cobb-Douglas functional form is needed in order to obtain a balanced
growth path.Herrendorf et al.(2013a) find that a Cobb-Douglas production function well captures U.S. postwar structural transformation, and even more so in a gross output framework like the present one.
21
Notice that this very stark interpretation is not the only explanation; outsourcing can in fact take several forms. For instance outsourcing could entail the substitution of an old superseded task with a new more techno-logically advanced one. In this sense outsourcing could be a way of accessing new technologies that would be too costly to be produced in-house, asBartel et al.(2012) have argued. See Section1.6.
assumed to be Cobb-Douglas and the perfect substitutability is imposed through some simple counterfactual exercises, which are described at the end of this section.
Each sectoral good can be either consumed or used as an intermediate in the production of the other goods according to (1.1), so the market clearing for each sector requires:
Yj =Cj+ J X
k=1
Mjk (1.2)
whereCj is consumption of good j. Households are endowed with L units of labor that supply inelastically at the rental price w. All factor and goods markets are characterized by perfect competition and labor is perfectly mobile across sectors. Producers of each good solve the following problem:
min Lj,{Mkj}Jk=1
wLj + J X
k=1
PkMkj s.t. AjLβjj " J
Y
k=1
Mγkj
kj #1−βj
≥Yj (1.3)
The conditional factor demands are:
Lj =βj
PjYj
w (1.4)
Mkj =γkj(1−βj)
PjYj
Pk
(1.5)
1.3.1.2 Sectoral Labor (Re-)Allocation
Using the good market clearing condition in (1.2) and the equilibrium demand for intermediates according to (1.5), it is possible to get an expression for the value of gross output for each sector
j as follows:
PjYj =PjCj+Pj J X
k=1
Mjk =PjCj + J X
k=1
γjk(1−βk)PkYk (1.6)
Using the equilibrium demand for labor according to (1.4), the labor sharelj of each sector can be written as follows:
lj =
Lj
L =
βjPjYj
wL =βjXj +βj
J X
k=1
γjk(1−βk)
PkYk
wL (1.7)
where Xj = PwLjCj is the consumption expenditure share of sector j, or, using a terminology more consistent with the empirical application, the final uses expenditure share.22 Therefore the labor shares reflect the presence of intermediates and the interrelation of sectors. In fact, the labor share of sectorj depends on the value of gross output of all other sectors {PkYk}Jk=1, and the overall intensity with which each other sector uses the output from sectorj as intermediate input,γjk(1−βk).
22
Note that equation (1.6) forms a system ofJ equations; it is convenient to re-write and solve it using matrix algebra as follows:
Y = Ω−1C (1.8)
where: Y=
P1Y1 .. .
PJYJ C=
P1C1 .. .
PJCJ Ω =
1−γ11(1−β1) · · · −γ1J(1−βJ) ..
. . .. ...
−γJ1(1−β1) · · · 1−γJ J(1−βJ)
(1.9)
The matrix Ω is aJ by J matrix and it can be expressed as Ω =I −D, whereI is an identity matrix and D is an industry-by-industry direct requirement matrix with a generic element defined asdj,k =γjk(1−βk). Ω−1 is referred to as the total requirements table, or the Leontief inverse matrix, and can be directly obtained from I-O data. Having solved for gross output, the vector of labor shares is obtained as follows:
l= 1
wLβY=β
Ω−1C
wL =βΩ
−1X (1.10)
where: l= l1 .. . lJ β=
β1 · · · 0 ..
. . .. ... 0 · · · βJ
X= X1 .. . XJ (1.11)
Therefore the labor shares differ from consumption expenditure shares due to the fully fledged I-O structure of the economy, captured by the total requirement table. The labor share in each sector is, in general, a function of the consumption share of all other sectors.
Introducing time subscripts, equation (1.10) can be re-written as:
lt=βtΩ−t1Xt (1.12)
The sectoral labor shares can evolve for two main reasons: either because of changes in final uses,Xt, as the literature on structural transformation has highlighted so far; or because the I-O structure of the economy changes over time. Note that the latter channel can affect employment shares in isolation, even if consumption expenditure shares do not change. This is precisely what I do in the main results of the paper: I keep final uses constant and simply evaluate the impact of the evolution of the I-O structure on the sectoral labor shares taking the matricesβt
and Ωt from the data.23 Then, as a robustness check, I allow for consumption shares to vary over time and show that the main results are not wiped out by the standard channels proposed in the literature. To this purpose preferences will be introduced in Section1.5.
23
This is obviously not possible in a value added model: if the share of intermediates is zero in all sectors, the matrix Ω is an identity matrix and the labor shares coincide with the final uses shares: lt=Xt ifβj= 1,∀j∈J.
1.3.2 Accounting for Outsourcing: Three Simple Counterfactual Exercises
In order to quantify the contribution of outsourcing to structural change, I perform three coun-terfactual exercises. The first one consists in fixing the I-O coefficients for manufacturing to their 1947 level, which implies taking the values for the elements of the direct requirement ma-trix {dj,m}Jj=1 in 1947 and keeping them fixed over time. This exercise shows what would have happened to sectoral employment shares, had manufacturing firms not changed their interme-diate demand over time. In the data, the importance of services in the total intermeinterme-diates of the manufacturing sector (ds,m) has strongly risen over time. Therefore fixing this coefficient to its 1947 level implies a lower labor share for the service sector, as equation (1.7) shows. The difference with the predictions obtained allowing for the full change in the I-O structure can be regarded as an upper bound for the contribution of outsourcing to sectoral reallocation. It would in fact correspond to assuming the whole increase in the use of service intermediates by manufacturing firms as coming from outsourcing. Not only are PBS included, but all other possible types of services like transportation, wholesale trade, health care, government inputs, etc... Although slightly overstretched, this is not totally implausible, as outsourcing is indeed observed even outside the PBS industry; finance, transportation and warehousing are all good examples of services that have been increasingly outsourced over time.24 The second and third exercises are very similar; instead of fixing the direct requirements coefficients from all other sectors, only the share of inputs coming from PBS and the one coming from finance are fixed, one at a time. Table1.2 summarizes the exercises.
Table 1.2: Counterfactual Exercises
1: No Service Outsourcing 2: No PBS Outsourcing 3: No Finance Outsourcing
dtj,m =d1947j,m ∀j∈J dtP BS,m =d1947P BS,m dtf,m =d1947f,m
Note: m=manufacturing,f=finance.
The counterfactual corresponding to fixing the share of PBS inputs is the main focus of the paper; it answers the question of what would have happened if the share of PBS intermediate inputs to manufacturing had been fixed at its 1947 level and all PBS had been produced inter-nally within manufacturing. Of course this exercise is correct only if the rise in PBS use comes from market transactions outside the boundary of the firm, otherwise it would not be possible to identify the result of this counterfactual as the contribution of outsourcing. Due to the re-classifications performed by the BEA, it is not possible to completely rule out the eventuality that a few transactions may come from establishments within the same firm. But, as already noted in Section1.2.2, this problem only affects those small firms whose secondary products are re-classified from manufacturing to PBS by the BEA. As for the case of redefinitions discussed in Appendix1.B.2, it is very unlikely that these re-classifications can have a big impact on the results. Moreover, as it is clear from the case of transportation, outsourcing also takes place in other sectors within services, especially because the focus is on the total change since 1947 and it is well documented that many of other types of services were performed internally at the
24
beginning of the period. All in all, the contribution of PBS outsourcing is a reasonable estimate and possibly a lower bound for the overall contribution of service outsourcing.
1.4
Sectoral Reallocation in the U.S., 1948-2002
I use the accounting model outlined in the previous section to predict structural transformation in the U.S. The advantage of using U.S. data is the very long time span; I-O tables are in fact available dating from 1947. Hence, compared to other countries, it is possible to investigate sectoral reallocation over a time horizon that is long enough to display the clear pattern of structural change. This section shows that it is possible to keep the final uses expenditure shares constant and still get a positive sectoral reallocation, by allowing the I-O structure of the economy to change over time. By shutting down the final demand channel, the only driving forces come from the production side. This setting is therefore a neat environment in which to investigate the role played by firms in shaping the reallocation of labor across sectors, and in particular quantify the contribution of changes in the composition of intermediates and their sourcing mode.
1.4.1 Calibration
Following most of the literature on structural transformation, I consider three sectors in the baseline case: agriculture, manufacturing and services; hence J = 3 and j ∈ {a, m, s}. This choice implies that all the total requirements tables have to be aggregated up to three sectors only.25 I calibrate final uses to match the employment shares in 1948, the first year for which
employment data are available. Inverting equation (1.12) it is possible to get the final uses shares from the employment shares according to:
Xt= Ωtβ−t1lt (1.13)
This is the only step required to predict the evolution of labor shares when the contribution of outsourcing and of the evolution of sectoral linkages are analyzed in isolation. In fact, by keeping final uses shares constant over time, I only need data on Ωt and βt to predict labor shares according to (1.12).26
Armed with data from the I-O tables, I then predict employment shares until 2002. In recent years, the I-O tables are available annually, not just for the benchmark years; hence the analysis can be extended until 2007 and not just until 2002, the last benchmark year. However, some caution in interpreting the results is needed. In fact, the annual tables are computed using more aggregate data and they do not match the statistical quality of tables in benchmark years. In particular, the intermediate inputs at the detail level are estimated assuming the industry
25
I consider a more disaggregated level only for the counterfactual exercises, in order to account for the specific PBS and finance shares.
26
These matrices are directly available for all benchmark years, while I use interpolated values for all other years. Further details on the data and on the methodology are contained in the Appendix.
technology to be constant, undermining the precise aim of this study. The results are therefore relegated to Appendix1.B.1.
1.4.2 Results and Counterfactuals
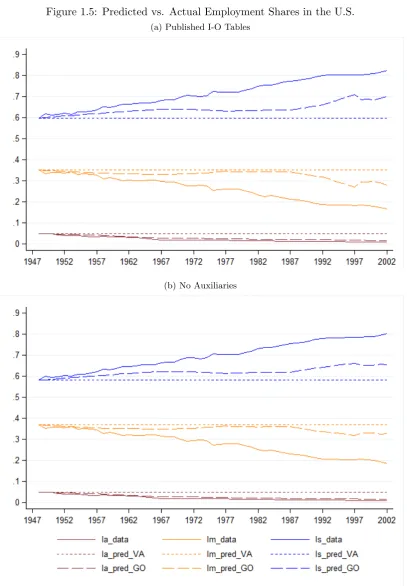
1.4.2.1 Predicting Sectoral Reallocation: the Role of the I-O Change
The results in this section answer the question of how much of the total labor reallocation can be explained by the change in the I-O structure of the economy alone. Figure1.5ashows the results of the exercise. The variation in the sectoral linkages of the U.S. economy is indeed capable of capturing a sizable amount of the overall labor reallocation across sectors. By omitting all other possible channels, the present accounting model clearly falls short of the actual data, but the predictive power is substantial, considering the simplicity of the exercise. As shown in Table 1.3, the increase in the services share is equal to 10.35 percentage points of total employment until 2002, almost half of the actual change. The result for agriculture is also noteworthy; the sole variation in the I-O linkages accounts for 82% of the total drop in the employment share of this sector.
Table 1.3: Predicted vs. Actual Changes in Employment Shares
Sector Data Prediction Ratio
Agriculture -3.99 -3.28 82%
Manufacturing -18.46 -7.07 38%
Services 22.45 10.35 46%
Note: The actual and predicted changes in the employment shares are ex-pressed as percentage points of total employment. The predicted changes are obtained using the proposed Gross Output model. Period: 1948-2002.
1.4.2.2 The Rise in Services: the Role of Outsourcing
The other main goal of this study is to quantify the impact of outsourcing on labor reallocation, and on the rise in services in particular. This goal is achieved through the three counterfactual exercises described in Section 1.3.2. Table 1.4 summarizes the results. The overall estimates for the baseline case are again displayed: the current accounting model can explain an increase of 10.35 percentage points in the employment share of services. When the first counterfactual experiment is performed, namely when all I-O coefficients for manufacturing are kept constant to their 1947 level, the prediction drops to 4.01 percentage points, 39% of the value for the baseline case. This result implies that outsourcing could explain 61% of the total prediction obtained in the current framework, in the admittedly far-stretched case that the entire observed change in the shares of intermediate use was coming from outsourcing. Still, this constitutes a useful upper bound for the quantity of interest.
Table 1.4: Effect of Outsourcing on the Service Employment Share
Counterfactual Predicted Ratio to Diff. wrt
Change Baseline Baseline
Baseline 10.35 100% 0.00
1: No Service Outsourcing 4.01 39% 6.34
2: No PBS Outsourcing 6.38 62% 3.97
3: No Finance Outsourcing 10.27 99% 0.08
Note: The predicted change and the difference with respect to the base-line setting are expressed in percentage points of total employment. Period: 1948-2002.
Instead when only the PBS share is fixed to its 1947 level, the prediction drops to 6.38 percentage points, 62% of the value for the baseline case. Hence PBS outsourcing accounts for 38% of the prediction generated by the model, which corresponds to an absolute change of 3.97 percentage points, or 18% of the total increase in service employment. This is not a negligible contribution considering that it is considerably more than half of the upper bound and that other types of services are subject to outsourcing, not only PBS. On the other hand, Finance does not seem to contribute much to structural transformation. When the intermediate share of financial services is fixed at its 1947 level, the prediction almost does not move: it drops to 10.27 percentage points, a mere 1% less than in the baseline case.27
1.4.2.3 Correcting for the Classification Change
A potential problem with the results presented in the previous section comes from the changes in the classification over time. In fact, while the data for employment and GDP are based on the NAICS classification over the whole period, the data for I-O tables are not. In particular the
27In results not shown, I perform another exercise in order to investigate the importance of imported services.
The results confirm those already shown byYuskavage et al.(2006); although the importance of imported services has risen in recent years, their magnitude is still very low, accounting for just 2.7% of total PBS in 2004. Therefore adding non-comparable imports, where most of PBS are concentrated, does not affect the contribution of outsourcing by much.
classification changes in 1997 and, in all previous years, I-O tables are constructed according to the SIC classification. Given that the study is performed at a quite aggregate level, considering three sectors only, most of the changes are not a source of concern because they take place within each sector. Unfortunately there are two major changes that can affect the results: the treatment of publishing and the treatment of auxiliary units. Both were classified within manufacturing under SIC, but they are now classified within services under NAICS; this change causes a jump of the data in 1997. In the case of publishing one might argue that the intrinsic characteristics of the activities in the industry have truly shifted over time, from a pure manufacturing task to a more complex, diversified and service oriented business. Hence, if that was true it would be even more correct not to adjust the data in order to pick up this transformation. In fact, the analysis focuses on the change over the entire period, so it is not really important to determine exactly when this shift took place, and even a gradual change would not invalidate the results. Instead the treatment of auxiliary units is more problematic because, as already noted in Section 1.2.2, they are now classified within PBS, while they were in manufacturing under SIC. Hence the change in the classification of this sector in 1997 may cause problems for the quantification of the contribution of PBS outsourcing.
In order to avoid these issues, I rectify the I-O data after 1997 to keep these two sectors within manufacturing. This adjustment also solves most of the concerns with the measure of out-sourcing. Auxiliary units are in fact those establishments dedicated to services within a firm; by excluding this sector, the vast majority of the internal transactions is eliminated. Unfortunately I cannot perform this adjustment in an ideal way. Auxiliary units are classified within sector 55 of NAICS, namely “Management of Companies and Enterprises”. This sector is composed of three sub-sectors: “Corporate, Subsidiary, and Regional Managing Offices” (551114); “Offices of Bank Holding Companies” (551111); and “Offices of Other Holding Companies” (551112). The first sub-sector was moved from manufacturing to PBS but the last two were not, in fact they were already classified within services under SIC as well. The trouble is that I-O data are not disaggregated enough to distinguish these three sub-sectors, hence by re-classifying the entire sector within manufacturing I underpredict the contribution of PBS. In the case of publishing instead, the re-classification can be performed quite precisely, at least for the benchmark years. Finally, the definition of the PBS industry under the two classifications does not match exactly and I have to perform a further finer adjustment within PBS.28
Figure1.5bcompares the predictions of the models against the data after the re-classification.29 As expected, the change in the services share that can be accounted for is lower, but the picture is not so different from before. The change in the I-O structure of the economy is still capable of capturing a sizable amount of the overall labor reallocation across sectors. Also note how the predicted increase in the service share gets smoother over time, reflecting the elimination
28See Appendix1.A.1.1for the details. 29
of the problems caused by the change of the classification in 1997. Tables 1.5 and 1.6 report the results. The predicted change in the service share is equal to 7.42 percentage points of total employment, which corresponds to 33% of the actual change. Given that all other channels have been shut down, the prediction is sizable, and it might be a lower bound. The estimate of the drop in the agriculture sector even improves; the changes in the I-O linkages alone account for 86% of the actual drop in agriculture.
Table 1.5: Predicted versus Actual Changes in Employment Shares - No Auxiliaries
Sector Data Prediction Ratio
Agriculture -3.99 -3.43 86%
Manufacturing -18.28 -3.99 22%
Services 22.28 7.42 33%
Note: See notes in Table1.3.
Table 1.6: Effect of Outsourcing on the Service Employment Share - No Auxiliaries
Counterfactual Predicted Ratio to Diff. wrt
Change Baseline Baseline
Baseline 7.42 100% 0.00
1: No Service Outsourcing 2.81 38% 4.61
2: No PBS Outsourcing 4.40 59% 3.02
3: No Finance Outsourcing 7.21 97% 0.21
Note: See notes in Table1.4.
The results on the contribution of outsourcing are also robust. Service outsourcing potentially accounts for 62% of the total prediction; and if the contribution is more plausibly narrowed to PBS only, outsourcing explains 41% of the total, corresponding to 3.02 percentage points of total employment. Given the actual change of 22.3 percentage points, PBS outsourcing alone can explain 14% of the total increase in the share of services in total employment. This share could be subject to a downward bias given the problems with the re-classification and the impossibility of fully adjusting the actual data. Moreover, if the analysis is restricted to 1987-2002, the period in which outsourcing was more pronounced, PBS outsourcing can explain 21% of the total increase in services.
1.5
Final Demand Channels
In this section I allow for for the final uses expenditure shares to vary over time. This exercise proves that the contribution of outsourcing is not wiped out by the traditional final demand channels, and quantifies the extra prediction obtained by accounting for intermediates with respect to a traditional value added model. In the previous section final demand channels were completely shut down, hence a value added model would have simply predicted no reallocation: what the framework in gross output accounted for was essentially an extra prediction with respect
to a value added model. In this section, a value added model is capable of predicting a positive labor reallocation through the change in final uses shares, hence the comparison becomes more meaningful. In what follows, I first modify the accounting model to allow for the traditional final demand channels, then calibrate it in this more complicated setting and finally replicate the results of the previous section.
1.5.1 Back to the Accounting Model: Preferences
As pointed out in the introduction, two main channels have been proposed in the structural transformation literature to model the evolution of consumption shares: income effects due to nonhomothetic preferences as in the “utility-based” explanation or substitution effects due to differential productivity growth across sectors as in the “technological” explanation. The main purpose of modeling the evolution of consumption shares is to show that the contribution of sectoral linkages, and of outsourcing in particular, is not negligible even when the standard channels in the literature are present. There is no strong reason to choose one explanation versus the other, but the “technological” approach is adopted here because it is closer to the spirit of this paper and, as pointed out by Ngai and Pissarides (2007), it maintains the independence between parameters of preferences and technologies. Moreover it is more conservative in the number of parameters that need to be estimated, in fact, only the elasticity of substitution is needed while everything else is directly observable.
Consumers take the sector prices Pj as given and maximize their period utility subject to their budget constraint as follows:
max {Cj}Jj=1
J X
j=0
ψjC
−1 j −1 s.t. J X j=0
PjCj ≤wL (1.14)
where ψj > 0 and PJj=0ψj = 1 . >0 represents the elasticity of substitution across sectoral goods. The optimal consumption of each sectoral good is given by:
Cj =
ψjPj−wL
P1− (1.15)
where P =
PJ
j=0ψjP1
− j
1−1
is the aggregate price index. It is possible to define the con-sumption (or final uses) expenditure share of each sector j as follows:
Xj =
PjCj
wL =ψ
j Pj P 1− (1.16)
time subscripts, the new variable is defined as follows:
xjt =
Xjt
Xmt =
ψj
ψm
Pjt
Pmt 1−
(1.17)
And its logarithmic growth rate, ˆxjt, is simply: ˆ
xjt =ln(xjt)−ln(xjt−1) = (1−)( ˆPjt−Pˆmt) (1.18) Given the absence of capital and investment in this economy, the previous expressions hold for any sector j, including manufacturing for which the growth rate is obviously zero and xmt is always equal to one, at any timet. Exactly as inNgai and Pissarides(2007), if the elasticity of substitution across composite goods is less than one, the consumption expenditure share expands in sectors with relatively high price growth rates. The opposite holds true if the elasticity is larger than one; and there is no change in consumption shares if the elasticity is exactly equal to one. Given that the sectoral price indexes can be obtained from the data, equation (1.18) is all one needs to get the evolution of the consumption expenditure ratios over time. At each point in time, the sectoral consumption expenditure share, defined in (1.16), can be obtained as follows:
Xjt =
xjt PJ
k=0xkt
(1.19)
These shares can then be plugged into equation (1.12) to get the labor shares.
1.5.2 Calibration
When final uses shares are allowed to vary over time, the calibration procedure is a bit more in-volved. I calculate the final uses ratios relative to manufacturing using (1.17) and their evolution over time using equation (1.18). It is evident from the latter equation that the extra information needed are the sectoral price growth rates and the value of the elasticity of substitution. The latter is set to 0.5, as inBuera and Kaboski(2009). Although there is no final consensus in the literature about the value of this key parameter,= 0.5 seems a sensible choice given that it is in between the unitary elasticity case often used in the “utility-based” structural transformation literature30 and the Leontief preferences case ( = 0), which is obtained by Herrendorf et al. (2013b) by minimizing the distance between the expenditure shares predicted by their model and the data. This choice is not far from the value of 0.4 found byDuarte and Restuccia(2010) by matching the share of hours in manufacturing over time and the annualized growth rate of aggregate productivity; and it is slightly smaller than the value of 0.76 found byAcemoglu and Guerrieri (2008) in a two-sector model of high versus low capital intensive industries. Notice that keeping final uses shares constant over time is equivalent to setting the elasticity of substi-tution to 1. With a unitary elasticity, households use a constant share of their income on each good, and there is no change in final uses shares, as equation (1.18) shows. The results in the
30
This strand of the literature usually uses “Stone-Geary” preferences, as, for instance, inCaselli and Coleman II (2001) and inKongsamut et al.(2001) .
previous section precisely correspond to this case.
In order to evaluate the empirical contribution of accounting for interm