R E S E A R C H A R T I C L E
Open Access
Validation of a case definition for
depression in administrative data against
primary chart data as a reference standard
Chelsea Doktorchik
1*, Scott Patten
1,2, Cathy Eastwood
1, Mingkai Peng
1, Guanmin Chen
1, Cynthia A. Beck
2,
Nathalie Jetté
1,3, Tyler Williamson
1and Hude Quan
1Abstract
Background:Because the collection of mental health information through interviews is expensive and time consuming, interest in using population-based administrative health data to conduct research on depression has increased. However, there is concern that misclassification of disease diagnosis in the underlying data might bias the results. Our objective was to determine the validity of International Classification of Disease (ICD)-9 and ICD-10 administrative health data case definitions for depression using review of family physician (FP) charts as the reference standard.
Methods:Trained chart reviewers reviewed 3362 randomly selected charts from years 2001 and 2004 at 64 FP clinics in Alberta (AB) and British Columbia (BC), Canada. Depression was defined as presence of either: 1) documentation of major depressive episode, or 2) documentation of specific antidepressant medication prescription plus recorded depressed mood. The charts were linked to administrative data (hospital discharge abstracts and physician claims data) using personal health numbers. Validity indices were estimated for six administrative data definitions of depression using three years of administrative data.
Results:Depression prevalence by chart review was 15.9–19.2% depending on year, region, and province. An ICD administrative data definition of‘2 depression claims with depression ICD codes within a one-year window OR 1 discharge abstract data (DAD) depression diagnosis’had the highest overall validity, with estimates being 61.4% for sensitivity, 94.3% for specificity, 69.7% for positive predictive value, and 92.0% for negative predictive value. Stratification of the validity parameters for this case definition showed that sensitivity was fairly consistent across groups, however the positive predictive value was significantly higher in 2004 data compared to 2001 data (78.8 and 59.6%, respectively), and in AB data compared to BC data (79.8 and 61.7%, respectively).
Conclusions:Sensitivity of the case definition is often moderate, and specificity is often high, possibly due to
undercoding of depression. Limitations to this study include the use of FP charts data as the reference standard, given the potential for missed or incorrect depression diagnoses. These results suggest that that administrative data can be used as a source of information for both research and surveillance purposes, while remaining aware of these limitations.
Keywords:Depression, Depressive disorder, Surveillance, Case definitions, Administrative data, International disease classification, Health information
* Correspondence:[email protected]
1Department of Community Health Sciences, Cumming School of Medicine, University of Calgary, TRW Building 3rd Floor 3280 Hospital Drive NW, Calgary, AB T2N 4Z6, Canada
Full list of author information is available at the end of the article
Background
Depression is a mood disorder, with symptoms such as sadness, fatigue, loss of interest, and loss of appetite [1]. In Canada, the one-year prevalence of Major Depressive Dis-order (a common form of depression) was 3.9% [2]. Cur-rently, detection of depression in primary care in Canada is low [3]. One report found that sensitivity of detection by primary care physicians is 50.1%, and specificity is 81.3% [3]. Sensitivity of detection has been reported to be as low as 36.4% among non-psychiatric physicians [4]. Further, physicians only record a diagnosis of depression in 17.6–33.6% of cases [5,6], which likely reduces the de-tection of depression in primary care records and EMR data. Use of population-level surveillance data may im-prove detection, documentation, prevention, and manage-ment of depression in the Canadian population.
Administrative data include diagnostic and procedural codes obtained from encounters with the healthcare system, including physician visits, prescriptions, and surgeries/pro-cedures [7]. Specifically, discharge abstract data includes coded data using the International Classification of Disease, version 10-Canadian version (ICD-10-CA), demographic in-formation, and clinical information about patient hospital discharges [8]. Importantly, the coded portion of the data includes the main condition diagnosis, and any secondary conditions that were also treated during their inpatient stay. Physician claims data includes information on the physi-cians, service utilization and demographics of their patients, and physician payment information [8]. Administrative data provide population-level information that have been used as a surveillance tool for chronic diseases [9]. As these data are routinely collected, they provide a cost-effective and efficient method for chronic disease surveillance in the Canadian population [9]. However, there is a need to develop and validate case definition algorithms of depression in adminis-trative data.
Various case definitions of chronic diseases, includ-ing hypertension [10], diabetes mellitus [11], chronic kidney disease [12], epilepsy [13], have been validated using Canadian administrative data. Various studies have assessed the quality of administrative databases in Canada, many of which are summarized in a scop-ing review by Hinds and colleagues (2017). However, this review found that few studies validated methods to identify mental illness in administrative data [14]. These previous studies show that the validity of case definition algorithms vary in administrative data, with sensitivities ranging from 19.4–99.3%, and specificities ranging from 84.2–97.2%. In a recent study using Canadian administrative data, case definitions for de-pression were found to be sub-optimal (with sensitiv-ities ranging from 28.9–35.6%) [15]. This emphasizes the need to optimize case definitions for depression in administrative data, and also to assess their validity
so that strengths and weaknesses of the case defini-tions can be accounted for in its applicadefini-tions.
This study aimed to validate and compare the accuracy of several case definitions for depression using adminis-trative health data from two Canadian provinces, com-pared to a reference standard of family physician (FP) chart reviews. The case definitions were from the 9th and 10th versions of the International Classification of Disease (ICD). Further, this study aimed to test the vari-ation in the validity of the optimal case definition by stratifying by region, time period (2001 and 2004), prov-ince and patient sex, age, and comorbidities.
Methods
Recruitment of FPs and selection of patients
The methods used for the selection and collection of FP charts have been previously described in detail else-where. [10].
Chart data collection and defining depression
Five trained individuals extracted data from randomly se-lected patient charts at FP clinics. Eligible patient charts included patients≥35 years of age, who were alive during the study years, living in the provinces of AB or BC during the 2-year period before the study years (2001 and 2004), and who had at least 2 visits to a FP physician during the study years [10]. Training of the chart reviewers consisted of reviewing ten charts together, and coming to consensus on whether the patient had depression or not based on the definition below. Reviewers extracted other patient in-formation, including demographics, medications, and co-morbidities. Comorbid conditions were defined by Quan et al. (2005), and included stroke, dementia, diabetes mel-litus, dyslipidemia, coronary artery disease, peripheral vas-cular disease, congestive heart failure, chronic pulmonary disease, asthma, cancer, chronic kidney disease, hyperten-sion, and dialysis [16].
any of the following were stated on the chart: (1) clinic notes indicated that the patient had only a depressed mood (rather than a diagnosis of MDE) but was not tak-ing any of the previously listed medications; (2) patients with only a depressed mood (rather than a diagnosis of MDE) were taking a medication from this list, but it was clearly prescribed for a reason other than depression (e.g. for chronic pain, fibromyalgia, or neuropathic pain); (3) the patient was diagnosed with manic depression; or (4) the patient was diagnosed with bipolar disorder (i.e., manic depression).
Defining depression using administrative data
Discharge abstract data, including main conditions, sec-ondary conditions, and procedures, are recorded by Health Information Management (HIM) coding profes-sionals and submitted to hospital administration and the Canadian Institute for Health Information (CIHI). Fam-ily practice physicians who are fee-for-service submit claims by documenting codes for patient conditions and procedures. These claims are submitted to the National Physician Database in Canada. To obtain administrative data, three databases were used (population registries, hospital discharge abstracts from AB between 1999 and 2004, and physician fee-for-service claims in AB and BC, both rural and urban, in both 2001 and 2004). We used discharge abstract data and claims data to capture both inpatient and outpatient points of service, to potentially enhance the validity of a case definition. The administra-tive data were linked to the FP office chart data using personal health numbers. The population registry data-base was used to obtain patient demographics, place of residence, death, and migration during the study period. This registry includes almost all AB and BC residents, as the Canadian healthcare insurance system is universal.
Discharge abstract data include inpatient discharges and deaths in AB and BC. ICD-9 CM codes were used for the years 1999, 2000, and 2001; ICD-10 codes were used in 2002, 2003, and 2004. ICD-9 CM and ICD-10 codes were used to identify patients with depression in the administrative data (ICD-9 CM codes: 296.2, 296.3, 296.5, 300.4, 309.x, and 311; ICD-10 codes: F20.4, F31.3-F31.5, F32.x, F33.x, F34.1, F41.2, and F43.2). These are the same ICD-9 CM and ICD-10 coding algorithms used to define depression as an Elixhauser comorbidity in administrative data by Quan and colleagues [16]. In the case of multiple diagnoses coded for a patient from the discharge summary (which becomes the discharge abstract database), we considered all diagnoses regard-less of whether depression was the primary“main” con-dition, or a comorbid condition. The case definitions used to define depression in administrative data were as follows: (1) 1 physician claims within a three-year win-dow (2) 2 physician claims within a 1 year winwin-dow (3) 2
physician claims within a 2 year window (4) 2 physician claims within a 3 year window (5) 1 depression diagnosis from hospital discharge abstract data (DAD) and (6) 2 physician claims within a 1 year window or 1 DAD diagnosis.
Statistical analysis
Demographic (age, sex, and region) and comorbidity var-iables were calculated and examined using descriptive statistics. For each of the six case definitions generated, each of the following parameters was calculated: sensi-tivity, specificity, positive predictive value (PPV), and negative predictive value (NPV). The chart data were used as a reference standard. For each parameter, a 95% confidence interval (CI) was calculated. These values were stratified by region, year, province, age, sex, and the presence of comorbidities.
Results
Characteristics of the study sample
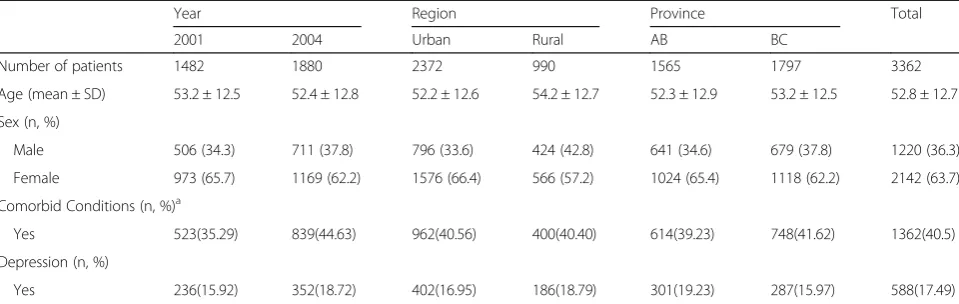
A total of 3362 charts were reviewed at 64 FP clinics. The prevalence of depression in the sample based on chart review ranged from 15.9 to 19.2%, depending on the year (2001 or 2004), region (urban or rural), and province (AB or BC) (Table1). The mean age of patients ranged from 52.2 to 54.2, and there were consistently more female (57.2–66.4%) than male (33.6–42.8%) pa-tients. At least one of the assessed comorbidities was re-corded for 35.3 to 44.6% of patients.
Determining a valid case definition for depression
one year was selected as the valid case definition, as it was clinically feasible to implement, and demonstrated high validity (particularly the PPV).
Validity of the case definitions assessing two depres-sion claims were similar, regardless of whether the claims were made within a one, two, or three year period. However, one depression claim within three years had a lower specificity and PPV compared to the definitions using two claims (86.5, 95% CI 85.2, 87.8%; and 55.4, 95% CI 51.9, 58.8% respectively), however the sensitivity was slightly higher in comparison (78.9, 95% CI 75.4, 82.1%). One DAD diagnosis had a very low sen-sitivity (5.3, 95% CI 3.6, 7.4%), but a high specificity and PPV (99.6, 95% CI 99.3, 99.8%; 75.6, 95% CI 59.7, 87.6% respectively), in comparison to the other the case definitions.
Stratification of validity
The validity for the case definition of two depression claims within one year, or one DAD diagnosis was strati-fied according to region, year, province, sex, age, and the presence of one or more comorbidities (Table3). Preva-lence of depression in administrative data was compared to the prevalence in the FP office chart data. The preva-lence estimate of depression appeared to be higher in chart data for almost all groups, with the exception of the year 2001 the province BC. The prevalence of
depression in chart data contrasted to prevalence in ad-ministrative data, as the chart data showed that depres-sion appeared higher in rural vs. urban populations (18.8% vs. 16.9%), higher in the year 2004 vs. 2001 (18.7% vs. 15.9%), in AB vs. BC (19.2% vs. 16.0%), and in those with comorbidities vs. those without comorbidities (18.2% vs. 17.0%).
Discussion
The sensitivities of various administrative data defini-tions of depression in this study ranged from 5.3–78.9%, indicating a suboptimal ability for these case definitions to correctly classify those patients who have FP-chart de-fined depression in administrative data. The optimal case definition found in this study was “two depression claims within one year or one DAD depression diagno-sis,” which had a moderate level of sensitivity at 61.4% (95% CI 57.3, 65.4%), and a high level of specificity at 94.3% (95% CI 93.4, 95.2%). Similar to the current study, Fiest et al. found that sensitivities of depression case def-initions in their administrative data were low (ranging from 28.9–35.6%) [15]. We suspect that the difficulty in correctly identifying depression in healthcare has led to high misclassification and poor sensitivity when develop-ing case definitions usdevelop-ing administrative data.
[image:4.595.58.538.99.251.2]The moderate level of sensitivity when using the case definition“two depression claims within one year or one Table 1Characteristics of Study Sample
Year Region Province Total
2001 2004 Urban Rural AB BC
Number of patients 1482 1880 2372 990 1565 1797 3362
Age (mean ± SD) 53.2 ± 12.5 52.4 ± 12.8 52.2 ± 12.6 54.2 ± 12.7 52.3 ± 12.9 53.2 ± 12.5 52.8 ± 12.7
Sex (n, %)
Male 506 (34.3) 711 (37.8) 796 (33.6) 424 (42.8) 641 (34.6) 679 (37.8) 1220 (36.3)
Female 973 (65.7) 1169 (62.2) 1576 (66.4) 566 (57.2) 1024 (65.4) 1118 (62.2) 2142 (63.7)
Comorbid Conditions (n, %)a
Yes 523(35.29) 839(44.63) 962(40.56) 400(40.40) 614(39.23) 748(41.62) 1362(40.5)
Depression (n, %)
Yes 236(15.92) 352(18.72) 402(16.95) 186(18.79) 301(19.23) 287(15.97) 588(17.49)
a
Comorbidity includes stroke, dementia, diabetes mellitus, dyslipidemia, coronary artery disease, peripheral vascular disease, congestive heart failure, chronic pulmonary disease, asthma, cancer, hypertension, chronic kidney disease, and dialysis
Table 2Validity of Different Administrative Data Depression Case Definition Compared with Chart Data
Administrative Data Case Definition Sensitivity %
(95% CI)
Specificity % (95% CI)
PPV % (95% CI)
NPV % (95% CI)
1 depression claim within 3 years 78.9 (75.4, 82.1) 86.5 (85.2, 87.8) 55.4 (51.9, 58.8) 95.1 (94.2, 95.9)
2 depression claims within 1 year 60.7 (56.6, 64.7) 94.4 (93.5, 95.2) 69.7 (65.5, 73.7) 91.9 (90.8, 92.9)
2 depression claims within 2 years 62.9 (58.9, 66.8) 93.8 (92.8, 94.7) 68.3 (64.2, 72.2) 92.3 (91.2, 93.2)
2 depression claims within 3 years 63.4 (59.4, 67.3) 93.7 (92.8, 94.6) 68.2 (64.1, 72.1) 92.4 (91.3, 93.3)
1 depression diagnosis from hospital discharge data 5.3 (3.6, 7.4) 99.6 (99.3, 99.8) 75.6 (59.7, 87.6) 83.2 (81.9, 84.5)
[image:4.595.57.542.624.732.2]DAD depression diagnosis” in administrative data may be due to issues of undercoding of depression by physi-cians in claims data, and the healthcare data captured by administrative data. Approximately 94% of physicians record only one code per claim [17]; we suspect that mental illnesses are coded less often when patients also present with comorbidities (e.g., when a patient presents with both diabetes and depression, physicians tend to code for diabetes only). This has shown to also be the case in DAD data, where coding validity decreases when another condition is present [18]. Coding of conditions in discharge abstracts increases when the patient’s condi-tion is clinically important and complex [18]. Further, the issue of undercoding may be due to stigma associ-ated with mental illness. Stigma associassoci-ated with depres-sion can lead to patients avoiding the mental health care system. This can be due to patients not believing that treatment will benefit them, a lack of knowledge about treatment of depression, lack of knowledge about acces-sing treatment, and believing that they will be prejudiced or discriminated against [19, 20]. Further, administrative data may not include enough sources of healthcare data to capture all the patients with depression. Including additional data sources should be used to improve sensi-tivity of administrative data, including prescription data, electronic medical records (e.g., Alberta Netcare), psy-chiatric specialist data, the National Ambulatory Care
Reporting System (NACRS), mental health data from clinics, and private psychologist data.
[image:5.595.55.543.99.373.2]The comparator group of this study (physician chart review) is our limitation and may also have issues of moderate sensitivity. This may be because depression is difficult to diagnose in clinical settings. In one primary care study, physicians correctly identify depression in 47.3% of actual cases, resulting in 50.1% sensitivity and 81.3% specificity [6]. Only 33.6% of these physicians cor-rectly recorded that their patient had depression in their patient medical records [6]. A systematic review and meta-analysis supported this evidence, and found that the sensitivity of identification of depression by non-psychiatric physicians was only 36.4% (95% CI 27.9–44.8%) [4]. In primary care settings, variable detec-tion of depression could arise from any of the following: 1) patients with a clearer presentation of symptoms are easier to detect; 2) those patients with more severe de-pression are more likely to be diagnosed compared to mild forms of depression; 3) consultation time for com-plex patients could compromise the accuracy of the diagnosis; and 4) a stronger relationship between the physician and patient, as well as 5) a physician with more experience in medicine, is associated with better detection of depression [6]. Suboptimal sensitivity in pri-mary care, as well as incomplete documentation of de-pression in medical records, can reduce the sensitivity of Table 3Validity for a Case Definition Stratified by Region, Year, Province, and Patient Characteristicsa
N Prevalence Admin Data (%)
Prevalence Chart Data (%)
Sensitivity (%) (95% CI)
Specificity (%) (95% CI)
PPV (%) (95% CI)
NPV (%) (95% CI)
Region
Rural 990 14.9 18.8 58.6 (51.2, 65.8) 95.2 (93.4, 96.5) 73.7 (65.8, 80.5) 90.9 (88.7, 92.7)
Urban 2372 15.6 16.9 62.7 (57.8, 67.4) 94.0 (92.9, 95.0) 68.1 (63.1, 72.8) 92.5 (91.3, 93.6)
Year
2001 1482 16.5 15.9 61.9 (55.3, 69.1) 92.1 (90.4, 93.5) 59.6 (53.2, 65.8) 92.7 (91.1, 94.1)
2004 1880 14.5 18.7 61.1 (55.8. 66.2) 96.2 (95.1, 97.1) 78.8 (73.4, 83.5) 91.5 (90.0, 92.8)
Province
AB 1565 14.6 19.2 60.5 (54.7, 66.0) 96.4 (95.2, 97.3) 79.8 (74.0, 84.8) 91.1 (89.4, 92.6)
BC 1797 16.1 16.0 62.4 (56.5, 68.0) 92.7 (91.2, 93.9) 61.7 (55.9, 67.4) 92.8 (91.4, 94.1)
Sex
Female 2142 17.6 20.4 61.2 (56.5, 65.8) 93.6 (92.3, 94.7) 70.8 (66.0, 75.4) 90.4 (89.0, 91.8)
Male 1220 11.6 12.5 61.8 (53.6, 69.6) 95.6 (94.2, 96.8) 66.7 (58.2, 74.4) 94.6 (93.1, 95.9)
Age (years)
<65 2709 17.0 19.1 61.4 (57.1, 65.6) 93.5 (92.4, 94.5) 69.0 (64.5, 73.2) 91.1 (89.9, 92.3) ≥65 653 8.7 10.7 61.4 (49.0, 72.8) 97.6 (96.0, 98.7) 75.4 (62.2, 85.9) 95.5 (93.5, 97.0) Comorbid Presenceb
Yes 1362 15.1 18.2 58.9 (52.5, 65.1) 94.6 (93.1, 95.9) 70.9 (64.2, 77.0) 91.2 (89.4, 92.8)
No 2000 15.6 17.0 63.2 (57.9, 68.4) 94.2 (92.9, 95.2) 68.9 (63.5, 74.0) 92.6 (91.2, 93.8)
a
Stratified analysis used the case definition“2 claims within 1 year or 1 hospital discharge data diagnosis”in 3- year administrative data
b
case definitions in administrative data. To demonstrate these issues, Canuto and colleagues found that the agreement between psychiatrists and other physicians in diagnosing depression was 40% [21]. Agreement levels increased when the patients presented with severe de-pressive symptoms, and if they had a more open person-ality with lower levels of neuroticism. These personperson-ality types likely are more understanding of the importance of medical care and maintaining mental well-being [22]. These findings underscore the low agreement between physicians, and the low sensitivity of diagnosing depres-sion in primary care settings [4]. Future research should focus on improving identification and documentation of depression in primary care settings.
In the present study, we found negligible differences in measures of validity between different time frames. For example, there were negligible differences in measures of validity between having one depression claim within six months, versus having one depression claim within three years. This may be due to the characteristics of the study sample(i.e., patients with depression). Individuals with de-pression have been shown to be frequent users of the healthcare system (e.g., general practitioners, emergency departments, and psychiatric specialists) [23,24]. Further, patients with poor mental health are 1.70 times more likely to use the emergency department (95% CI 1.42, 2.02) [23]. This evidence was supported by Byrne et al., who discovered that patients with poorer mental health were frequent users of other healthcare services (not just the emergency department), and should be considered a vulnerable population that have greater healthcare service needs [24]. Depressed patients who are frequent users of the healthcare system will be captured in the first case def-inition (one claim within six months). Thus, we chose to eliminate case definitions that had six-month intervals, and chose only to evaluate one, two, and three year win-dows. Further, we chose a final case definition that was practical to implement in healthcare, as the difference in validity between time frames was negligible regardless. We selected the case definition of two depression claims within a one-year window with a DAD diagnosis, as a one-year time frame is easier to implement and calculate an annual prevalence rate.
To create an appropriate case definition for depression in administrative data, a depression diagnosis in DAD was included in some definitions. Including one DAD diagno-sis in the case definition did not significantly increase the validity of the case definition. However, patients captured in DAD tend to have poorer health compared to those found in claims data, as DAD includes hospital inpatient discharges, as well as day surgery interventions [8]. These patients have a higher prevalence of mental illness includ-ing depression from previous diagnoses, compared to claims data, which typifies a population with more severe
conditions. Using DAD alone to develop a depression case definition would result in suboptimal validity, as DAD un-derreports comorbidities such as depression [25]. It is also possible that DAD diagnoses alone are biased. For ex-ample, in the case of diabetes mellitus, many patients are managed in outpatient clinics, and the severity of disease can be vastly different when comparing inpatients and outpatients [11, 26]. Ultimately, including a depression DAD diagnosis in the case definition would not signifi-cantly impact the surveillance of depression, as the sensi-tivity is so low in this database. However, if this group of sicker patients were not captured by the proposed case definition, use of this definition in health services outcome research would underestimate risk factor associations. Thus, DAD is important to include in the case definition for administrative data to improve its application.
The current study provides a case definition for depres-sion in administrative data with a moderate level of valid-ity. However, limitations remain with using administrative data. The reference standard used in this study (i.e., phys-ician chart reviews from primary care settings) itself has a moderate level of sensitivity, making it a suboptimal com-parator. Further, the administrative data used for the current study include population registries, hospital dis-charge abstracts, and physician fee-for-service claims. The claims data were collected from specialist referrals, and the validity of the case definition is compared to physician chart reviews. Thus, this study compared data from two different sources, which can result in moderate sensitivity.
nondifferential. In the case of analytic studies assessing out-comes of depression (e.g., mortality), the moderate fre-quency of false negative cases resulting from the case definition will misclassify depressed patients as not being depressed. This may cause the control group to appear sicker, and vice versa, diluting the measure of association found in the study, and understating the true measure of as-sociation that is representative of the population.
Conclusion
Administrative data is primarily used for disease surveil-lance and reporting by the Canadian Institute for Health Information and is increasingly used in research. It is a source of data that offers national coverage of population-level data. By improving the quality of admin-istrative data, researchers can readily use this source of data with a confidence in its accuracy, and disease/mortal-ity surveillance can correctly reflect prevalence of disease and mortality rates for global comparison and monitoring. Consistency when coding depression using ICD-9 CM and ICD-10 can improve the sensitivity of administrative data. Although this research was conducted using Canad-ian administrative data, other countries are able to carry out similar validation studies of chronic disease case defi-nitions using large population-level surveillance data. For example, the United States has access to databases such as the Veterans Health Administration healthcare system. While this study provides an example of developing a case definition for depression, caution should be exercised when using this case definition for surveillance and ana-lytic research purposes. Efforts should be made to improve the coding of depression in administrative data. The current study can set an example for future research in other regions or countries that have access to population-level healthcare surveillance databases.
The case definition “two depression claims within one year or one DAD diagnosis”can be used for depression in administrative data, and results in a moderate level of sen-sitivity with a high specificity. While this case definition can be used to identify depression from these administra-tive data sources in Alberta and British Columbia, they are limited to these data sources, and to the diagnosis of depression only. Validity will vary, depending on the ad-ministrative data source used in different contexts, and the disease that is being identified. Validity of unique data sources and different diseases should be assessed prior to using the data for research and administrative purposes.
Abbreviations
AB:Alberta; BC: British Columbia; CI: Confidence Interval; DAD: Hospital Discharge Abstract Data; FP: Family Physician; ICD: International Classification of Disease; MDE: Major Depressive Episode; NACRS: National Ambulatory Care Reporting System; NPV: Negative Predictive Value; PPV: Positive Predictive Value
Acknowledgements
Not applicable.
Funding
No funding was provided for this study.
Availability of data and materials
The datasets used and/or analysed during the current study are available from the corresponding author on reasonable request.
Authors’contributions
CD drafted and edited the manuscript and interpreted results; SP guided the drafting of the manuscript and interpretation of results; CE guided the drafting of the manuscript and interpretation of results; MP analyzed the data; GC assisted MP with analysis of the data; CB compiled the data and tables in the manuscript and helped HQ create the idea for the study; NJ edited the manuscript and helped create the tables; TW assisted GC and MP with the analysis and interpretation of the results; and HQ oversaw the study, created the idea for the study, and guided the writing of the manuscript. All authors have read and approved of the manuscript.
Ethics approval and consent to participate
This study was conducted as course-based research in administrative data methodology and was approved by the University of Calgary Conjoint Health Research Ethics Board (REB13–0760). Although sensitive information was presented in the data, it was anonymized by removing any information identifying the patient (i.e., personal health number), prior to being given to any individuals on the research team. As such, it was not feasible or necessary to obtain consent from each participant.
Consent for publication
Not applicable.
Competing interests
The authors declare that they have no competing interests.
Publisher’s Note
Springer Nature remains neutral with regard to jurisdictional claims in published maps and institutional affiliations.
Author details
1Department of Community Health Sciences, Cumming School of Medicine, University of Calgary, TRW Building 3rd Floor 3280 Hospital Drive NW, Calgary, AB T2N 4Z6, Canada.2Department of Psychiatry, Cumming School of Medicine, University of Calgary, 1403-29 Street NW, Calgary, AB T2N 2T9, Canada.3Department of Clinical Neurosciences, Cumming School of Medicine, University of Calgary, 1403 29 Street NW, Calgary, AB T2N 2T9, Canada.
Received: 6 March 2017 Accepted: 18 December 2018
References
1. Depression. 2016. [http://www.who.int/topics/depression/en/]. Accessed October 2016.
2. Patten SB, Williams JVA, Lavorato DH, Wang JL, McDonald K, Bulloch AGM. Descriptive epidemiology of major depressive disorder in Canada in 2012. Can J Psychiatry. 2015;60(1):23–30.
3. Craven MA, Bland R. Depression in primary care: current and future challenges. Can J Psychiatry. 2013;58(8):442–8.
4. Cepoiu M, McCusker J, Cole MG, Sewitch M, Belzile E, Ciampi A. Recognition of depression by non-psychiatric physicians—a systematic literature review and meta-analysis. J Gen Intern Med. 2008;23(1):25–36.
5. Smolders M, Laurant M, Verhaak P, Prins M, van Marwijk H, Penninx B, Wensing M, Grol R. Adherence to evidence-based guidelines for depression and anxiety disorders is associated with recording of the diagnosis. Gen Hosp Psychiatry. 2009;31(5):460–9.
6. Mitchell AJ, Vaze A, Rao S. Clinical diagnosis of depression in primary care: a meta-analysis. Lancet. 2009;374(9690):609–19.
8. Discharge abstract database (DAD) Metadata. 2016. [https://www.cihi.ca/en/ types-of-care/hospital-care/acute-care/dad-metadata]. Accessed Dec 2016. 9. Use of administrative data. 2015. [http://www.statcan.gc.ca/pub/12-539-x/
2009001/administrative-administratives-eng.htm]. Accessed Oct 2016. 10. Quan H, Khan N, Hemmelgarn BR, Tu K, Chen G, Campbell N, Hill MD, Ghali
WA, McAlister FA. Validation of a case definition to define hypertension using administrative data. Hypertension. 2009;54(6):1423–8.
11. Chen G, Khan N, Walker R, Quan H. Validating ICD coding algorithms for diabetes mellitus from administrative data. Diabetes Res Clin Pract. 2010; 89(2):189–95.
12. Ronksley PE, Tonelli M, Quan H, Manns BJ, James MT, Clement FM, Samuel S, Quinn RR, Ravani P, Brar SS. Validating a case definition for chronic kidney disease using administrative data. Nephrology Dialysis Transplantation. 2012; 27(5):1826–31.
13. Reid AY, Germaine-Smith CS, Liu M, Sadiq S, Quan H, Wiebe S, Faris P, Dean S, Jetté N. Development and validation of a case definition for epilepsy for use with administrative health data. Epilepsy Res. 2012;102(3):173–9. 14. Hinds A, Lix LM, Smith M, Quan H, Sanmartin C. Quality of administrative
health databases in Canada: a scoping review. Can J Public Health. 2016; 107(1):56–61.
15. Fiest KM, Jette N, Quan H, St Germaine-Smith C, Metcalfe A, Patten SB, Beck CA. Systematic review and assessment of validated case definitions for depression in administrative data. BMC Psychiatry. 2014;14:289. 16. Quan H, Sundararajan V, Halfon P, Fong A, Burnand B, Luthi J-C, Saunders LD,
Beck CA, Feasby TE, Ghali WA. Coding algorithms for defining comorbidities in ICD-9-CM and ICD-10 administrative data. Med Care. 2005:1130–9.
17. Cunningham CT, Cai P, Topps D, Svenson LW, Jetté N, Quan H. Mining rich health data from Canadian physician claims: features and face validity. BMC research notes. 2014;7(1):682.
18. Peng M, Southern DA, Williamson T, Quan H. Under-coding of secondary conditions in coded hospital health data: impact of co-existing conditions, death status and number of codes in a record. Health informatics journal. 2016;1460458216647089:260–7.
19. Schomerus G, Angermeyer MC. Stigma and its impact on help-seeking for mental disorders: what do we know? Epidemiologia e Psichiatria Sociale. 2008;17(1):31–7.
20. Thornicroft G. Stigma and discrimination limit access to mental health care. Epidemiologia e psichiatria sociale. 2008;17(01):14–9.
21. Canuto A, Gkinis G, DiGiorgio S, Arpone F, Herrmann FR, Weber K. Agreement between physicians and liaison psychiatrists on depression in old age patients of a general hospital: influence of symptom severity, age and personality. Aging Ment Health. 2015;20:1–7.
22. Seekles WM, Cuijpers P, Van de Ven P, Penninx B, Verhaak PFM, Beekman ATF, Van Straten A. Personality and perceived need for mental health care among primary care patients. J Affect Disord. 2012;136(3):666–74. 23. Hunt KA, Weber EJ, Showstack JA, Colby DC, Callaham ML. Characteristics of
frequent users of emergency departments. Ann Emerg Med. 2006;48(1):1–8. 24. Byrne M, Murphy AW, Plunkett PK, McGee HM, Murray A, Bury G. Frequent
attenders to an emergency department: a study of primary health care use, medical profile, and psychosocial characteristics. Ann Emerg Med. 2003; 41(3):309–18.
25. Powell H, Lim LLY, Heller RF. Accuracy of administrative data to assess comorbidity in patients with heart disease: an Australian perspective. J Clin Epidemiol. 2001;54(7):687–93.