Rivera-Calzada, A. and Fronzes, Remi and Savva, Christos G. and
Chandran, Vidya and Lian, Pei W. and Laeremans, T. and Pardon, E.
and Steyaert, J. and Remaut, Han and Waksman, Gabriel and Orlova,
Elena (2013) Structure of a bacterial type IV secretion core complex at
subnanometre resolution. The EMBO Journal 32 (8), pp. 1195-1204. ISSN
1460-4189.
Downloaded from:
Usage Guidelines:
Please refer to usage guidelines at
or alternatively
Structure of a bacterial type IV secretion core
complex at subnanometre resolution
Angel Rivera-Calzada
1, Re´mi Fronzes
2,
Christos G Savva
1, Vidya Chandran
1,
Pei W Lian
1, Toon Laeremans
3,4,
Els Pardon
3,4, Jan Steyaert
3,4,
Han Remaut
3,4, Gabriel Waksman
1,*
and Elena V Orlova
1,*
1Department of Biological Sciences, Institute of Structural and
Molecular Biology, UCL and Birkbeck, London, UK,2Institut Pasteur,
G5 ‘biologie structural de la se´cre´tion bacte´rienne’, UMR-CNRS 3528, Paris, France,3Structural Biology Brussels, Vrije Universiteit Brussel,
Brussels, Belgium and4Department of Structural Biology, Vlaams Instituut voor Biotechnologie, Brussels, Belgium
Type IV secretion (T4S) systems are able to transport DNAs and/or proteins through the membranes of bacteria. They form large multiprotein complexes consisting of 12 pro-teins termed VirB1-11 and VirD4. VirB7, 9 and 10 assemble into a 1.07 MegaDalton membrane-spanning core complex (CC), around which all other components assemble. This complex is made of two parts, the O-layer inserted in the outer membrane and the I-layer inserted in the inner membrane. While the structure of the O-layer has been solved by X-ray crystallography, there is no detailed struc-tural information on the I-layer. Using high-resolution cryo-electron microscopy and molecular modelling com-bined with biochemical approaches, we determined the I-layer structure and located its various components in the electron density. Our results provide new structural insights on the CC, from which the essential features of T4S system mechanisms can be derived.
The EMBO Journaladvance online publication, 19 March 2013; doi:10.1038/emboj.2013.58
Subject Categories:cell & tissue architecture; microbiology & pathogens
Keywords: core complex; cryo electron microscopy; pKM101; structure; type 4 secretion system
Introduction
Type IV secretion (T4S) systems are multiprotein complexes present in both Gram-negative and Gram-positive bacteria, and also in some archea (Alvarez-Martinez and Christie, 2009). This versatile system can translocate various substrates ranging from single to multimeric proteins and nucleoprotein complexes (Alvarez-Martinez and Christie, 2009). T4S systems can be subdivided into three main
groups based upon their function: (i) conjugation systems; (ii) DNA release or uptake systems; and (iii) effector translocation systems (Waksman and Fronzes, 2010). Conjugation systems mediate the transfer of DNA to recipient cells in a contact-dependent manner (Dreiseikelmann, 1994). These systems promote genome plasticity in bacteria and thus mediate rapid adaptive responses to changes in environment. They are also responsible for the spread of antibiotic-resistance genes among pathogenic bacteria (Wallden et al, 2010). T4S systems, mediating DNA release and uptake, also contribute to the expansion of genome diversity (Alvarez-Martinez and Christie, 2009). Finally, effector translocation systems deliver proteins into eukaryotic cells (Wallden et al, 2010). For example, Helicobacter pylori, the main causative agent of gastric ulcers and gastric adenocarcinoma, disrupts the homeostasis of the gastrointestinal tract via effectors secreted by the Cag T4S system (Terradot and Waksman, 2011); the plasmid pTi from Agrobacterium tumefaciens encodes the VirB/D T4S system, which is able to deliver an oncogenic DNA fragment named T-DNA into plant cells leading to crown gall disease (McCullen and Binns, 2006).
The most studied T4S systems are the VirB/D system from A. tumefaciens and the closely related systems from Escherichia coli encoded by the conjugative plasmids F, R388, pKM101 and RP4 (Alvarez-Martinez and Christie, 2009; Waksman and Fronzes, 2010). Protein components and the genetic organisation of the VirB/D T4S systems have high similarity across functionally diverse T4S systems, reflecting their evolutionary relationship (Lessl and Lanka, 1994). The VirB/D system consists of 12 proteins named VirB1–VirB11 and VirD4 that form a multi-protein envelope-spanning transport apparatus. Three cyto-plasmic ATPases associated with the inner membrane (IM), VirB11, VirD4 and VirB4, power substrate translocation and the assembly of the secretion system (Gomis-Ruthet al, 2001; Savvideset al, 2003; Hareet al, 2006; Waksman and Fronzes, 2010; Walldenet al, 2012). Three proteins (VirB3, VirB6 and VirB8) are likely to form an IM subcomplex. The extracellular pilus is composed of major and minor pilins, termed VirB2 and VirB5, respectively. Three proteins (VirB7, VirB9 and VirB10) form the ‘core complex’ (CC), a large central structure of the T4S system. This complex is inserted in both the outer (OM) and IMs, respectively, and plays a fundamental role as a scaffold for the rest of the T4S system components. Because of its central position, the complex participates actively in T4S substrate transfer through the bacterial envelope (Llosaet al, 2003; Atmakuri et al, 2004; Cascales and Christie, 2004a; Alvarez-Martinez and Christie, 2009; Jakubowski et al, 2009). Therefore, detailed structural knowledge of the CC architecture and function is essential to understand the mechanism of secretion by T4S systems.
The T4S system CC encoded by the pKM101 plasmid comprises 14 copies each of the three proteins TraN/VirB7,
*Corresponding authors. G Waksman or EV Orlova, Department of Biological Sciences, UCL and Birkbeck, Institute of Structural and Molecular Biology, Malet Street, London WC1E 7HX, UK. Tel.:þ44 (0)207 631 6833; Fax: þ44 (0)207 631 6803;
E-mail: [email protected] or Tel.:þ44 (0)207 631 6845; Fax:þ44 (0)207 631 6803; E-mail: [email protected]
Received: 1 November 2012; accepted: 19 February 2013
The EMBO Journal (2013),1–10 www.embojournal.org
EMBO
THE
EMBO
JOURNAL
THE
EMBO
TraO/VirB9 and TraF/VirB10. The first CC structure was solved by cryo-electron microscopy (cryo-EM) at 15 A˚ resolu-tion (Fronzeset al, 2009). The CC forms a cylindrical pore that consists of two layers: an outer layer (OL) and an inner layer (IL). The OL is inserted in the OM and is composed of full-length TraN/VirB7 and the C-terminal domains of TraO/ VirB9 and TraF/VirB10 (TraO/VirB9CT and TraF/VirB10CT,
respectively). The atomic structure of a truncated form of the pKM101 CC corresponding to the entire OL was solved at 2.6 A˚ resolution (Chandran et al, 2009). This structure revealed that TraF/VirB10CT lines the interior of the OL
while TraO/VirB9CT and TraN/VirB7 are at the periphery.
The OL inserts in the OM by forming a helical barrel made of 14 copies of a two-helix bundle from TraF/VirB10CT
(Chandran et al, 2009). The lipidated TraN/VirB7 anchors TraO/VirB9CTto the inner leaflet of the OM (Chandranet al,
2009; Fronzes et al, 2009). The IL is composed of the N-terminal domains of TraO/VirB9 and TraF/VirB10 (TraO/ VirB9NTand TraF/VirB10NT, respectively). The latter domain
contains the transmembrane (TM) region that anchors the CC to the IM.
Due to the low resolution of the first cryo-EM structure of the CC, it was not possible to accurately determine the structure and arrangement of TraO/VirB9NT and TraF/
VirB10NT within the IL. We report here the structure of a
truncated pKM101 CC that lacks the N-terminal part of TraF/ VirB10 at a subnanometre resolution of 8.5 A˚ using cryo-EM and single-particle analysis. We have also refined the
struc-ture of the full-length CC to 12.4 A˚ resolution. A comparison of these two structures and the utilisation of hybrid methods based upon ternary structure prediction and flexible fitting provide key insights into the structure of the OL in its native state, into the position and structure of the N-terminal domains of TraO/VirB9 and TraF/VirB10 in the IL and their links with the OL.
Results
Cryo-EM structure of a truncated pKM101 CC at 8.5 A˚ resolution
We have shown that the digestion of the full-length pKM101 CC (FLCC) (B1070 kDa) yields stable complexes suitable for structural analysis (Chandran et al, 2009; Fronzes et al, 2009). TraF/VirB10NT contains a proline-rich region and
most of this domain is predicted to be unstructured (Jakubowski et al, 2009). This domain is thus very susceptible to proteolysis. Digestion of the FLCC with elastase produced a stable truncated complex of around 880 kDa in molecular weight, termed the ‘CCelastase’
complex (Figure 1). The N-terminal sequencing of the two main bands in SDS-PAGE gels confirms that the complex is made of full-length TraO/VirB9 and the C-terminal domain of TraF/VirB10 starting at N161SPGA (the integrity of the C
terminus of TraF/VirB10CTwas confirmed by western blotting
analysis of the Strep-tag present at the C terminus of the TraF/ VirB10 construct). Therefore, the IL of this complex is only
Void peak
A
mAu
Elution volume (ml) 0
20 40 60 80 100 120
0.0 2.7 5.3 8.0 10.7 13.3 16.0 18.7 21.3 24.0
CCelastase (MW ~830 kDa)
OL (MW ~675 kDa) pKM101 CC
(MW ~1070 kDa)
C
TM SP
CTD CTD
B9BD
18 48
24 294
161 386
CCelastase
TraF/VirB10 TraO/VirB9 TraN/VirB7 SP
B
Std
50
30
20 15
10 160
-kDa pKM101 CC CC
elastase
TraF
TraO
TraN
TraF (N161SPGA)
TraO (L24EVGR)
[image:3.595.143.459.403.680.2]TraO (L24EVGR) TraO (F132IETP)
Figure 1 CCelastasepurification. (A) Schematic representation of the regions of TraN/VirB7, TraO/VirB9 and TraF/VirB10 present in the
CCelastasecomplex. Domains corresponding to the VirB9-binding domain (B9BD), the signal peptide (SP), the N-terminal TM helix and the
C-terminal domains (CTD) are shown in darker colours. (B) SDS–PAGE of the CCelastaseand the FLCC complexes. For the CCelastasecomplex, the
first aa in the bands identified using Edman degradation are indicated. The CCelastasecomplex is composed of three major bands: full-length
TraN/VirB7 and TraO/VirB9 and cleaved TraF/VirB10. In addition two minor byproducts are observed, both consisting of cleaved TraO/VirB9. Molecular weight standards (Std) are indicated. (C) Size exclusion chromatography of the CCelastasecomplex using a Superose 6 10/300 (GE
made of TraO/VirB9NT (Figure 1). The expected molecular
weight of a 14-mer for this new truncated complex is B830 kDa, which is very close to the measured molecular weight indicated above.
For structural analysis, samples of the CCelastasecomplex
were vitrified and imaged using a FEG F20 microscope (FEI) (Supplementary Figure 1a and Supplementary Information). The structure of the CCelastase complex was solved at 8.5 A˚
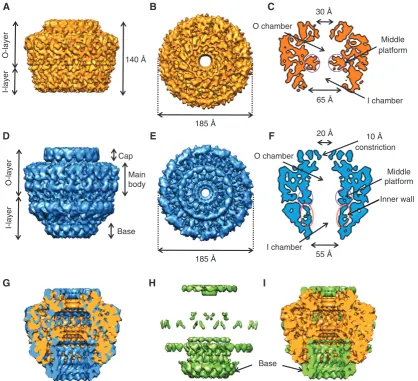
resolution (Figure 2A, B and C, and Supplementary Figure 1, see Materials and methods). This complex is 185 A˚ in dia-meter and 140 A˚ in height. The characteristic separation into the OL and IL is clearly seen in the map. The OL and IL are connected by thin short linkers. The OL and IL contain chambers that are separated by large protrusions spanning inward from the main wall at the level of the linkers and forming a middle platform (indicated in purple circles in Figure 2C). These protrusions narrow the passage within the complex toB30 A˚ diameter. The O chamber is capped at the top by a ring of density with a small central opening of
B20 A˚ in diameter while the IL chamber is widely open at the bottom with a diameter ofB65 A˚ . Interestingly, the thickness of the chamber walls varies significantly. In the OL, the thickness of the wall isB50 A˚ , whereas in the IL it isB30 A˚ .
Cryo-EM structure of the full-length pKM101 CC at 12.4 A˚ resolution
The previous structure of the FLCC was obtained at 15 A˚ resolution using cryo images (Fronzes et al, 2009). The resolution has been improved to 12.4 A˚ (Figure 2D, E and F; see Materials and methods and Supplementary Information). The overall dimensions of the refined structure are 185 A˚ in both height and diameter. The OL has an inner chamber that is open to the extracellular media through an opening ofB20 A˚ in the cap (Figure 2F). Interestingly, the refined FLCC structure reveals new features that were not apparent in the previous one (Figure 2D, E and F). This structure shows the presence of an inner cylindrical wall of B50–55 A˚ in diameter formed by 14 columns of density
O-layer
I-layer
Cap
Base D
185 Å
O chamber
I chamber 55 Å 20 Å
Inner wall Main
body
E F 10 Å
constriction
A B C
Middle platform O chamber
I chamber 65 Å
30 Å
185 Å
O-layer
I-layer
140 Å
H I
G
Base
[image:4.595.88.507.297.678.2]Middle platform
Figure 2Cryo-EM structures of the CCelastaseand FLCC complexes. (A,B) Side view and top view, respectively, of the cryo-EM structure of the
CCelastasecomplex. (C) Central section of the cryo-EM map shown inAandB. The density corresponding to the middle platform is indicated in
purple circles. (D–E) Side view and top view, respectively, of the cryo-EM structure of the FLCC. (F) Central section of the FLCC cryo-EM map. The new density corresponding to the inner wall is outlined with red ellipses. (G) Cutaway view of the superposition of the cryo-EM maps of the FLCC (blue) and CCelastase(orange) complexes. (H) Difference map between the FLCC and CCelastasecryo-EM maps. (I) Cutaway view of the
superposition of the difference map shown inH(green) and the cryo-EM structure of the CCelastasecomplex (orange). InHandI, arrows
indicate the extra ring at the base of the FLCC (‘base’) not present in the CCelastasemap.
separated by B7 A˚ (indicated in red ellipses in Figure 2F). This wall is separated from the outer wall by B7 A˚ . Each column has a diameter ofB8 A˚ and isB70 A˚ in length. The top of each column joins the OL. The lower parts of these densities are connected to the base of the complex defining an opening ofB55 A˚ in diameter on the cytoplasmic side of the complex.
Comparison of the full-length and the elastase-digested complexes
To investigate the differences between the higher-resolution FLCC structure and the structure of the CCelastasecomplex, we
first low-pass filtered the CCelastase map to a resolution of
12.4 A˚ corresponding to the resolution of the FLCC. The two maps were then superimposed and a difference map was calculated (Figure 2G, H and I, Supplementary Figure 2).
This map reveals that the OL in the FLCC and CCelastase
complexes are almost identical. They are both formed by a cap and the main body of the complex; the connection to the extracellular milieu takes place through an opening ofB20 A˚ in diameter (Figure 2). Therefore, we propose that the 8.5 A˚ resolution structure of the OL found in the CCelastasecomplex
reflects the native structure of the OL in the entire CC. The two structures display significant differences in the IL. In the CCelastasecomplex, the opening on the cytoplasmic side
has an increased diameter of 65 A˚ compared toB55 A˚ in the FLCC (Figure 2G and compare Figure 2C and F). The inner wall in the IL of the FLCC is absent in the CCelastasestructure
(Figure 2H and I). The FLCC inner wall consists of columns that run from the inner part of the OL to the FLCC bottom rim located on the cytoplasmic side of the complex that narrows the exit of the IL chamber (indicated as ‘Base’ in Figure 2H and I).
Modelling of the atomic structures of TraO and TraF N-termini
Since the structures of TraO/VirB9NTand TraF/VirB10NTare
unknown, we used several structure-prediction packages (PSIPRED, Phyre2, HHpred and I-TASSER) to analyse the distribution of secondary structural elements within TraO/ VirB9NT (residues 24–159) and TraF/VirB10NT (residues 1–
160) and their possible folds (Jones, 1999; Soding, 2005; Zhang, 2008; Kelley and Sternberg, 2009; Roy et al, 2010). TraO/VirB9 has an approximate length of 300 amino acids (aa), and the structure of the C-terminal fragment containing the last 164 residues has been solved by X-ray crystallography (Chandranet al, 2009). The region corresponding to the first 23 aa of TraO/VirB9 is a signal peptide (Petersenet al, 2011): this part of the protein is removed during the translocation of TraO/VirB9 across the IM and it is therefore not present in the assembled CC.In silicoanalysis of the sequence of TraO/VirB9 between residues 24 and 159 reveals two regions, one comprising residues 136 and 159 where no secondary structures could be reliably predicted and another, between residues 24 and 135, which contains mainlyb-strands and is likely to fold into a single domain. HHpred and PSIPRED identifiesb-strands in this section of TraO/VirB9NTwith high
score and consistency. Phyre2 and I-TASSER predict a very compact organisation for this domain consisting ofb-strands with a confidence score ofB70%. (Supplementary Figure 3a and Supplementary Figure 4). In addition, I-TASSER suggests several slightly different folds that vary in the position and
angles between theb-strands. The top five models were fitted as rigid bodies into the IL of the CCelastasecomplex (see below).
The sequence of TraF/VirB10NT (residues 1–160) was
analysed using the same modelling tools (Jones, 1999; Soding, 2005; Zhang, 2008; Kelley and Sternberg, 2009; Roy et al, 2010). Since the EM structure of FLCC demonstrated the presence of inner columns, it was interesting to understand which part of the TraF/VirB10NTcould correspond to these
column-like features. The major part of TraF/VirB10NTwas
shown to be unstructured and the modelling of the complete N-terminal domain was not reliable (Supplementary Figure 3b). Thus, we have focused only on those secondary structural elements that were reliably identified by several algorithms. Three short helical peptides were found: one
a-helix corresponding to the inner-membrane spanning region (aA: K40AF-LVF53) and two additionala-helical regions
(aB: A107RA-QAA113; aC: P138EE-QRR146) (Supplementary
Figure 3b). Their length is compatible with the diameter and the length of the observed columns in the FLCC cryo-EM map. Pseudo atomic models for aA, aB and aC were modelled by I-TASSER (Zhang, 2008; Royet al, 2010) and used in the flexible fitting analysis.
Fitting of the OL crystal structure in the CCelastaseand FLCC cryo-EM maps
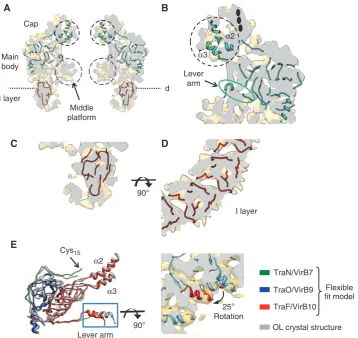
The position of proteins within the OL of both structures were localised by the flexible fitting of the OL crystal structure that contains TraO/VirB9CT, TraF/VirB10CT and TraN/VirB7
(Figure 3A and B; Supplementary Figure 5, PDB code 3JQO). The subnanometre resolution of the CCelastase map
allowed us to identify densities corresponding to these three proteins within the OL. The correlation coefficient of the flexible fitting of the OL crystal structure (3JQO) into the FLCC and CCelastasecomplex maps is 0.63 and 0.71,
respec-tively. Assessment of the RMSD of these fits was B1.21 A˚ indicating that at the level of resolution of 8.5 A˚ , these fits are nearly identical to the original OL crystal structure. Minor changes were observed in the lever arm area of the EM structure (Figure 3E).
Under the lever arm area, in both complexes there is a substantial area of electron density called the middle plat-form, which is not accounted for by fitting of the OL crystal structure (purple circles in Figure 3A). Although there are an extra nine aa present at the N terminus of TraF/VirB10CTin
the CCelastasecomplex compared to the OL crystal structure,
the size of this peptide is not sufficient to account for the entire middle platform density. On the other hand, the middle platform could be formed by the region of the TraO/VirB9NT
sequence between residues 136 and 159. This region could possibly act as a flexible linker connecting the TraO/VirB9 domains of the OL and IL and be involved in the interaction with TraF/VirB10 and a substrate within the central channel. We observe that the conformation of the middle platform is different in both structures, being more pronounced in the CCelastasecomplex than in the FLCC where it is more tubular.
Clearly, removing the N-terminal domain of TraF/VirB10 leads to a conformational change in that region, the mole-cular basis of which remains unclear, given the current resolution of the maps.
In the region of the cap, the CCelastasemap reveals densities
fora-helicesa2 anda3 of TraF/VirB10CT(Figure 3A and B,
the OM. There is additional density that cannot be ascribed to the helices but might be attributed to the lipid moiety of TraN/VirB7 and detergent molecules associated to it (see black ovals in Figure 3B and also Discussion below).
The IL organisation: fitting of TraO/VirB9NTand
TraF/VirB10NT
Several models for TraO/VirB9NT(residues 24–135) obtained
from I-TASSER that had slightly different folds varying in positions and angles of theb-strands were fitted in the IL of the CCelastasemap. To select the most appropriate model, we
checked the correlation between the models and the EM density. The fitting of the pseudo atomic model of this b -domain has to satisfy two important constraints: the location of its C terminus has to be in close proximity to the linker region and the OL, and the resulting fit should not create clashes upon 14-fold symmetrisation. This allowed us to make a consistent assessment of the best five models and the final model was refined using flexible fitting into the experimentally derived densities of the EM map. The final
atomic model (Figure 3C and D, and Supplementary Figure 4) was fitted to the CCelastasecryo-EM map with a
cross-correla-tion coefficient of 0.82. The C terminus of this model is located close to the N terminus of TraO/VirB9CT in the OL
crystal structure. The results of the docking suggest that the
b-strands in the IL would run at an angle of 281away from the central axis of the secretion pore (Figure 3C and D).
The superposition of the CCelastaseand FLCC cryo-EM maps
revealed extra densities in the IL of the FLCC (Figure 2G–I). Since TraF/VirB10NTis absent in the CCelastasestructure, it is
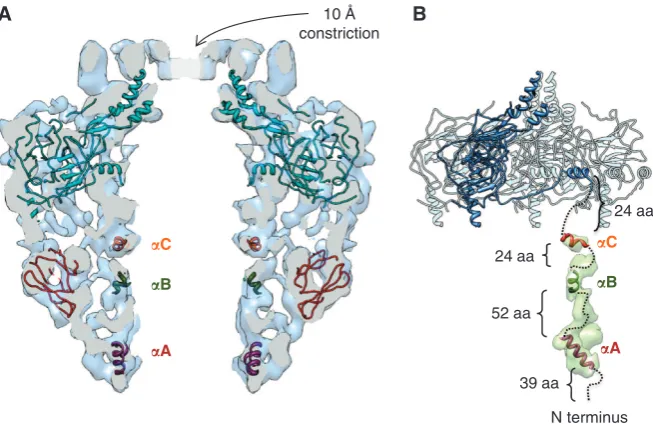
logical to assign the inner cylindrical wall of the FLCC IL to this domain of TraF/VirB10. Threea-helical regions in the N terminus of TraF/VirB10 were identified with high confidence (see above) with flexible linkers in between, and have been tentatively fitted in the column of densities that form the inner cylindrical wall in the IL of the FLCC (Figure 4). Helix
aA, corresponding to the TM helix traversing the IM, was fitted at the base of the IL (Figure 4A and B). Detergents may also contribute to the density in the base of the IL. HelicesaB andaC have been docked in stretches of density compatible
d
I layer D
A
Middle platform
B
C Cap
α3
α2 Main
body
I layer
E
90°
Lever arm
α2
α3 Cys15
Lever arm
TraN/VirB7
OL crystal structure Flexible fit model TraO/VirB9
TraF/VirB10
90°
[image:6.595.119.478.57.395.2]25° Rotation
Figure 3Modelling and fitting of atomic data in the cryo-EM map of the CCelastasecomplex. (A) Central vertical slice showing the fitting of the
OL atomic structure and the atomic model obtained for TraO/VirB9NT. The densities corresponding to the middle platform and twoa-helicesa2
anda3 of TraF/VirB10CTare indicated with purple and black dashed circles, respectively. The dashed line corresponds to the equivalent cutting plane perpendicular to the vertical axis of the complex shown in panelD. (B) Detailed view of the crystal structure fitting in the OL. In the cap, there is clear extra density not accounted for by helicesa2 anda3 (in a black dashed circle). The plausible location of the lipidic moiety covalently bound to TraN/VirB7 is indicated with black ovals. (C,D) Fitting of the model obtained for TraO/VirB9NTin the IL. In panelD, the
cutting plane shown is in a perpendicular direction to the vertical axis of the CCelastasecryo-EM map shown in panelA. (E) Superposition of one subunit of the original atomic structure (grey) of the OL, and the corresponding subunit of the atomic model after flexible fitting (TraN/VirB7, TraO/VirB9 and TraF/VirB10 are shown in green, blue and red, respectively). The RMSD between the two models is 1.21 A˚ . On the right, the N-terminala-helix present in the lever arm (red) is shown fitted in the equivalent density of the CCelastasecryo-EM map. The symmetry-related
subunits are shown in blue. The same helix of the original atomic structure of the OL is shown in grey.
with the size of these two helices, and helix aC has been located close to the N terminus of TraF/VirB10CTof the OL
atomic structure (Figure 4B). Overall, the dimensions of the columns that form the inner wall in the IL are compatible with the sizes of the modelled helices. However, the remain-ing volume determined from the density at the 1sthreshold is insufficient to accommodate the linker polypeptide be-tween the helices. It is likely that the linkers, which do not have a rigid organisation, were averaged out during the process of reconstruction.
Localisation of TraO/VirB9NTin CC variants using
domain-specific nanobodies
The cryo-EM map of the CCelastase complex and the fitting
results for the atomic model of TraO/VirB9NTlocalise TraO/
VirB9 at the periphery of the IL. To validate the domain localisation within the complex, we have employed another approach based on labelling experiments using nanobodies (NBs). ELISA experiments were carried out using the FLCC, the OL and CCelastasecomplexes. Among the 40 NBs that we
tested, two NBs, NBCA4271 and NBCA4304, exhibited high specificity for TraO/VirB9NT, showing strong ELISA responses
for CCelastaseand FLCC and a low signal for the OL complex
(Figure 5A; Supplementary Figure 6). Therefore, we expected that incubation of FLCC with NBCA4304 (or NBCA4271) would add an extra density that would be visible in the EM images, thereby allowing us to locate TraO/VirB9NT. In order
to make the bound NBs more visible, we additionally labelled them using His antibodies. Note that a NB/His anti-body complex would be too large to penetrate the CC through the 55 A˚ opening of the IL: thus labelling of TraO/VirB9NT
might only occur if this domain is at the periphery of the IL. Purified FLCC was incubated with NBCA4304 in a molar ratio of 1:7 FLCC:NB. The fractions containing NBs bound to
the FLCC were pooled together, concentrated and further incubated with anti-His antibody targeted against the His-tag of the NB in a molar ratio anti-His:FLCC:NB of 5:1 (Figure 5B). Fractions containing FLCC:NB:anti-His complex were used to prepare negatively stained EM grids (Figure 5C and D, see Supplementary Information). Extra density was clearly seen on the end views of single complexes (Figure 5C). Tail-like density was protruding outward from the periphery of the CC. Figure 5D shows averaged images where extra density corresponding to the size of the antibody emerges radially from the outer part of the CC. This result adds to evidence that TraO/VirB9NTis located on the outer
part of the IL.
Discussion
The CC is an essential structural feature of T4S systems. It is self-assembling and therefore is likely to be assembled first. It forms part of the IM channel and is a major component of the OM pore. It provides the central scaffold for assembly of all other components. Understanding its structure is thus crucial to the elucidation of T4S system transport mechanism. This report fills a major gap in our understanding of the CC structure: indeed, while the OL organisation and structure had been revealed previously by its X-ray crystal structure, very little was known about the organisation and structure of the IL.
In this report, we have re-analysed the FLCC at higher resolution and compared this more detailed structure to that of another complex where a part of the IL, TraF/VirB10NT,
was selectively removed. Using immuno-labelling to selec-tively target the remaining component of the IL, TraO/ VirB9NT, we unambiguously located and identified this part
of the IL. Finally, our analysis was confirmed by fitting of
N terminus 24 aa
24 aa
52 aa
39 aa
C
B
A
C
B
A A
B 10 Å
[image:7.595.136.463.58.270.2]constriction
Figure 4 Modelling and fitting of atomic models in the cryo-EM map of the FLCC. (A) Central slice of the FLCC with fitted OL atomic structure and atomic models obtained for TraO/VirB9NTand thea-helices predicted in TraF/VirB10NT. (B) Schematic model for the organisation of TraF/ VirB10 in the FLCC. Four TraN/VirB7þTraO/VirB9CTþTraF/VirB10CTsubunits of the 14-mer present in the OL atomic structure are shown.
One of the subunits is shown in dark blue. The tentative docking of the three TraF/VirB10NTa-helical regions modelled with high confidence
together with a plausible connection with TraF/VirB10CTis shown in dashed lines. The density for one subunit in the difference map is shown
in transparent green. This subunit is located immediately below the lever arm of TraF/VirB10CTshown in dark blue. The threea-helical regions
predicted atomic structures into cryo-EM density maps. Given the high reliability of modern three-dimensional structure-prediction programmes, fitting of predictive atomic models (the only option in the absence of experimentally derived models) provides an important validation tool for the inter-pretation of cryo-EM maps. Conversely, the quality of the fit provides an important evaluation of the predicted models. With both issues, we were able to generate reliable models for most of the IL parts.
The difference map between the cryo-EM maps of the FLCC and the CCelastase complex (Figure 2H and I) clearly shows
extra mass in the FLCC corresponding to the TraF/VirB10NT
domain in the IL. This density is made up of 14 clearly defined columns that form the inner lining of the IL (Figure 2H and I). At the very bottom of the complex, these stretches join each other to form an extra ring at the base of
the FLCC (indicated as ‘Base’ in Figure 2H and I). This ring might correspond to the 14 TM segments (helix aA) asso-ciated with detergent micelles. Fitting of the predicted helical regions (helicesaA–C) of TraF/VirB10NTdoes not account for
all the electron density in the observed columns. The unas-signed electron density might be accounted for by the flexible linkers between the helices (Figure 4A and B).
Assessment of differences between the FLCC and the CCelastase structures, fitting of an atomic model for TraO/
VirB9NTand labelling experiments with NB targeted against
TraO/VirB9NTare all pointing towards an unambiguous
con-clusion that the TraO/VirB9 N-terminal part is located at the periphery of the IL. A recent EM structure of the pKM101 CC bound to the VirB4 ATPase also confirmed the outer location of TraO/VirB9 in the I-layer (Wallden et al, 2012). In this work, VirB4 is observed bound to the side of the CC, and the
Normalised absorbance
Core complex
OL complex CCelastase complex
A
D B
CC + NBCA4304 + anti-His
Std CC NBCA4304
CA4271 CA4296 CA4304
CC + NBCA4304CC + NBCA4304+ anti-His
50
30
20 15 10 160 -kDa
82
64
37
26
6 180 -kDa
Nanobodies
0.3 0.4 0.5 0.6 0.7 0.8 0.9 1
[image:8.595.128.466.59.438.2]C Std + DTT– DTT
Figure 5 NB labelling of the FLCC, CCelastase and OL complexes. (A) Selection of NBs preferentially binding the CCelastase (see also
Supplementary Figure 6). The diagram reports the comparative affinity of three NBs for the FLCC (green), the CCelastase(blue) and the OL (red) complexes. NBCA4271 and NBCA4304 target the IL while NBCA4296 binds to the OL, a region present in the three complexes used for the ELISA experiment. NBCA4304 was chosen for the labelling experiments. The right panel represents the schematic organisation of the complexes used in the ELISA experiments coloured correspondingly. (B) SDS–PAGE analysis and western blot of the labelled FLCC. The different lanes correspond to the FLCC, the NBCA4304, the purified complex containing the FLCC and the NB (FLCCþNBCA4304), and the final purified complex containing the FLCC, the NB and the anti-His antibody (CCþNBCA4304þanti-His). This final complex was used to prepare negative stain grids. The right panel shows a western blot of the FLCCþNBCA4304þanti-His fraction in the presence or absence (þ/ DTT) of reducing agent. The western blot was performed using only the secondary antibody HRP-conjugated. Molecular weight standards (Std) are indicated in both cases. (C) Gallery of negatively stained single particles with a clear extra density emerging from the CC. (D) Representative top view class averages of the FLCCþNBCA4304þanti-His sample. The scale bar corresponds to 10 nm.
FLCC–VirB4 interaction is not disrupted in versions of the CC where TraF/VirB10 has been progressively truncated from the N-terminal end (Walldenet al, 2012).
Using a TrIP assay, Cascales and Christie (2004b) have demonstrated that VirB9 interacts with the T-DNA during the translocation of the substrate from the IM inA. tumefaciens. Since VirB9 traverses the FLCC from top to bottom except in the IM part of the complex, this would suggest that the T-DNA might access the CC from the outside. On the other hand, it could be that some of the non-assigned electron density such as the middle platform (Figure 3A) might also be formed by residues in VirB9 forming a structure that protrudes inwardly inside the CC. A part of the TraO/VirB9 sequence between the N-terminal and C-terminal domains was not assigned (resi-dues P136WA to KAK159), but could account for this inwardly
protruding region and thus contact DNA during transfer. The structures of FLCC, CCelastase and OL demonstrate
clearly that TraO/VirB9 forms the outer sheath of the CC while TraF/VirB10 is lining the inner surface of both cham-bers in the CC, and spans the whole length of the CC eventually forming the bottom ring of the IL. This location of TraF/VirB10 is in a full agreement with previous findings that suggest that TraF/VirB10 serves as a signal transmitter throughout the entire complex. By interacting not only with most of the system’s inner (VirB6 and VirB8) and outer (VirB9 and VirB7) membrane components, but also with the ATPases powering the system (VirB4, VirB11 and VirD4) (Llosaet al, 2003; Atmakuriet al, 2004; Alvarez-Martinez and Christie, 2009; Jakubowski et al, 2009), VirB10 acts as a cornerstone of the T4S system architecture. Its interactions with ATPases (Cascales and Christie, 2004a) are known to propagate ATP-driven conformational changes throughout the T4S system (Postle and Larsen, 2007; Jakubowskiet al, 2009). The structural basis of these VirB10-mediated relay mechanisms can now be inferred from the structure presented here. Indeed, by assigning a continuous and extended density to TraF/VirB10NT within the IL, we can
now map out the entire TraF/VirB10 structure and thus identify an uninterrupted path by which conformational changes would need to be relayed to reach out to the OM components.
Materials and methods
Expression and purification of the pKM101 CC
The CC from IBA3c:traN-traO-traF/C-ST plasmid was purified as described previously (Fronzeset al, 2009).
Elastase digestion of the pKM101 CC
The pKM101 CC eluted from the StrepTrap HP column (GE Healthcare) was concentrated down to 500ml at a final concentra-tion between 5 and 10 mg/ml depending on the preparaconcentra-tion. Ten microlitres of elastase (Sigma) at 1 mg/ml in 50 mM Tris-HCl pH 8.5, 200 mM NaCl were added to the 500ml and the mix was incubated for 40 min at room temperature (RT). After the incubation, the solution was gel filtered as described previously (Fronzeset al, 2009). The N-terminal sequence of the main bands was determined using Edman degradation.
Induction of a humoral immune response in llama and NB identification
Llama immunisation and NB repertoire cloning and characterisation were as described in Supplementary Information. Periplasmic ex-tracts containing different NBs were produced and purified from
E. coliWK6 su strain following standard procedures in order to screen the epitope of each NB (Rasmussenet al, 2011).
To perform the ELISA experiments presented in Figure 5 and Supplementary Figure 6, ELISA plates (flat-bottom Maxisorp 96-well plates, Nunc) were coated either with FLCC, OL or CCelastase
complexes diluted to 5mg/ml in sodium bicarbonate buffer pH 8.2 at 41C overnight. The binding step was followed by washing (five times) with 1 PBS containing 0.1% Tween-20 (PBST) at RT. Remaining binding sites were blocked with 2% skimmed milk powder in 1 PBS for 2 h at RT followed by a washing step in PBST. The periplasmic extracts of each of the forty NBs were then applied diluted 1:5 in 1 PBS for 1 h at RT followed by a washing step in PBST. To detect if the NBs were bound, the ELISA plates were incubated with a mouse monoclonal anti-His antibody coupled to HRP (Invitrogen) diluted 1:5000 in 1 PBS containing 0.1% milk powder. The binding reaction was for 1 h at RT followed by a washing step. Then a peroxidase substrate (TMB, Sigma) was added and left incubating for 30 min at RT. The reaction was stopped adding 1 M H2SO4and the absorption was measured at
450 nm. The ELISA screening was performed three times with duplicates for each NB in every experiment, and appropriate controls were included in each ELISA plate.
NBCA4304 purification for electron microscopy-labelling experiments
NBCA4304 was purified as described in Rasmussenet al(2011). The purity of the sample was assessed by SDS–PAGE and then concen-trated using a centrifugal filter of 3 kDa cutoff (Millipore). Glycerol was added at a final concentration of 20% and the sample was frozen for latter use.
Labelling of the N terminus of TraO using NBs
The pKM101 CC was incubated with purified NBCA4304. The mix was then loaded onto Superose 6 10/300 (GE Healthcare) and the fractions corresponding to the peak containing the CC and NBCA4304 were incubated with anti-His antibody (GE Healthcare). A new top band that corresponds to the IgG bound to the His-tag of NBCA4304 in the CC:NB complex was apparent on the SDS–PAGE (Figure 5B). The fraction corresponding to the purified complex made of CC, NBCA4304 and anti-His antibody was used to prepare negative stain grids (see Supplementary Information).
Electron microscopy and image analysis of the FLCC and CCelastasecomplexes
Samples were vitrified and visualised on a FEI Tecnai F20 FEG microscope. Image frames were recorded on a 4k4k Gatan CCD camera under low-dose conditions. The pixel size at the specimen level was 2.22 for the FLCC and 2.08 for the CCelastasecomplex (Supplementary Information). The defocus on images was assessed using CTFFIND3 (Mindell and Grigorieff, 2003), and CTF correction was done by phase flipping using Bshow1.6 (Heymann, 2001; Heymann and Belnap, 2007). Corrected images were centred and subjected to multivariate statistical analysis (MSA). Alignment was improved by iterative procedure of multi-reference alignment (MRA) and MSA. Reconstructions for both CCelastase and FLCC samples were obtained independently (van Heelet al, 2000). The final 3D map of the CCelastaseand FLCC complexes were calculated from 5430 particles and 3805 particles, respectively. The resolution was estimated by Fourier Shell Correlation (FSC) as 12.4 and 8.5 A˚ for the FLCC and CCelastasestructures, according to the 0.5 criterion
level (Supplementary Figure 1c; Supplementary Information). To compare the two structures, the CCelastasestructure was low-pass
filtered to a resolution of 12.4 A˚ . The two structures were aligned and normalised to the same sigma, then the difference map was calculated between the FLCC and the CCelastase complexes (see
Supplementary Information).
Modelling of domain structures for the FLCC and CCelastase complexes
The sequences of TraO/VirB9NT (Q46704 UniProtKB) and TraF/ VirB10NT (Q46705 UniProtKB) were analysed using the structure
used: helixaA (aa K40AF–LVF53), helixaB (aa A107RA–AA113) and
helixaC (aa P138EE–QRR146).
Fitting of atomic data into the cryo-EM maps of the FLCC and CCelastasecomplexes
The initial fitting was done manually in Chimera (Pettersenet al, 2004). The crystal structure of the OL complex (PDB 3JQO (Chandranet al, 2009)) was fitted in the OL of the CCelastase
cryo-EM map using a rigid body approach and then refined using the flexible fitting software Sculptor (Birmannset al, 2011) and Flex-EM (Topfet al, 2008; Pandurangan and Topf, 2012). The N-terminal lever arm of TraF/VirB10 (Chandranet al, 2009) was manually adjusted to optimise the fitting in the corresponding density of the cryo-EM map (Supplementary Information).
The model of the N terminus (L24EVG to FIET135) of TraO/VirB9 was fitted first manually and then it was refined using the Flex-EM software (Topf et al, 2008; Pandurangan and Topf, 2012). The models generated for helixaA, helix aB and helixaC located in TraF/VirB10NT were fitted manually in one monomer of the
difference map and then symmetrised in Chimera (Pettersenet al, 2004). Supplementary Table I shows the cross-correlation coeffi-cients for the different fittings.
Access codes
The EM maps of the FLCC and CCelastasecomplexes are deposited in
the EMD data bank (http://www.ebi.ac.uk/pdbe/) under the acces-sion codes EMD-2232 and EMD-2233.
Supplementary data
Supplementary data are available at The EMBO Journal Online (http://www.embojournal.org).
Acknowledgements
This work was funded by grant 082227 from the Wellcome Trust to GW. Re´mi Fronzes is supported by the Centre National de la Recherche Scientifique and Institut Pasteur. We would also like to thank the Wellcome Trust for the EM equipment, Drs D Houldershaw and R Westlake for computer support, and Drs M Topf and AP Pandurangan for their advice during the flexible fitting analysis.
Author contributions: AR-C, RF, EVO and GW designed the research; AR-C purified and characterised the CCelastase complex; AR-C and CGS collected data for the CCelastasecomplex; AR-C and
EVO solved the structure of the CCelastasecomplex; RF and EVO solved the structure of the FLCC; AR-C and EVO performed the modelling of atomic structures and fitted them into EM maps; AR-C, VC and PWL were involved in the NB screening; AR-C performed the biochemistry and the EM of the labelling of the CCelastase
complex using NBs; TL, EP, JS and HR were involved in NBs production and cloning; and AR-C, RF, EVO and GW wrote the paper.
Conflict of interest
The authors declare that they have no conflict of interest.
References
Alvarez-Martinez CE, Christie PJ (2009) Biological diversity of prokaryotic type IV secretion systems. Microbiol Mol Biol Rev
73:775–808
Atmakuri K, Cascales E, Christie PJ (2004) Energetic components VirD4, VirB11 and VirB4 mediate early DNA transfer reactions required for bacterial type IV secretion. Mol Microbiol 54:
1199–1211
Birmanns S, Rusu M, Wriggers W (2011) Using Sculptor and Situs for simultaneous assembly of atomic components into low-reso-lution shapes.J Struct Biol173:428–435
Cascales E, Christie PJ (2004a) Agrobacterium VirB10, an ATP energy sensor required for type IV secretion.Proc Natl Acad Sci USA101:17228–17233
Cascales E, Christie PJ (2004b) Definition of a bacterial type IV secretion pathway for a DNA substrate.Science304:1170–1173 Chandran V, Fronzes R, Duquerroy S, Cronin N, Navaza J,
Waksman G (2009) Structure of the outer membrane complex of a type IV secretion system.Nature462:1011–1015
Dreiseikelmann B (1994) Translocation of DNA across bacterial membranes.Microbiol Rev58:293–316
Fronzes R, Schafer E, Wang L, Saibil HR, Orlova EV, Waksman G (2009) Structure of a type IV secretion system core complex.
Science323:266–268
Gomis-Ruth FX, Moncalian G, Perez-Luque R, Gonzalez A, Cabezon E, de la Cruz F, Coll M (2001) The bacterial conjugation protein TrwB resembles ring helicases and F1-ATPase.Nature
409:637–641
Hare S, Bayliss R, Baron C, Waksman G (2006) A large domain swap in the VirB11 ATPase of Brucella suis leaves the hexameric assembly intact.J Mol Biol360:56–66
Heymann JB (2001) Bsoft: image and molecular processing in electron microscopy.J Struct Biol133:156–169
Heymann JB, Belnap DM (2007) Bsoft: image processing and molecular modeling for electron microscopy.J Struct Biol157:
3–18
Jakubowski SJ, Kerr JE, Garza I, Krishnamoorthy V, Bayliss R, Waksman G, Christie PJ (2009) Agrobacterium VirB10 domain requirements for type IV secretion and T pilus biogenesis.Mol Microbiol71:779–794
Jones DT (1999) Protein secondary structure prediction based on position-specific scoring matrices.J Mol Biol292:195–202
Kelley LA, Sternberg MJ (2009) Protein structure prediction on the Web: a case study using the Phyre server.Nat Protoc4:363–371 Lessl M, Lanka E (1994) Common mechanisms in bacterial con-jugation and Ti-mediated T-DNA transfer to plant cells.Cell77:
321–324
Llosa M, Zunzunegui S, de la Cruz F (2003) Conjugative coupling proteins interact with cognate and heterologous VirB10-like pro-teins while exhibiting specificity for cognate relaxosomes.Proc Natl Acad Sci USA100:10465–10470
McCullen CA, Binns AN (2006) Agrobacterium tumefaciens and plant cell interactions and activities required for interkingdom macromolecular transfer.Annu Rev Cell Dev Biol22:101–127 Mindell JA, Grigorieff N (2003) Accurate determination of local
defocus and specimen tilt in electron microscopy.J Struct Biol
142:334–347
Pandurangan AP, Topf M (2012) Finding rigid bodies in protein structures: application to flexible fitting into cryoEM maps. J Struct Biol177:520–531
Petersen TN, Brunak S, von Heijne G, Nielsen H (2011) SignalP 4.0: discriminating signal peptides from transmembrane regions.Nat Methods8:785–786
Pettersen EF, Goddard TD, Huang CC, Couch GS, Greenblatt DM, Meng EC, Ferrin TE (2004) UCSF Chimera–a visualization system for exploratory research and analysis.J Comput Chem
25:1605–1612
Postle K, Larsen RA (2007) TonB-dependent energy transduction between outer and cytoplasmic membranes. Biometals 20:
453–465
Rasmussen SG, Choi HJ, Fung JJ, Pardon E, Casarosa P, Chae PS, Devree BT, Rosenbaum DM, Thian FS, Kobilka TS, Schnapp A, Konetzki I, Sunahara RK, Gellman H, Pautsch A, Steyaert J, Weis WI, Kobilka BK (2011) Structure of a nanobody-stabilized active state of the beta(2) adrenoceptor.Nature469:
175–180
Roy A, Kucukural A, Zhang Y (2010) I-TASSER: a unified platform for automated protein structure and function prediction. Nat Protoc5:725–738
Savvides SN, Yeo HJ, Beck MR, Blaesing F, Lurz R, Lanka E, Buhrdorf R, Fischer W, Haas R, Waksman G (2003) VirB11 ATPases are dynamic hexameric assemblies: new insights into bacterial type IV secretion.EMBO J22:1969–1980
Soding J (2005) Protein homology detection by HMM-HMM com-parison.Bioinformatics21:951–960
Terradot L, Waksman G (2011) Architecture of the Helicobacter pyloriCag-type IV secretion system.FEBS J278:1213–1222 Topf M, Lasker K, Webb B, Wolfson H, Chiu W, Sali A (2008) Protein
structure fitting and refinement guided by cryo-EM density.
Structure16:295–307
van Heel M, Gowen B, Matadeen R, Orlova EV, Finn R, Pape T, Cohen D, Stark H, Schmidt R, Schatz M, Patwardhan A (2000) Single-particle electron cryo-microscopy: towards atomic resolu-tion.Q Rev Biophys33:307–369
Waksman G, Fronzes R (2010) Molecular architecture of bacterial type IV secretion systems.Trends Biochem Sci35:691–698 Wallden K, Rivera-Calzada A, Waksman G (2010) Type IV secretion
systems: versatility and diversity in function.Cell Microbiol12:
1203–1212
Wallden K, Williams R, Yan J, Lian PW, Wang L, Thalassinos K, Orlova EV, Waksman G (2012) Structure of the VirB4 ATPase, alone and bound to the core complex of a type IV secretion system.Proc Natl Acad Sci USA109:11348–11353
Zhang Y (2008) I-TASSER server for protein 3D structure prediction.
BMC Bioinformatics9:40