N A N O I D E A
Open Access
Establishment of a method to determine the
magnetic particles in mouse tissues
Yifan Wu
1,2, Wuxu Zhang
1, Yuxia Wang
1*, Qian Li
1, Guo Gao
3, Na Dong
1, Hengyao Hu
3, Kan Wang
3, Junhua Wu
1,
Zhongcai Gao
1and Daxiang Cui
3Abstract
This work is aimed to evaluate a method to detect the residual magnetic nanoparticles (MNPs) in animal tissues. Ferric ions released from MNPs through acidification with hydrochloric acid can be measured by complexation with potassium thiocyanate. MNPs in saline could be well detected by this chemical colorimetric method, whereas the detected sensitivity decreased significantly when MNPs were mixed with mouse tissue homogenates. In order to check the MNPs in animal tissues accurately, three improvements have been made. Firstly, proteinase K was used to digest the proteins that might bind with iron, and secondly, ferrosoferric oxide (Fe3O4) was collected by a magnetic field which could capture MNPs and leave the bio-iron in the supernatant. Finally, the collected MNPs were
carbonized in the muffle furnace at 420°C before acidification to ruin the groups that might bind with ferric ions such as porphyrin. Using this method, MNPs in animal tissues could be well measured while avoiding the disturbance of endogenous iron and iron-binding groups.
Keywords:Ferric ions, Magnetic nanoparticles, Potassium thiocyanate, Mouse tissue, Chemical colorimetric method
Background
Nanotechnology is widely used in drug or gene delivery and targeted therapy [1-4]. The importance of targeted drug delivery is to transport a drug directly to the center of the disease under various conditions and thereby treat it separately, with less effect on other tissues. The nano-particle designed for drug delivery should be
biodegrad-able and biocompatible [5,6]. Due to its good
biodegradability and biocompatibility, the engineered magnetic nanoparticles (MNPs) could be well used in disease diagnosis and even in drug delivery and targeted therapy [7-14]. They can be simultaneously functiona-lized and guided by a magnetic field [15-17]. The safety of designed MNPs depends on the safety of linked mole-cules and the magnetic cores. So, evaluating how MNPs distribute and metabolize in different tissues of animals is very important. Moreover, this information is capital to give reference of its optimal dosage and administra-tion route. Magnetic resonance imaging, Prussian blue staining, and transmission electron microscopy were
used to detect the distribution of the magnetic
nanopar-ticles in vivo. As a vector, MNPs often bond with some
conjugate such as cisplatin, and the distribution of con-jugates had been used to indicate MNP distribution [18]. Determining iron ions using inductively coupled plasma-mass spectrometry (ICP-MS) is a very sensitive method and has been used to determine the concentration of MNPs in animal tissues [19]. This method could meas-ure the total endogenous and exogenous iron in different tissues of animals. When the tissue contains high con-centration of iron ions, the MNP concon-centration could not be calculated by using this method. Yin et al. have explored the toxicity of Fe3O4coated with glutamic acid
labeled with Fe59 and determined their distribution in
mice. Separating from endogenous iron labeled with Fe59could directly catch the trace of MNPs in the differ-ent tissues of mice, including the absorption, distribution and clearance, and accumulation in tissues and the prob-able target organ, and evaluate its pharmacokinetic pro-filein vivo [20]. However, with the same disadvantage of
ICP mass, labeled Fe59 could not give the information
on whether it is a degraded iron ion or an atom in MNPs. Therefore, we try to establish a method to * Correspondence:wangyuxia1962@hotmail.com
1
Beijing Institute of Pharmacoloy and Toxicology, Beijing 100850, People’s Republic of China
Full list of author information is available at the end of the article
determine the ferric ions in MNPs to observe the metab-olism feature of MNPs in animal tissues.
Experimental materials and methods Animals
CD-1 strain mice were supplied by Vital River Labora-tory Animal Technology Co. Ltd. (SCXK(Jing)2006-2009, Beijing, China). They were housed in a controlled environment (21 ± 2°C, 55 ± 5% of humidity, 12-h dark/ light cycle with light provided between 6 am and 6 pm).
Food and water were given ad libitum. All the animal
experiments were carried out in the Beijing Center for Drug Safety Evaluation, in accordance with a protocol approved by the Institutional Animal Care and Use Committee of the Center, which is in compliance with the guidelines of the Association for Assessment and Accreditation of Laboratory Animal Care International.
Materials
The MNPs were from Shanghai Jiaotong Unversity. Iron chloride hexahydrate was from Sinopharm Chemical Re-agent Co. Ltd. (Shanghai, China). The MNPs were coated with cetyltrimethyl ammonium bromide at the size of 25 to 35 nm. Magnetic field (MagneSphere Tech-nology Magnetic Separation Stands, Z5341) was from Promega (Madison, WI, USA). Muffle furnace (SX-8-10) was from Tianjin Taisite Instrument Co. Ltd. (Tianjin City, China).
Establishing a method to determine ferric ionsin vitro For quantitive analysis of MNPs the concentration of iron ion was created as a standard for MNPs. Ferric chloride was use to analyze the iron content. Potassium thiocyanide colorimetry showed a good linear relation-ship and was used to determine ferric ions in MNPs treated with hydrochloride acid at 100°C. Different con-centration of 0.5 ml ferric chloride was mixed with an equal volume of 2N hydrochloride acid and boiled for 10 min. The acidified solution was cooled to room
temperature and added 120μl of 5M potassium
thiocya-nide. Ninety-six-well plates were used in this detection method. The colored reaction product (150μl/well) was measured at 480 nm on a spectral scanning multimode reader (Varioskan Flash version 2.4.3, Thermo Scientific, Logan, UT, USA). The sonicated and acidified MNPs could be treated in the same way and its ferric ions con-centration could be calculated by the ferric chloride standard curve.
The influence of animal tissue on the determination of ferric ions in MNPs
For the assessment of MNPs in different tissues by colorimetry, the normal mice were narcotized with ether. The whole blood was collected into
heparin-coated tube and diluted with nine volumes of saline before mixing with MNPs. Different tissues were har-vested. Tissues from three mice were mixed and homogenized in ten volumes of ice-cold saline in a homogenizer (ULTRA-TURRAX T25, IKA-Labortech-nik, Staufen, Germany) for 10 s. Three hundred
micro-liters of MNPs at 0.078 to 40 μg/ml in saline was
mixed with an equal volume of tissue homogenate and acidified with 80 μl of 6N hydrochloric acid. The acid-ified solution was centrifuged at 14,000 rpm for 6 min,
and then, the supernatants were colorized with 80 μl
of 5M potassium thiocyanide.
The iron background in mouse tissues
One hundred microliters of 10% mouse tissue homogen-ate was mixed with 500μl of saline and then treated with
proteinase K at the final concentration of 100 μg/ml
under 55°C to 65°C for 0.5 h. The samples were then transferred into crucibles, oven dried on a hot plate, and then carbonized in a muffle at 420°C for 2 h. Cooled to room temperature, the samples were acidified with 0.5 ml 1N hydrochloric acid at 100°C for 10 min. Cooled to room temperature, 1N hydrochloric acid was replenished to the final volume of 1.0 ml. Centrifuged at 10,000 rpm for 10 min, 0.5 ml of the supernatants was colorized with 60μl of 5M potassium thiocyanide. The concentration of ferric ions was calculated referencing the result from ferric chloride standard.
The determination of MNPs in blood treated with proteinase K with/without magnetic field collection
MNPs at different concentrations in 300 μl of saline
were mixed with 30 or 300μl of mouse whole blood and
replenished with saline to the final volume of 600 μl.
Aliquots were treated with/without 3 μl of proteinase
K, 20 mg/ml, to the final concentration of 100 μg/ml
under 55°C to 65°C for 0.5h and centrifuged at 14,000
rpm for 5 min. The 200 μl of the supernatant was
mixed with 400 μl of saline to check whether Fe3O4
remained after centrifugation. The precipitate was washed with 0.6 ml saline, centrifuged two times and
suspended in 600 μl of saline. Each sample was added
with 80 μl 6N hydrochloric acid and boiled for 10 min.
After cooling in a water bath at room temperature, the
solutions were colorized with 80μl 5M KSCN, and their
A480were measured.
Using magnetic field to separate MNPs from the endogenous iron followed by carbonation to ruin ferric ions binding groups
Being a standard, 300μl of MNPs at 40 μg/ml in saline was diluted with 200 μl of saline, acidified with 500 μl
2N hydrochloric acid, and colorized with 120 μl 5M
were respectively mixed with 200μl of saline and 200μl of saline containing 50% mouse blood. The crucibles containing these solutions were put on a magnetic field, and the MNPs were collected and washed two times with saline. The precipitates could be directly acidified with 1 ml 1N hydrochloric acid or carbonized in a muffle furnace at 420°C for 2 h, cooled to room temperature, and then be acidified. After acidification at 100°C for 10 min and cooling to room temperature, all the samples above were replenished and colorized
with 120 μl 5M KSCN. Using the same procedure,
MNPs mixed in the mouse tissue homogenate was collected and determined. The collected ratio was cal-culated and compared with the result of the MNPs in saline.
Determination of MNPs in the blood of mice treated with MNPs by intravenous injection
CD-1 mice were i.v.-administrated with MNPs at a dose of 7.5 mg/kg. At different time points after MNP treat-ment, the whole blood was collected in heparin-coated tube. In a crucible, 0.1 ml of whole blood was mixed with 0.9 ml of saline, and MNPs were collected and washed two times with saline accompanied with mag-netic field separation. The collected precipitates were carbonized as before. The residues were suspended in
0.5 ml 1N hydrochloric acid and colorized with 60 μl
5M KSCN. The concentration of ferric ions was calcu-lated, referencing with ferric chloride standard with at-tention on the volume used.
Results
The standard of ferric ions determinationin vitro
Samples containing different concentrations of ferric ions in water were prepared by diluting the iron chloride solution and acidifying and colorizing following the method described above. The formula was obtained after logistic regression (Figure 1). This examination was repeated three times within the day or within 3 days to calculate the relative standard deviation (RSD) respect-ively. The RSDs at different concentrations of iron within 1 day or within 3 days were lower than 6% (Table 1).
The magnetic nanoparticle sample was diluted accord-ing to the ferric ions concentration and acidified and colorized in the same way to measure ferric ions in iron chloride. The values of absorbance at 480 nm of the col-orized solution loaded onto the same 96-well plate were determined. The result indicated that this method could be used well to measure the iron concentration and fur-ther represent the MNP concentration (Figure 2).
The influence of blood content on the measure of MNPs In order to elucidate whether the tissue content could disturb the measurement of ferric ions from MNPs, the
MNP final concentration at 40 μg/ml of MNP was
pre-pared using saline containing 5% or 50% mouse whole blood. MNP in saline containing 5% or 50% blood was treated with/without proteinase K under 55°C to 65°C and centrifuged. The supernatant and washed precipitate were acidified and colorized respectively. The A480 results indicated that different treatments affected the Fe
-25 0 25 50 75 100 125 150 175 200 225
-0.5 0.0 0.5 1.0 1.5 2.0 2.5 3.0 3.5 4.0 4.5 5.0 5.5 6.0 6.5
A48
0
Concentration of Fe3+ (mg/L)
Model Logistic
Equation
y = A2 + (A1-A2)/(1 + (x/x0)^ p)
Reduced Chi-Sqr
10.72164
Adj. R-Square 0.99716
Value Standard Error
B
A1 0. 04882 0. 0029
[image:3.595.60.539.477.695.2]A2 10. 79326 1. 13168 x0 165. 01972 29. 50931 7 5 0 4 0 . 0 1 4 5 7 1 . 1 p
determination. Even with 5% of whole blood, the A480 decreased significantly, and this decrease could not be alleviated by treating with proteinase K which could
di-gest the protein that might combine with Fe3O4or Fe3+
(Figure 3). These results reminded that there were some organic components in mouse blood that could catch iron, and these components could be released suffi-ciently after proteinase K treatment.
Ferric ion determination after separating from
endogenous iron and ruining ferric ion binding groups The determination of ferric ions in blood indicated that different treatments affected Fe determination. Even with 5% of whole blood, the A480 decreased signifi-cantly, and this decrease could not be alleviated by treat-ing with proteinase K which could digest the protein
that might combine with Fe3O4 or Fe3+. These results
reminded that there were some organic components in mouse blood that could catch iron, and these compo-nents could be released sufficiently after proteinase K treatment. Carbonation is one of the methods that could effectively ruin the groups that might bind with iron from MNPs which were separated from endogenous iron existing in the blood under a magnetic field.
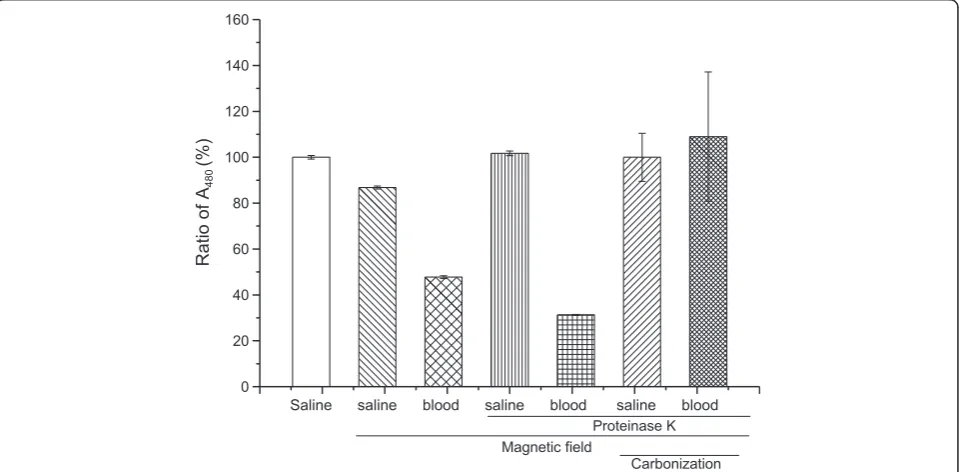
[image:4.595.56.291.111.320.2]The same aliquots of MNPs in saline containing 50% mouse blood were added into crucibles on a magnetic field to collect MNPs and washed two times with sa-line. The precipitates that were uncarbonized or carbo-nized in a muffle furnace were acidified and colorized. Compared with the saline standard control, almost 90% of MNPs could be recycled by the magnetic field. When MNPs in saline containing 20% of mouse blood were magnetically recycled and uncarbonized, only half of the ferric ions signal compared with that in saline control was given. Adding proteinase K did not allevi-ate this decrease. Fortunallevi-ately, after being digested with proteinase K, collected on a magnetic field, and carbo-nated in a muffle, the ferric ions signal could almost match the same level of MNPs in the saline control (Figure 4).
Table 1 The relative standard deviation in the determination of ferric ions (%)
Ferric ions (mg/L)
Within the day RSD (%)
Between days RSD (%)
A480 A480
Mean SD Mean SD
0 0.0458 0.0027 5.93 0.0462 0.0025 5.32
0.31 0.0540 0.0008 1.48 0.0554 1.90 × 10⁻³ 3.43
0.62 0.0665 0.0031 4.68 0.0682 0.0038 5.58
1.25 0.0878 0.0013 1.47 0.0894 2.00 × 10⁻³ 2.25
2.5 0.1301 0.0029 2.23 0.1329 0.004 2.97
5 0.2187 0.0049 2.25 0.2253 0.0093 4.13
10 0.4111 0.0084 2.03 0.4219 0.0127 3.02
20 0.8206 0.0297 3.61 0.846 0.0343 4.05
40 1.6834 0.027 1.60 1.6896 0.0202 1.20
80 3.442 0.0633 1.84 3.4985 0.0851 2.43
100 4.2956 0.0671 1.56 4.3911 0.1499 3.41
200 5.9739 0.036 0.60 5.9739 0.036 0.60
The RSD at different concentrations of ferric ions was the relative percentage of the standard deviation with mean value calculated from three
determinations of ferric ions in 1 day or 3 days, respectively.
0 20 40 60 80
-0.5 0.0 0.5 1.0 1.5 2.0 2.5 3.0 3.5 4.0
A480
Iron concentration (mg/L)
Fe3O4 FeCl3
[image:4.595.59.540.473.696.2]In order to detect how much iron in the different mouse tissues might disturb the MNP determination, the 10% mouse tissue homogenate in saline was pre-pared. One hundred microliters of tissue homogenate was mixed with 500μl of saline. After the digestion with proteinase K, carbonation in a muffle, and acidification with HCl, the endogenous ferric ions was determined
and calculated referencing to the standard as mentioned before. The results showed that endogenous iron con-tents were significantly different depending on the kind of tissue. Some tissues such as blood, spleen, and liver have a high concentration of iron, indicating that it is important to separate endogenous iron in MNP detec-tion (Figure 5). Even when the endogenous iron
0 20 40 60 80
-0.2 0.0 0.2 0.4 0.6 0.8 1.0 1.2 1.4 1.6 1.8 2.0
A480
Concentration of Fe3O4(mg/L) saline
Blood 30 µl
Blood 30 µl+Proteinanse K Blood 300 µl+Proteinanse K
[image:5.595.60.539.89.313.2]Supernatant of Blood 30 µl+Proteinanse K Supernatant of Blood 300 µl+Proteinanse K
Figure 3The ferric ions signal of MNPs in the mouse blood sample.The influence of blood content on MNP determination was measured by mixed mouse blood and MNPs. Proteinase K used to digest the blood proteins might bind with MNPs or ferric ions. Each assay was performed in triplicates. Data are presented as means ± standard deviations.
0 20 40 60 80 100 120 140 160
Ratio of A
480
(%)
Saline saline blood saline blood saline blood
Proteinase K Magnetic field
Carbonization
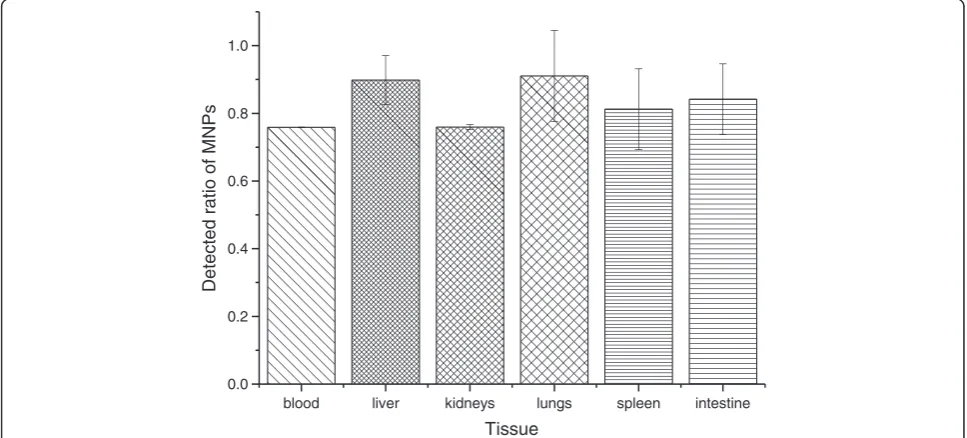
[image:5.595.59.539.459.695.2]concentration is low, the magnetic collection and car-bonation of MNPs are still important because the groups which might bind with ferric ions should be cleared be-fore colorization. Using the same method, the MNPs mixed in different homogenates of mouse tissue were collected under magnetic field after proteinase K diges-tion and carbonated followed by acidificadiges-tion and color-ization. The ratio of ferric ions concentration in different homogenates to that in saline was determined.
[image:6.595.57.538.88.311.2]The result showed that more than 80% of MNPs could be measured without endogenous iron disturbance (Figure 6).
Discussion
Because nanoparticles (NPs) have the unique physical and chemical properties compared with general sub-stance, their safety could not be well evaluated by nor-mal evaluation methods only. Apart from the toxicity of
blood liver kidney lungs spleen intestine 0
50 100 150 200 250 300 350 400 450 500
Fe
µ
g /g tissue
[image:6.595.56.540.475.694.2]Tissue
Figure 5Endogenous iron in different mouse tissues.Iron concentrations in mouse blood, liver, kidney, lung, spleen, and intestine were measured. Each assay was performed in triplicates. Data are presented as means ± standard deviations.
blood liver kidneys lungs spleen intestine 0.0
0.2 0.4 0.6 0.8 1.0
Detected ratio of MNPs
Tissue
NPs themselves, the safety of NPs was closely related with the administration way and the distribution path in the animal. Magnetic nanoparticles (MNPs) are drawing increasingly attention due to its unique purposes such as disease diagnosis and drug delivery. Though MNPs could be concentrated at the desired site lead by an ex-ternal magnet [21] and have been thought to be bio-degradable and biocompatible [22], the toxicity of iron in animals should not be ignored because overload of iron oxide has potential toxicity to blood, liver, spleen and kidneys [19,23], especially when the iron was in nanoscale. The limited studies on MNPs toxicity were pointed at the influence of MNP construction, size, sur-face chemistry and the design of their administration in the toxic outcomes as anticipated [24]. Establishing an experimental method to detect the concentration of MNPs in different tissue and organ of animals is very important to obtain the rule of MNPs distribution and metabolism and then to suspect the potential toxicity.
In this study, chemical colorimetric method to deter-mine the residual MNPs in the tissues of mice has been established. Whole blood was selected as the tissue to establish the MNPs determination method because of the blood half-life is a capital value indicating whether MNPs could evade uptake by RES [25-28]. Compared with other tissues, MNPs in blood was relatively difficult to be measured because the red blood cells contain large amounts of iron. Some research reported that the MNPs in the plasma could be separated with blood cell by cen-trifugation [29]. It is possible that the MNPs could ag-gregate and co-precipitate with blood cells. In this research the iron backgrounds in different tissues of mouse were determined elucidating the high bio-iron background in whole blood, spleen, liver and even in in-testine. Using ICP mass MNPs, signals in these samples could not be detected accurately especially when lower dose of MNPs was used. So using a magnet to separate MNPs from bio-iron is very important. Ultrasound was used to avoid the aggregation of MNPs and to break the blood cells preventing their precipitation on magnetic field. Proteinase K is effective enzyme to digest proteins might bind with MNPs. Carbonation in muffle and then acidification could oxidize ferrous ions to ferric ions which would be colorized by KSCN. The groups that might complex with ferric ions in tissues could be destroyed when the sample was carbonated. This method will be used to measure the MNPs distribution and metabolism in mice in our further research, espe-cially to validate whether this method could be used to check the MNPs coupled with antibody or other medi-cine groups.
In this study, we established a method to determine MNPs in mouse tissues without the disturbance of en-dogenous iron. Even being little tedious, the method is
safe and effective. Following more and more uses of MNPs in vivo take place, this method could be of great assistance in measurements of MNPs itself and MNPs coupled with drug or antibody, especially when the tis-sue containing high level iron and the animal treated with lower dose of MNPs.
Competing interests
The authors declare that they have no competing interests.
Authors’contributions
YW participated in the design of this study and established the method of the MNP determination. WZ determined the influence of tissue contents on the MNP assay. YW carried out the design of this study and participated in the animal experiments. QL, ND, JW, and ZG participated in the tissue separation and homogenation. GG, HH, and KW prepared the MNPs. DC participated in the design and the coordination of this study. All authors read and approved the final manuscript.
Authors’information
YW, a senior student at the School of Medicine, Shanghai Jiaotong University, voluntarily worked as a research assistant in the Beijing Institute of Pharmacology and Toxicology during the summer break. YW, is a professor engaged in biochemical pharmacology. JW is a technician engaged in immunological analysis and works with YW. WZ, QL, ND, and ZG were graduate students in the laboratory of YW in the Beijing Institute of Pharmacology and Toxicology. GG, HH, and KW are doing research with DC in the Department of Bio-Nano Science and Engineering, Shanghai Jiaotong University.
Acknowledgments
This work was supported by The National Basic Research Program of China (no. 2010CB933904) and grants from the National Natural Science Foundation of China (no. 30973562).
Author details
1Beijing Institute of Pharmacoloy and Toxicology, Beijing 100850, People’s
Republic of China.2School of Medicine, Shanghai Jiaotong University, Shanghai 200025, People’s Republic of China.3Department of Bio-Nano Science and Engineering, Key Laboratory for Thin Film and Microfabrication of Ministry of Education, Research Institute of Micro/Nano Science and Technology, Shanghai Jiao Tong University, Shanghai 200240, People’s Republic of China.
Received: 6 October 2012 Accepted: 12 November 2012 Published: 6 December 2012
References
1. Whitesides GM:The‘right’size in nanobiotechnology.Nat Biotechnol2003,
21:1161–1165.
2. Sengupta S, Eavarone D, Capila I, Zhao GL, Watson N, Kiziltepe T, Sasisekharan R:Temporal targeting of tumour cells and neovasculature with a nanoscale delivery system.Nature2005,436:568–572. 3. Pack DW, Hoffman AS, Pun S, Stayton PS:Design and development of
polymers for gene delivery.Nat Rev Drug Discov2005,4:581–593. 4. Cai D, Mataraza JM, Qin ZH, Huang ZP, Huang JY, Chiles TC, Carnahan D,
Kempa K, Ren ZF:Highly efficient molecular delivery into mammalian cells using carbon nanotube spearing.Nat Methods2005,2:449–454. 5. Gupta AK, Gupta M:Synthesis and surface engineering of iron oxide
nanoparticles for biomedical applications.Biomaterials2005,
26:3995–4021.
6. Xie J, Xu C, Xu Z, Hou Y, Young KL, Wang SX, Pourmand N, Sun S:Linking hydrophilic macromolecules to monodisperse magnetite (Fe3O4)
nanoparticles via trichloro-s-triazine.Chem Mater2006,18:5401–5403. 7. Mishra B, Patel BB, Tiwari S:Colloidal nanocarriers: a review on
formulation technology, types and applications toward targeted drug delivery.Nanomedicine2010,6:9–24.
9. Stepp P, Thomas F, Lockman PR, Chen H, Rosengart AJ:In vivointeractions of magnetic nanoparticles with the blood–brain barrier.J Magn Magn Mater2009,321:1591–1593.
10. Mailander V, Landfester K:Interaction of nanoparticles with cells.
Biomacromolecules2009,10:2379–2400.
11. Kral V, Sotola J, Neuwirth P, Kejik Z, Zaruba K, Martasek P:Nanomedicine— current status and perspectives: a big potential or just a catchword?
Chem List2006,100:4–9.
12. Zhang XQ, Jiang L, Zhang CL, Li D, Wang C, Gao F, Cui DX:A silicon dioxide modified magnetic nanoparticles-labeled lateral flow strips for HBs antigen.J Biomed Nanotechnol2011,7:776–781.
13. Li S, Liu HN, Jia YY, Deng Y, Zhang LM, Lu ZX, He N:A novel SNPs detection method based on magnetic nanoparticles array and single base extension.Theranostics2012,2:967–975.
14. Liu H, Li S, Liu LS, Tian L, He NY:An integrated and sensitive detection platform for biosensing application based on Fe@Au magnetic nanoparticles as bead array carries.Biosens Bioelectron2010,26:1442– 1448.
15. Gui C, Dai X, Cui DX:Advances of nanotechnology applied to biosensors.
Nano Biomed Eng2011,3:260–273.
16. Cui DX, Han YD, Li ZM, Song H, Wang K, He R, Liu B, Liu HL, Bao CC, Huang P, Ruan J, Gao F, Yang H, Cho HS, Ren QS, Shi DL:Fluorescent magnetic nanoprobes forin vivotargeted imaging and hyperthermia therapy of prostate cancer.Nano Biomed Eng2009,1:61–74.
17. Ch M, Li CY, He NY, Wang F, Ma NN, Zhang LM, ZhX L, Ali Z, ZhJ X, Li XL, Liang GF, Liu HN, Deng Y, Xu LJ, ZhF W:Preparation and characterization of monodisperse core-shell Fe3O4@SiO2microspheres and its application
for magnetic separation of nucleic acids fromE. coliBL21.J Biomed Nanotechnol2012,8:1000–1005.
18. Zhang HZ, Xie MQ, Kang Z, Shen H, Wang L:Targeted distribution of cis-platin magnetic nanoparticles in mice.J South Med Univ2008,
28:1756–1763.
19. Jain TK, Reddy MK, Morales MA, Leslie-Pelecky DL, Labhasetwar V:
Biodistribution, clearance, and biocompatibility of iron oxide magnetic nanoparticles in rats.Mol Pharm2008,5:316–327.
20. Yin QH, Liu L, Gu N, Huang Y, Liu L, Song JH, Cui Y:Determining the biodistribution of nano-59Fe-Fe
2O3-Glu in mice by59Fe tracer and
preparation.J Medical Postgraduate2005,18:312–317. 21. Kresse M, Wagner S, Pfefferer D, Lawaczeck R, Elste V, Semmler W:
Targeting of ultrasmall superparamagnetic iron oxide (USPIO) particles to tumor cellsin vivoby using transferrin receptor pathways.Magn Reson Med1998,40:236–242.
22. Wen M, Song L, Wei B, Li SL, Li BB:Preparation of superparamagnetic iron oxide nanoparticles and its acute toxicity to mice.Acad J Sec Mil Med Univ2007,28:1104–1108.
23. Zhai Y, Wang XL, Wang XM, Xie H, Gu HC:Acute toxicity and irritation of water-based dextran-coated magnetic fluid injected in mice.J Biomed Mater Res A2008,85:582–587.
24. Nel A, Xia T, Mädler L, Li N:Toxic potential of materials at the nanolevel.
Science2006,311:622–627.
25. Chen LT, Weiss L:The role of the sinus wall in the passage of erythrocytes through the spleen.Blood1973,41:529–537. 26. Choi HS, Liu W, Misra P, Tanaka E, Zimmer JP, Itty Ipe B, Bawendi MG,
Frangioni JV:Renal clearance of quantum dots.Nat Biotechnol2007,
25:1165–1170.
27. Decuzzi P, Ferrari M:The adhesive strength of non-spherical particles mediated by specific interactions.Biomaterials2006,27:5307–5314. 28. Storm G, Belliot SO, Daemen T, Lasic DD:Surface modification of
nanoparticles to oppose uptake by the mononuclear phagocyte system.
Adv Drug Deliv Rev1995,17:31–48.
29. Gao WH, Liu ST, Fan CX, Qi LY, Chen ZL:Pharmacokinetics, tissue distribution and magnetic resonance's response characteristics of folic acid-O-carboxymethyl chitosan ultrasmall superparamagnetic iron oxide nanoparticles in mice and rats.Acta Pharmaceutica Sinica2011,
46:845–851.
doi:10.1186/1556-276X-7-665
Cite this article as:Wuet al.:Establishment of a method to determine
the magnetic particles in mouse tissues.Nanoscale Research Letters2012
7:665.
Submit your manuscript to a
journal and benefi t from:
7Convenient online submission 7Rigorous peer review
7Immediate publication on acceptance 7Open access: articles freely available online 7High visibility within the fi eld
7Retaining the copyright to your article