Determinants of Demand for Sweet Potatoes at the Farm,
Retail and Wholesale Markets in Kenya
Mohamed Suleiman Mukras, Odondo Juma Alphonce
*, Gideon Momanyi
Department of Economics Maseno University Kisumu city-Kenya *Corresponding Author:alphonceodondo@gmail.com
Copyright © 2013 Horizon Research Publishing All rights reserved.
Abstract
Despite the potential of sweet potato in helping to meet Kenya’s food needs and poverty reduction through income generation, detailed information on sweet potato demand relations is unavailable to enable the traders plan their production and marketing activities. Thus, the study examined determinants of demand for sweet potatoes in Kenya with specific reference to Rachuonyo south district and its key market outlets. Out of 166 commercial farmers, fifty five wholesalers and an infinite number of retailers, one hundred and sixteen commercial farmers were selected using simple random sampling technique while 384 retailers were purposively selected. The 55 wholesalers were also included in the sample. Primary data were collected using questionnaires while secondary data were from respondents’ records. ANOVA indicated that demand for sweet potatoes varied significantly across the markets (F = 133.261, p = 0.000), due to differences in magnitude of effects of the independent factors on demand. The study results suggest the need for market segmentation by retailers and directing part of retail purchases to the markets dominated by low income groups, attitude change through awareness creation, financial empowerment of the sellers and selling varieties of sweet potatoes particularly those that are highly preferred by the final consumers.Keywords
Kenya, Sweet potato, Demand, Determinants, Wholesale, Retail, Farm, Markets1. Introduction
Sweet potato is one of the mankind’s high yielding crops with higher food value and total production per unit area than other staple food crops such as sorghum, maize, millet and rice. It is the world’s seventh most important food crop after wheat, rice, maize, barley and cassava [8], [31], [33]. In nutritional terms, sweet potatoes, particularly the yellow-fleshed varieties are good sources of vitamin A (300 micrograms/100 grams, fresh weight) [42]. A comparison with other food crops shows that it yields more calories per
unit area than maize and nearly as much as cassava, while its protein yield is far higher than the latter [9]. On worldwide scale, the economic importance of sweet potato among all food crops is exceeded only by cereals (wheat, rice, maize and barley) [33]. Although the crop is grown in more than 100 countries around the globe, about 90% is produced in Asia with just below 5% in Africa [42]. Sweet potato serves as a staple diet in many parts of Uganda, Nigeria, Rwanda, Tanzania, Angola, Burundi and Kenya [3]. China is the world’s largest producer with an annual harvest of 100 million tones. Uganda, Nigeria, Indonesia and Vietnam which follow china in production each harvest about 2.5 million tons of Sweet potatoes annually [8].
Sweet potato can adapt to a wide range of agro-ecological conditions and performs well in low-input agriculture. It is mostly grown at mid-elevations ranging from 800 to 200m above sea level. Africa’s production is concentrated in east Africa, particularly around the great Lakes region [11]. Sweet potato presence and adaptation to tropical areas, where per capita incomes are generally low and its nutritional value makes it an important component in food production and consumption [42]. It is increasingly becoming an important food security and famine relief crop during seasons of crop failure [18], [25]. About 2.5 million ha in Africa are under sweet potato with a total production of about 11 million tons [2]. Kenya is the seventh largest African sweet potato producer with an average yield of 8.2 tons/ha [10] against a potential of 50 tons/ha [8]. With the falling proportion of arable land per household due to population pressure, there is need to increase sweet potato yields to meet the current demand for food and to provide sufficient market information to potential sweet potato producers as a means to investment in the sweet potato industry. This, through trickledown effects, may help in reducing poverty at the local level. The main sweet potato producing regions in Kenya are South Nyanza, around Lake Victoria region particularly Rachuonyo south district; western; eastern and some parts of central and coastal regions [29], [28], [36].
harvesting of tubers commonly extends the crop’s season [22]. Sweet potato is largely grown for its tuberous storage roots, which are generally steamed or boiled [3]. The roots provide energy, proteins, vitamins A (particularly in orange fleshed sweet potato varieties), B1 and B2, ascorbic acid and folic acid in diets. Other important nutrients in sweet potato roots are calcium, phosphorous, sodium, iron and potassium [42]. Young sweet potato leaves are also consumed as vegetables in some countries and are rich in vitamins A, B1, B2, proteins and iron [42]. Generally, the storage roots of sweet potato and foliage are also important supplementary fodder in livestock production. Hence, Sweet potato plays an important role in ensuring food security, especially during droughts in large parts of Africa and is seen as an important ingredient in animal feed industries [18].
Despite the potential of sweet potato in helping to meet Kenya’s food needs and reduce poverty levels through income generation, detailed information on the sweet potato demand relations is unavailable to enable the farmers, wholesalers and retailers plan their sweet potato production and marketing activities. The lack of proper planning due to insufficient market information is partly evidenced by the high poverty levels in the major sweet potato growing regions such as Kuria and Rachuonyo, which have poverty levels of 79% and 77% respectively [13], [14]. According Rachuonyo South District development plan 2003 – 2009, cited by [23], household income per capita in the region is between US $ 70 – 75. This observation was further supported by the National Poverty Strategy Paper (NPSP) cited by [23], which indicates that 59% of the South Rachuonyo district populace live below a dollar a day. Lack of concrete market information on sweet potato demand has been supported by [1] who asserted that sweet potato is an “orphaned” crop, one that has been given little research attention and promotion. [19] in its working paper also indicated that lack of information on the sweet potato market structure and performance constraints the development of the sweet potato industry in the sub-Saharan Africa, and recommended that more market research be conducted in this industry. It is on this basis that the study sought to identify and examine determinants of demand for sweet potatoes in Kenya with specific reference to Rachuonyo south district and its key market outlets. Findings if this study may provide literature for subsequent research in sweet potatoes’ industry not only in Kenya but also other sweet potatoes producing regions in the world. This study was based on the consumer demand theory which highlights theoretical relationships between demand for a commodity and its determinants.
2. Literature Review
Kenya has various sweet potato marketing systems that are dominated by women [37], and run parallel, some with forward linkages from the villages, others with market wholesalers having backward linkages into the villages.
These marketing systems embraces: Village level retail markets which sell small quantities in heaps usually supplied from small surpluses of farmers; local town markets which are usually supplied by farmers-traders who collect small supplies from farms, transshipment markets for big urban markets and the final destination markets which are the wholesale markets of Nairobi, Kisumu and Mombasa cities of Kenya [9]. Research by [31] on the development and promotion of sweet potato products in western Kenya revealed that sweet potato utilization has for a long time been limited to boiling, roasting and chewing raw. However, diversified sweet potato utilization had an indication for improving food security and local household incomes of the region. A study by [40], and [37] concurs with this finding as they observed that besides boiling or selling sweet potato as raw food, Kenya’s sweet potato is processed and used to make chapati, mandazi, chips and cakes. Consumers prefer sweet potato products to pure wheat flour as observed by 82.4% of the consumers interviewed (Owuor, 1996 cited in [9]. Its consumption also depends on the seasons as noted by 78% of the respondents interviewed [37]. Past trends show that unit prices of sweet potatoes in Kenya have been increasing since the year 2003, a likely indication of rising demand for the crop [37].
In terms of annual per capita consumption of sweet potatoes, Kenya ranks fifth among the African countries after Burundi, Rwanda, Uganda, and Madagascar [17]. Due to the semi subsistent production patterns of sweet potato, consumption figures are expected to be significantly higher in rural than in urban areas [35]. A study by [34] revealed that over 90% of households in major cities consume fresh sweet potatoes at least once per week. Moreover, richer households in Nairobi city of Kenya consume sweet potatoes more often than poorer ones.
A study by [25] on livelihood diversification strategies among small holder farmers in the southern Nyanza region of Kenya reveals that sweet potato is among the most important crops that help in food security in the area. However, the land under sweet potato and other food crops have been decreasing over time as most of the farmers are shifting to tobacco growing which is perceived to have ready market and clear market prices set by the tobacco companies as opposed to other agricultural products whose market structures are not well under stood by the farmers. From [9], it is clear that many local people who live in urban, peri-urban and rural areas have the potential of deriving their incomes from various activities of sweet potato production to consumption system. These activities include production, harvesting, assembling, processing, transportation and marketing.
post-harvest losses. This resulted in increased sweet potato national output from 400 metric tons in 2010 to 690 metric tons in 2011, a 72% increase [1]. Generally such rise in outputs may be beneficial if they correspond to the demand for the produce. However, determinants of demand for such outputs at the different channel levels are not well understood. This observation is supported by [1], who asserted that sweet potato is an “orphaned” crop, one that has been given little research attention and promotion. A study by [32] also showed that lack of sufficient market information on the role played by various market factors on the demand for sweet potatoes is a barrier to entry into the sweet potato industry. From the literature, it is clear that sweet potato has the potential of helping to meet Kenya’s food needs and reduce poverty levels through income generation. However, its full exploitation is still constrained by insufficient market information. Establishment of sweet potatoes’ demand relations is thus imperative as it may help the traders in singling out the market factor that may be manipulated to help promote demand for the crop not only in Kenya but also other sweet potatoes growing countries.
3. Materials and Methods
3.1. Study Area
This study focused on Rachuonyo south district where sweet potato production, processing and marketing were common. The district is in the southern Nyanza region of Kenya. It was curved out of Rachuonyo district which lies between longitudes 34˚25 and 35˚0 East and latitudes 0˚15 and 0˚45 south. Sweet potato related activities in the district were concentrated in Kabondo division, which covered about 141.5 km2 [15]. Sweet potatoes produced in the region were being sold locally in the district and to other market outlets such as Ahero town, Nakuru town and Nairobi city.
3.2. Research Design
The study adopted both exploratory and correlational research designs .Exploratory design helped in gaining an insight into the sweet potato market while correlational design perpetuated the understanding of relationships among the study variables.
3.3. Model Specification
From microeconomic theory, demand for a product is a function of the product’s own price, price of substitute commodities, taste and preference of consumers, consumers’ attitude towards the commodity, product’s quality and other characteristics, extent of awareness creation, consumers’ income levels among others [24]. These factors can be presented in a generalized functional model given in equation 1.
Qd = ƒ (Py, Ps, Tp, A, I, PD, AD) (1)
Where:
Qd = Quantity demanded for a commodity Py = Unit price for a commodity
Ps = Price of substitute commodities Tp = Taste and Preference of consumers
A = Attitude of the consumers towards the commodity I = Income levels of buyers
PD = Extent of product differentiation
AD = Extent of awareness creation by the sellers
A stochastic form of the generalized demand function was expressed as;
ui i i s
i i p y
di
B
P
T
A
I
P
PD
AD
e
Q
=
iβ1 iβ2 β3 β4 iβ5 β6 β7(2) Equation 2 was subsequently log-transformed and yielded equation 3, which was finally, estimated using Ordinary Least Square (OLS) technique.
ℓnQdi = β0 + β1ℓnPyi + β2ℓnTpi+ β3ℓn Ai +β4ℓnIi+ β5ℓnPs
+ β6ℓnPD + β7ℓnAD + μi
(3) Where β0 = In B, β1, β2, β3, β4, β5 , β6, β7 are partial elasticities of demand with respect to unit price (Py) of sweet potatoes, taste and preference of buyers (Tp ), attitude of the buyers towards sweet potatoes (A), buyers level of incomes (I), price of substitute commodities (Ps), extent of sweet potato differentiation (PD) and the extent of awareness creation (AD).3.4. Validity and Reliability of the Data Collection Instruments
To enhance validity of the research instruments, a team of four experts in the areas of agricultural economics were given the instruments for thorough scrutiny and any amendment in the contents was done in accordance with the research objective. Reconnaissance survey was also done in the months of September- December 2012. According to [7], a reconnaissance survey is important in clarifying the starting point of one’s research. The researcher thus, used the reconnaissance survey to familiarize with the situation in the sweet potato marketing system in the study area and locate elements of the study population and the study units. During this period, tests and pretests of questionnaires were done to make any necessary modifications before the actual data collection.
3.5. Data Sources and Data Collection Methods
product differentiation and taste and preference of buyers. The likert scale measures attitudes or opinions by asking people to respond to a series of statements about a topic, in terms of the extent to which they agree with them, and so tapping into the cognitive and effective components of attitude[27], [26]. Secondary data were obtained from: farmers, retailers, and wholesalers’ records, books and journals.
3.6. Sampling Procedures
The sampling frame was a list of 166 farmers; 55 wholesalers and an infinite number of retailers [36].
A total of 116 farmers, fifty five (55) wholesalers and 384 retailers were sampled. All the 55 wholesalers were interviewed and individual farmers selected using simple random sampling technique while the retailers were purposively selected
3.7. Data analysis and Presentation Techniques
Ordinary least square technique (OLS) was used to estimate various parameters associated with the study variables and t-tests conducted at 95% level of significance to determine the significance of parameters estimated. One way ANOVA was also used to test if there were significant differences in the demand for sweet potatoes in the markets (farm, wholesale and retail).
4. Results
4.1 Response Rate
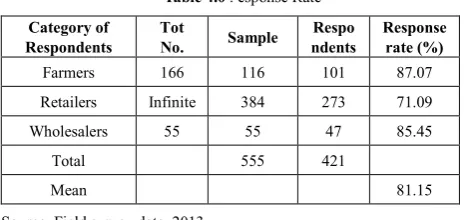
[image:4.595.56.289.580.690.2]Table 4.0 shows that out of the 555 anticipated respondents, only 421 responded to the research questions. This gave a response rate ranging between 71.09% to 87.07% with a mean response rate of 81.15%. The mean response rate was considered appropriate as it conforms to the views of [21] who asserted that a response rate of 80% is a de facto standard.
Table 4.0 . esponse Rate
Category of
Respondents Tot No. Sample ndents Respo Response rate (%)
Farmers 166 116 101 87.07 Retailers Infinite 384 273 71.09 Wholesalers 55 55 47 85.45
Total 555 421
Mean 81.15
Source: Field survey data, 2013
4.2. ANOVA results on Sweet Potato Demand at the Farm, Retail and Wholesale Markets
Table 4.1 shows that the mean natural log of demand at
the farm level was 8.34 with the standard deviation of 0.52 while the mean natural log of demand at the retail level was 7.93with the standard deviation of 0.60. Wholesalers had the highest mean natural log of demand standing at 9.38 with mean deviation of 0.47. The minimum natural log of demand at the farm level was 7.04 and the maximum was 9.19. The minimum natural log of demand at the retail level was 5.30 with the maximum natural log of demand as 9.11. Wholesalers recorded the highest minimum natural log of demand (8.37) and maximum natural log of demand (10.31).
Table 4.1. Descriptive statistics on demand for sweet potatoes at the farm,
retail and wholesale markets
Category of
respondent N Mean Std. Dev Error Std. Min Max
Farmer 101 8.34 .52 .05 7.04 9.19 Retailers 273 7.93 .60 .04 5.30 9.11
Wholesalers 47 9.38 .47 .07 8.37 10.31 Total 421 8.19 .73 .04 5.30 10.31 Source: computed from survey data, 2013
Table 4.2 show that the “between groups” variation “86.75” was due to interaction in samples between the groups while the “within” groups variation “136.05” was due to differences within individual samples. The table also provides the F statistic of 133.26 at p = 0.000 < 0.01. This indicates that sweet potato demand varied significantly across the channel levels.
Table 4.2. ANOVA outputs for the sweet potato demand at Farm,
Wholesale and Retail market Sum of
Squares df Square Mean F Sig. Between
Groups 86.75 2 43.37 133.26 .000 Within
Groups 136.05 418 .33 Total 222.79 420 Source: computed from survey data, 2013
4.3. Sweet Potato Farm Level Demand Model
[image:4.595.313.554.678.748.2]ANOVA results in table 4.3 shows that the estimated model explains well the deviations in the demand for sweet potatoes at the farm level as depicted by F(7, 93) = 35.759 at p = 0.000.
Table 4.3. ANOVA Results for the sweet potato demand model at the
farm level
Model Squares Sum of df Square Mean F Sig.
Regression 19.40 7 2.772 35.759 .000a
Table 4.4 shows that the proportion of variance in the demand explained by the independent variables is 70.9% while 72.9% variations in the demand could be explained by the variations in the independent variables. The value of Durbin-Watson is 1.794, which is close to 2, an indication of the absence of serial correlation.
Table 4.4. Summary of Sweet potato farm level demand model
Model R Square R Adjusted R Square Std. Error of the Estimate
Durbin-Wats on
1 .854a .729 .709 .2784097 1.794
Source: computed from survey data, 2013
Table 4.5 shows that out of the seven independent variables, three independent variables which include: Price of substitute goods (β = 0.164, p = 0.045 < 0.05); income level of dominating buyers (β = 0.504, p = 0.000 < 0.01) and buyer preference (β = 0.308, p = 0.018 < 0.05), all had positive significant effects on the demand for sweet potato. However, the unit price of sweet potato (β = -0.039, p = 0.805 > 0.05) had insignificant negative effect on the demand. Consumer attitude (β = 0.143, p = 0.241 > 0.05), Sweet potato differentiation (β = 0.165, p = 0.105> 0.05) and extent of awareness creation (β = 0.31, p = 0.754 > 0.05) had insignificant positive effects on the demand for sweet potato at the farm level. The Variance of Inflation Factors (VIFs) corresponding to the independent variables range between 1.034 and 3.296.
Table 4.5. Estimated natural log regression coefficients for variables in
the farm level demand model
Variable Coefficients t Sig. VIF (Constant) 7.069 14.745 .000
Py -.039 -.247 .805 1.034
Ps .164 2.034 .045 1.712
I .504 6.556 .000 1.810 Tp .308 2.399 .018 3.296
A .143 1.180 .241 2.334 PD .165 1.639 .105 2.422 AD .031 .314 .754 1.780
N/B: Sweet potato unit price (Py),Price of substitute commodities (Ps), Preference of buyers (Tp),
Attitude of the consumers towards the commodity (A) Extent of awareness creation (AD)Income levels
of the dominating buyer (I),Sweet potato differentiation (PD),
4.4. Sweet Potato Wholesale Demand Model
Table 4.6 shows that F (7, 39) = 14.341, which is significant at p = 0.000, a likely indication that the wholesale sweet potato demand model fits well the research data.
Table 4.6. ANOVA results for the Wholesale sweet potato demand model
Model Squares Sum of df Square Mean F Sig.
Regression 7.373 7 1.053 14.341 .000a
Residual 2.865 39 .073 Total 10.238 46
Source: computed from survey data, 2013
Table 4.7 shows that the proportion of variance in the demand explained by the independent variables is 67.0% while 72.0% variations in the demand could be explained by the variations in the independent variables. The value of Durbin-Watson is 1.653.
Table 4.7. Summary of sweet potato wholesale demand model
R Square R Adjusted R Square R Square Change F Change Sig. D-W test
849a .720 .670 .720 .000 1.653
Source: computed from survey data, 2013
Table 4.8 Shows information effects of individual independent variables on the dependent variable. Unit price of sweet potato (β = -0.999, p = 0.003 < 0.01) had a negative significant effect on the demand for sweet potato at the wholesale level. Income of the dominating buyer (β = 0.310, p = 0.042 < 0.05); Taste and preference of the buyers (β = 0.311, p = 0.036 < 0.05) and sweet potato differentiation (β = 0.357, p = 0.017 < 0.05) all had positive significant effects on the demand. The unit price of substitute commodities (β = 0.029, p = 0.830 > 0.05); Buyers’ attitude (β = 0.031, p = 0.819 > 0.05 and awareness creation (β = 0.031, p = 0.857 > 0.05) all had positive insignificant effects on the demand. The Variance of Inflation Factors (VIFs) corresponding to the independent variables range between 1.472 and 2.771.
Table 4.8. Estimated natural log regression coefficients for variables at
the wholesale demand model
Coefficients B Error Std. t Sig. VIF
(Constant) 11.710 1.133 10.333 .000
Py -.999 .311 -3.215 .003 1.472
Ps .029 .134 .216 .830 2.314
I .310 .147 2.104 .042 1.912 Tp .311 .143 2.175 .036 2.771 A .031 .132 .231 .819 2.149 PD .357 .144 2.487 .017 1.645 AD .031 .173 .181 .857 1.633 N/B: Sweet potato unit price (Py),
Price of substitute commodities (Ps)
Preference of buyers (Tp),
Attitude of the consumers towards the commodity (A) Income levels of the dominating buyer (I),
4.5. Sweet Potato Retail Demand Model
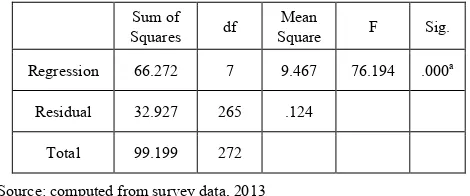
[image:6.595.58.293.174.272.2]The ANOVA results in Table 4.10 suggest that the estimated demand model explains well the deviations in the demand for sweet potato at the retail level {F (7, 265) = 76.194 at p = 0.000}.
Table 4.10. ANOVA Results for the sweet potato demand model at the
retail market.
Sum of
Squares df Square Mean F Sig. Regression 66.272 7 9.467 76.194 .000a
Residual 32.927 265 .124
Total 99.199 272
Source: computed from survey data, 2013
Table 4.11 shows that the proportion of variance in the demand explained by the independent variables is 65.9% while 66.8% variations in the demand could be explained by the variations in the independent variables. The value of Durbin-Watson is 1.790, which is close to 2, an indication of the absence of serial correlation.
Table 4.11. Summary of sweet potato Retail demand model
R R Square
Adjast. R
Square F Change
Sig. F Change
DW Stat
.817a .668 .659 76.194 .000 1.790
[image:6.595.58.295.470.637.2]Source: computed from survey data, 2013
Table 4.12. Estimated natural log regression coefficients for variables in
the retail demand model
variables Coefficients t Sig. VIF
Constant 13.750 23.123 .000
Py -1.688 -11.021 .000 1.591
Ps .034 .427 .670 1.452
I -.309 -4.299 .000 1.266
Tp .161 2.904 .004 1.590 A .320 5.063 .000 1.478 PD .205 3.217 .001 1.370 AD .048 .771 .441 1.346 Source: computed from survey data, 2013
N/B: Sweet potato unit price (Py),
Price of substitute commodities (Ps)
Preference of buyers (Tp),
Attitude of the consumers towards the commodity (A) Income levels of the dominating buyer (I),
Sweet potato differentiation (PD), Extent of awareness creation (AD)
Table 4.12 shows that out of the seven independent variables, two independent variables which include: Unit price of sweet potato (β = -1.688, p = 0.000 < 0.01) and
Consumer’s level of income (β = -0.309, p = 0.000 < 0.01) both had negative significant effects on the demand for sweet potato. Consumer taste and preference (β = 0.161, p = 0.004 < 0.01), Consumer attitude (β = 0.320, p = 0.000 < 0.01) and sweet potato differentiation (β = 0.048, p = 0.001< 0.01) all had positive significant effects on the demand for sweet potato at the retail level. However, the price levels of substitute products (β = 0.034, p = 0.670 > 0.05) and extent of awareness creation (β = 0.048, p = 0.441> 0.05) had positive insignificant effects on the demand for sweet potatoes at the retail level. The Variance of Inflation Factors (VIFs) corresponding to the independent variables range between 1.266 and 1.591.
5. Discussion of Results
The study revealed that a 1% increase in the farm gate prices would yield an insignificant downward change of 0.039% in the demand for sweet potatoes at the farm level. However, a similar percentage change in the retail prices would yield a significant downward change of 1.688% in the demand for sweet potato at the retail market and 0.999% at the wholesale level. These results were in agreement with [41] who analyzed demand relations of fresh sweet potatoes in the St. Louis and Chicago markets and showed that a significant increase in wholesale price would decrease quantity demanded and vice versa. The insignificant negative effect of the price change on the demand for sweet potato at the farm level could be ascribed to the farmers’ allegation that farm gate prices were largely dictated by the wholesalers who were their major customers. It also reinforces [1] assertion that lack of a body to help farmers bargain for good prices had exposed them to traders who offer low prices.
It was further established that a 1% increase in the prices of sweet potato substitutes would lead to a significant 0.164% increase in the demand for sweet potatoes at the farm level. A similar percentage change would have insignificant increase in the demand at the retail level by 0.034 % and 0.029% at the wholesale level. Ordinarily, when the price of a competing good increases it becomes relatively expensive. According to Sir John R. Hicks, this scenario would lead to substitution effects, where some units of the expensive good would be forgone for extra units of the cheaper commodity [5]. This implies that when the prices of sweet potato related goods increase, then the demand for sweet potato would increase ceteris paribus.
downward change of 0.309% in the demand for sweet potatoes at the retail level. This negative effect is in line with [12], who found that for every unit increase in the natural log of a household’ wage in Papua New Guinea, demand for sweet potato declined by 4.4% points. The negative effect of the income increase on the demand for sweet potato at the retail level is a likely indication that sweet potato is an inferior commodity.
The study also revealed that a 1% change in the consumer attitude would have a significant upward change of 0.320% on the demand for sweet potatoes at the retail level. A similar % change would have an insignificant upward change of 0.031% on the demand for sweet potatoes at the wholesale level and 0.143% at the farm level. These findings differ from the results of [4] who revealed lack of statistical evidence that could support assuring that there was a positive relationship between a positive attitude towards a service or a product and a higher purchasing behaviour. He however, noted that there was low consumer involvement in the purchase of the company’s product, as a result, the consumers could first form their beliefs toward the company before deciding to purchase or not to purchase from the company. In this study however, sweet potato is a staple food crop which to a considerable extent, constitute the diet of low income earners. The extent of buyer involvement is thus higher, a scenario that could have led to the significant effect of consumer attitude on the demand for sweet potatoes at the retail level. These findings conform to the economic theory which postulates a positive association between a positive attitude towards a service or a product and a higher purchasing behavior.
According to [5], economists agree that other forces besides price and marginal utility play a role in determining what people demand. Most of the forces fall under consumer taste. On this basis, the study assessed the effect of consumer taste and preference on the demand for sweet potatoes. It was established that a 1% change in the consumer taste and preference would yield an upward change of 0.308% in the demand for sweet potatoes at the farm level and 0.311% at the wholesale level. A similar percentage change would yield an upward change of 0.161% in the demand at the retail level. These findings were in agreement with the results of [30], who revealed significant influence of taste on market demand for sweet potatoes in the USA. They however, observed that when experience attribute of taste was introduced in their analysis, the respondents displayed significant preference ordering. In this study, since sweet potato consumers were not directly involved, it was rather difficult to assess their preference ordering.
Market awareness involves letting the existing and potential customers know that information or service exists and is available. In the sweet potato industry, sellers could carry out awareness creation by simply calling or sending text messages to their existing customers on the availability of their products. The study assessed the effect of this undertaking on the demand for sweet potatoes and revealed
that a 1% change in the extent of awareness creation on the existence and availability of sweet potatoes at the farm and wholesale levels yielded insignificant upward change of 0.031% in the demand for sweet potatoes in both cases. On the other hand, a 1% change in the extent of awareness creation on the existence and availability of sweet potatoes at the retail market would lead to an upward change of 0.048% in the demand at the retail level. These insignificant effects could be due to lack of intensive persuasive awareness creation by the sellers. Persuasive awareness/ advertising in competitive markets was identified by [20] as a tool that significantly influences consumer behaviour in differentiated markets, thus, the demand for the commodity.
Generally diversity is considered as the staff of economic life and there are many approaches to relate this notion to the variety of choices that confront consumers [38]. According to [16] one of the important tools of dealing with diversity or variety is product differentiation. The current study revealed that sweet potato was largely differentiated on the basis of colour, taste, size and consumer preference. The effect of these differentiation dimensions on the demand for sweet potato was established by first asking the respondents to give the extent to which product differentiation affected their sales volume. The outcome of each respondent’s response was then regressed with its corresponding sales volume, and the results showed that a percentage change in the extent of sweet potato differentiation would have an upward significant change of 0.205% in the demand at the retail level and 0.357% at the wholesale level. It however, had an insignificant upward change of 0.165% in the sweet potatoes demand at the farm level. Although sweet potatoes were not being differentiated in terms of prices as would be expected in contestable markets, the sellers who had the most preferred type of sweet potatoes would sell more than their counter parts. More sales volume depicts high demand for the given good ceteris paribus.
6. Conclusions
Based on the results, the study concludes that demand for sweet potatoes in Kenya significantly varies across the markets due to sundry factors that vary in their magnitude of effects on the demand at the different markets. The inverse relationship between demand and consumer incomes at the retail market implies that sweet potato is an inferior good.
7. Recommendations
dominating buyers, tastes and preferences as well as sweet potato differentiation at the wholesale level, suggest that there is need to financially empower the sweet potato retailers who are the major buyers of wholesale products and to promote sweet potato differentiation at the wholesale market. The wholesalers should also handle varieties of sweet potatoes, particularly those that are highly preferred by the retailers. At the same time, the retailers should engage in selling a variety of sweet potatoes and improve on their sales volume through value addition. This is possible since sweet potato differentiation as well as the changes in consumer tastes and preferences also have significant influence on the demand for the retail sweet potatoes. Because consumer attitude significantly affects demand for sweet potato at the retail level, there is need for attitude change. This can be done through awareness creation particularly on the nutritional values of sweet potato so that it is not seen as “a poor man’s good”. Since sweet potato is an inferior commodity, retailers should segment their markets and increase in their stocks be directed to the markets perceived to be dominated by the low income group.
7.1.
Recommendations for Further Research
The current study depended on cross sectional data and therefore, a similar research should be conducted using time series information to determine long term effects of the exogenous variables on sweet potato demand at the farm, retail and wholesale markets.
7.2. Limitations of the Study
Whereas this research makes significant contributions to the body of knowledge on sweet potatoes’ demand relations, it is important to evaluate the results in the context of its limitations. The first limitation is that the study focused only on sweet potatoes’ market in Rachuonyo south district and its key market outlets. This focus on a single region may make the results not generalizable to other sweet potato producing areas. However, confining the study to traders in a single regional setting conferred the obvious advantage of control for regional effects.
Secondly, the study used likert scale to capture perceptions of respondents on certain variables such as buyers’ attitude and tastes. Although this practice is prevalent in contingency based research, its objectivity has raised concern [6]. None the less, subjective measures have been advanced as consistent and based on those aspects that are most appropriate to respondents and that are most prone to shape their behaviour and guide their actions [39]
REFERENCES
[1] Andea G. (2012): “Sweet potato production up in Kenya”, News updates posted at Kenya Agricultural Commodity Exchange LTD website on Monday 23, April 2012 at <http://www.kacekenya.co.ke/news.asp?ID=275>. [ 1] [2] Ateka, E. M. (2004): Biological and Molecular
characterization of poty viruses infecting sweet potato: Unpublished PhD thesis, University of Nairobi, Kenya. [3] Carey, E.E, Gichuki S.T., Ndolo, P J, Turyamureeba, G.,
Kapinga, R. and Lutaladio, N.B. (1997): Sweet potato breeding for Eastern Central and Southern Africa: An Overview. In: Proceedings of the 4th Triennial Congress of the African Potato Association. Pretoria South Africa 23-28 Feb. 1997, pp89-93
[4] Carvalho C. A (2008): Impact of Consumer Attitude in Predicting Purchasing Behaviour, A paper available at <www.iaso.com.br/.../Impact%20of%20Consumer%20Attitu de%20in%20>, accessed on 4th of May, 2013.
[5] Colander D. (1993: Micro economics, Irwin / McGraw Hill companies, Inc.
[6] Chenhall, R. H. (2003): Management control systems design within its organizational context: findings from contingency-based research and directions for the future. [7] Dillon P. (2008): Reconnaissance as an unconsidered
component of Action Research. Action Learning Action research Journal 13
[8] Food and Agricultural Organization (FAO) (2002): Available at<http://apps.fao.org/>, accessed on 8th, June, 2009.
[9] Food and Agricultural Organization (FAO) (1997): Available at<http://apps.fao.org/>, accessed on 8th, June, 2009
[10] Food and Agricultural Organization (FAO) (2003): Available at <http://apps.fao.org/>, accessed on 8th , June, 20013.
[11] Gebson, R.W., Mwanga, R.O.M., Kasule, S., Mpembe, I and Carey, E.E. (1997): Apparent absence of viruses in most symptomless field-grown sweet potato in Uganda. Ann. Appl. Biol.130:481-490
[12] Gibson J. (2000): Food Demand in Rural and Urban Sectors of Papua New Guinea, a paper available at <www.management.ac.nz/Departments/staff/.../FoodDeman dUnitech. pdf>, accessed on 28th June , 2013.
[13] Government of K enya (GOK) (2003): Kuria District Development Plan, Government of Kenya, Government Printer, Nairobi.
[14] Government of K enya (GoK) (2010): Rachuonyo District Development Plan, Government of Kenya. Government Printer, Nairobi.
[15] Government of K enya (GoK) (2008): Rachuonyo District Development Plan . Government of Kenya. Government Printer, Nairobi.
[16] Helpman E, and Krugman P. (1985): Market Structure and Foreign Trade, Cambridge, MA, MIT Press. [14]
pp5-9, Lima, Peru
[18] International Potato Centre (CIP). (1998: Annual Report, pp 8-9. [15]
[19] International Potato Centre (CIP) (2009): Unleashing the potential of sweet potato in Sub-Saharan Africa: Current challenges and way forward, Social Sciences, Working Paper No.2009-1
[20] Jiang B. and Srinivasan K (2012): Pricing and Persuasive Advertising in a Differentiated Market, a paper available at<apps.olin.wustl.edu/faculty/jiang/jiangsrinivasan2012.pdf >,Accessed on 10th, June, 2013 [17]
[21] Johnson, T. P. and Owens, L. , 2003-08-16 "Survey Response Rate Reporting in the Professional Literature" Paper presented at the annual meeting of the American Association for Public Opinion Research, Sheraton Music City, Nashville. Available at
http://www.allacademic.com/meta/p116171index.html [22] Kapinga, R.E., Ewell, P.T., Jeremiah, S.C and Kileo, R.
(1995): Sweet potato in Tanzanian farming and food systems: Implications for research. CIP, Sub-Saharan Africa region, Nairobi, Kenya .Ministry of Agriculture, Dar-Es-salaam, Tanzania.
[23] Kokech (TKMU) (2009): The Grassroots Alliance for Community Education, a Community Based Organization (CBO) Report. Available at <http://www.graceusa.org/kokec h/index.php>, accessed on 4th August, 2012) [19]
[24] Koutsoyiannis, A. (1993): Modern Microeconomics, 2nd edition, ELBs with Macmillan, London.
[25] Kibwage, J. K., Odondo, A. J., Momanyi, G. M (2009): Assessment of Livelihood Assets and Strategies among Tobacco and Non-tobacco Farmers in South Nyanza region, Kenya.
[26] Likert, R. (1932): "A Technique for the Measurement of Attitudes". Archives of Psychology 140: 1–55.
[27] Mc leod, S.A (2008): likert scale-simply psychology. Retrieved From http://www.simply
psychology.org/likert-scale.html.
[28] Ministry of Agriculture (MoA) (1999): Annual Report, Nairobi, Kenya.
[29] Ministry of Agriculture (MoA) (1992): Annual Report, Nairobi, Kenya.
[30] Nalley L., Darren H., Greg P (2005): Impacts of Taste, Location of Origin, and Information on Market Demand for Sweet potatoes, Department of Agricultural Economics Mississippi State University, Bulletin no. 1142, available at
<msucares.com/pubs/bulletins/b1142.pdf> accessed on 6th, march , 2013
[31] Nungo R.A., Ndolo P.J., Kapinga R & Agili S (2007): Development and promotion of sweet potato products in Western Kenya, Proceedings of the 13th ISTRC Symposium, pp. 90 – 794.
[32] Odondo A. J, (2013): Market structural characteristics, conduct and performance of sweet potato industry in Kenya; A case of Rachuonyo south district and its key market outlets, Un published PhD Thesis, Maseno University- Kenya [33] Opiyo S. A (2011): Evaluation of efficacy of selected plant
extracts in the management of Fungal and bacterial diseases which affect sweet potato. Unpublished PhD thesis, Maseno University, Kenya. [29]
[34] Omosa, M. (1997): Current and Potential Demand for Fresh and Processed Sweet potato Products in Nairobi and Kisumu, Kenya. International Potato Center, Lima.
[35] Qaim, M. 1999: The Economic Effects of Genetically Modified Orphan Commodities: Projections for Sweet potato in Kenya. ISAAA Briefs No. 13. ISAAA: Ithaca, NY and ZEF: Bonn.
[36] Rongo Sweet Potato Growers Organization (ROSPOGO) (2012), Membership Report.
[37] Rono C.S, Wanyama J.M, Mose L.O, Mutoko C. M., Lusweti C.,. Wanjekeche E. and Wachiye B (2006): Assessing The Impact Of Sweet Potato Production and Utilisation Technologies On Food Security In North Rift Region. [38] Rosen. S. (2002): “Markets and diversity”, American
Economic Review, Vol. 92, No. 1.
[39] Vander stede, W. A. (2000): The relationship between two consequences of budgetary controls: Budgetary slack creation and managerial short term Orientation.
[40] Wanjekeche E., Luswet C., Wagasa V., and Nkonge C. (1999): Evaluation of storage methods of sweet potato for increases food security on small holder farms. Proceedings of Pre-conference mini-papers prepared for the KARI/DFID NARP II Project. End of Project Conference, 23rd. -26th.March, 1999.Nairobi, Kenya.
[41] Wollo J. W and Jones R. (1996): Demand Relations of Fresh Sweet potato in the St. Louis and Chicago Markets Cooperative Research, Lincoln University, Jefferson City, The Journal of Hort Science Volume 31, No.3