www.hydrol-earth-syst-sci.net/13/687/2009/ © Author(s) 2009. This work is distributed under the Creative Commons Attribution 3.0 License.
Earth System
Sciences
Some practical notes on the land surface modeling in the
Tibetan Plateau
K. Yang, Y.-Y. Chen, and J. Qin
Laboratory of Tibetan Environment Changes and Land Surface Processes, Institute of Tibetan Plateau Research, Chinese Academy of Sciences, Beijing 100085, China
Received: 21 January 2009 – Published in Hydrol. Earth Syst. Sci. Discuss.: 27 February 2009 Revised: 25 April 2009 – Accepted: 15 May 2009 – Published: 27 May 2009
Abstract. The Tibetan Plateau is a key region of land-atmosphere interactions, as it provides an elevated heat source to the middle-troposphere. The Plateau surfaces are typically characterized by alpine meadows and grasslands in the central and eastern part while by alpine deserts in the western part. This study evaluates performance of three state-of-the-art land surface models (LSMs) for the Plateau typical land surfaces. The LSMs of interest are SiB2 (the Simple Biosphere), CoLM (Common Land Model), and Noah. They are run at typical alpine meadow sites in the central Plateau and typical alpine desert sites in the western Plateau.
The identified key processes and modeling issues are as follows. First, soil stratification is a typical phenomenon beneath the alpine meadows, with dense roots and soil or-ganic matters within the topsoil, and it controls the profile of soil moisture in the central and eastern Plateau; all models, when using default parameters, significantly under-estimate the soil moisture within the topsoil. Second, a soil surface resistance controls the surface evaporation from the alpine deserts but it has not been reasonably modeled in LSMs; an advanced scheme for soil water flow is implemented in a LSM, based on which the soil resistance is determined from soil water content and meteorological conditions. Third, an excess resistance controls sensible heat fluxes from dry bare-soil or sparsely vegetated surfaces, and all LSMs sig-nificantly under-predict the ground-air temperature gradient, which would result in higher net radiation, lower soil heat fluxes and thus higher sensible heat fluxes in the models. A parameterization scheme for this resistance has been shown to be effective to remove these biases.
Correspondence to: K. Yang ([email protected])
1 Introduction
The Tibetan Plateau (TP) is one of regions with strong land-atmosphere interactions, due to strong solar heating over the Plateau. TP land processes are generally characterized by three features. The first is apparent diurnal variations due to strong solar radiation and low air density. The so-lar irradiance over the Plateau is often observed to exceed 1200 W m−2 near noon (Ma et al., 2005), which results in
very strong diurnal change of the surface energy budget and near-surface meteorological variables. For instance, the di-urnal range of the surface skin temperature can exceed 60 K. The second is the distinct seasonal march of the surface wa-ter and energy budget in the central and easwa-tern TP. Before the onset of the monsoon (about the end of May to the mid-dle of June), the surface is relatively dry and the sensible heat flux dominates the surface energy budget; after the onset, the land surface becomes wet due to frequent rainfall events and it is the latent heat flux that dominates the energy budget un-til the withdraw of the monsoon in September. The third is the contrast between the dry western region and the wet east-ern region. Annual precipitation amount is about 400 mm or more in most of central and eastern TP (CE-TP), while it is around 100 mm or less in the western TP (W-TP). Under the unique Plateau climate, the land surfaces are typically char-acterized by alpine meadows and grasslands in CE-TP while by alpine deserts in W-TP.
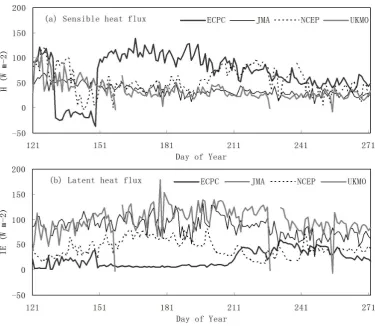
Fig. 1. The seasonal march of daily surface energy budget in four numerical weather prediction models for the CEOP eastern Tibet site (31.379◦N, 91.9◦E, 4580 m a.s.l.), 2003.
Meteorological Agency), NCEP (National Centers for Envi-ronmental Prediction, USA), and UKMO (Met Office, UK). The data are provided by the CEOP (Coordinated Enhanced Observing Period) centralized data archive system (Nemoto et al., 2007). See Yang et al. (2007) for a brief description of the models. Figure 1 shows that the surface energy bud-gets are quite discrepant among the four models from the pre-monsoon period (before DOY 151) to the monsoon pe-riod (after DOY 151), 2003. ECPC and NCEP yield an un-expected seasonal march of the energy budget, while JMA and UKMO shows a too weak seasonal march of the latent heat flux, compared to observations in 1998 (not shown). Large uncertainties in the Bowen Ratio were also found in an inter-comparison of offline land surface models (LSMs) by Takayabu et al. (2001). One of possible reasons is that the land processes in this region have not been well represented in the models.
Since 1998, several field experiments have been or are being implemented in this region, including the GEWEX (Global Energy and Water cycle Experiment) Asian Mon-soon Experiment – Tibet (GAME-Tibet; Koike et al., 1999), the Tibetan Plateau Experiment of Atmospheric Sciences
(TIPEX; Xu et al., 2002), the CEOP Asia–Australia Mon-soon Project in Tibet (CAMP-Tibet; Koike, 2004), the China and Japan intergovernmental weather disaster program (JICA) (Xu et al., 2008), and the Tibetan Observation and Research Platform (TORP; Ma et al., 2008). Their overall goal is to understand the Plateau energy and water cycle and clarifies its role in the Asian monsoon system. Undoubtedly, these experiments have advanced our understanding to land processes in this region (Ma et al., 2002; Tanaka et al., 2003; Yang et al., 2005; Hu et al., 2006; Li and Sun, 2008). How-ever, these achievements have not been integrated into state-of-the-art LSMs and there is a big gap between these experi-mental studies and the LSM development.
surface temperature, and turbulent fluxes simulated by these offline LSMs at two types of sites (alpine meadow and alpine desert), each of which includes two sites in this study. In Sect. 4, three common deficiencies in the models are iden-tified to be related to some typical processes in TP. Some improvements have been implemented into SiB2 and the im-proved SiB2 is evaluated again based on the experimental data. Concluding remarks are presented in Sect. 5.
2 Observations and models 2.1 Sites and data
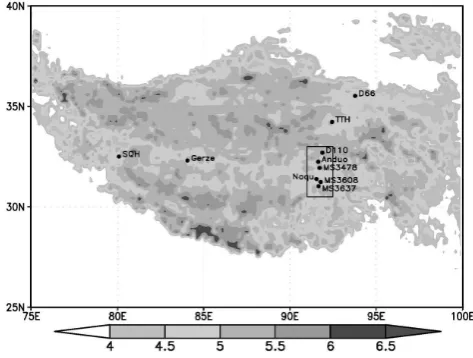
[image:3.595.308.545.65.244.2]In situ data were collected through the GAME-Tibet during an intensive observing period (IOP, May∼September, 1998). Figure 2 shows the observing network. To achieve a bet-ter representativeness of the entire Plateau, the observational sites were deployed along a north-south transect and a west-east transect; more than half of them were placed within a meso-scale area (30.5–33◦N, 91–92.5◦E). All sites were above 4000 m a.s.l.
The simulations were conducted at two alpine meadow sites (Anduo or Amdo, MS3478 or NPAM) in CE-TP and at two alpine desert sites (Shiquanhe or SQH, Gerze or Gaize) in W-TP. CE-TP sites are typically affected by the monsoon while W-TP sites by the westerly, and therefore, their clima-tology and land cover conditions are different.
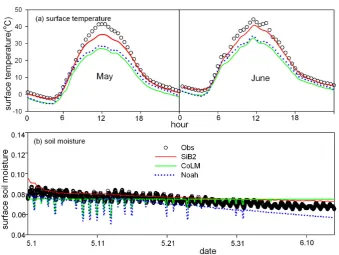
At the alpine meadow sites (Anduo and MS3478), the sur-faces are almost bare-soil in the pre-monsoon season but turn to grassland afterwards. The onset of the Plateau monsoon in 1998 was 15 June, which was later than dates in normal years. At Anduo site, the simulated period is from 11 May to 31 August. The amount of precipitation is only 7 mm dur-ing the dry season (or the pre-monsoon season) but reaches 278 mm during the wet season (or the monsoon season). At MS3478 site, two simulations were conducted, respectively, for the dry period from 8 May to 17 June and for the wet period from 1 July to 16 September, due to data missing between these two periods. The amount of precipitation is 3 mm in the dry period and 318 mm in the wet period. At the two sites, measurements included surface temperature, soil moisture, and turbulent fluxes. The surface temperature was converted from downward and upward longwave radiation with the surface emissivity derived from observations (see Yang et al., 2008), soil moisture was measured by TDR, and turbulence fluxes by eddy-covariance system. Data averaged over each interval of 30 or 60 min was recorded.
At the alpine desert sites (SQH and Gerze), the surface was nearly bare soil and very dry. At SQH site, the simulated pe-riod is from 1 May to 14 September 1998, and the amount of precipitation is only 25 mm. At Gerze, the data record is much shorter (from 1 May to 15 June 1998) due to data miss-ing afterwards; there was not any precipitation event durmiss-ing this period. At the two sites, measurements included surface
Fig. 2. Map of GAME-Tibet Experiment, IOP 1998. Grey bar rep-resents elevation in km. The small rectangle is the mesoscale ex-perimental area (91–92.5◦E, 30.5–33◦N). SQH and TTH are the abbreviation of Shiquanhe and Tuotuohe sites of GAME-Tibet ex-periments, respectively.
skin temperature, surface radiation budget, and soil mois-ture at 0–15 cm, while turbulent fluxes were not available. The surface temperature was directly measured using a ther-mometer, with half of the sensor buried in the soil and half exposed to the air; the soil moisture was measured by TDR. The measured surface temperature agrees with that derived from measured longwave radiation (Given surface emissiv-ity of 0.9, which is derived by assuming the thermometer measurements near sunset is reliable), with an uncertainty of 2–3 K. Data averaged over each 30 or 60 min period was recorded.
2.2 Land surface models and modeling configuration
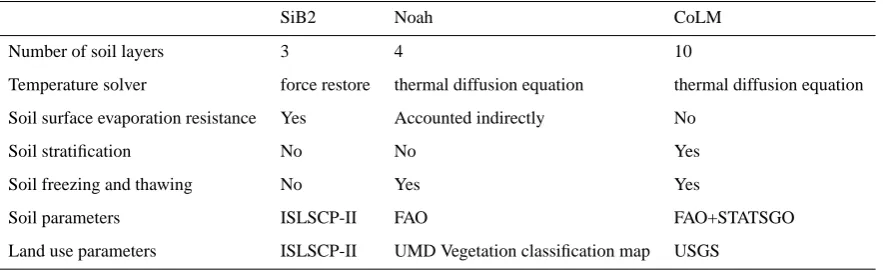
Table 1. The model structure of SiB2, Noah, and CoLM.
SiB2 Noah CoLM
Number of soil layers 3 4 10
Temperature solver force restore thermal diffusion equation thermal diffusion equation
Soil surface evaporation resistance Yes Accounted indirectly No
Soil stratification No No Yes
Soil freezing and thawing No Yes Yes
Soil parameters ISLSCP-II FAO FAO+STATSGO
Land use parameters ISLSCP-II UMD Vegetation classification map USGS
heat/vapor transfer resistances within a canopy, while CoLM assumes wind speed within a canopy to be equal to the frictional velocity above the canopy. Noah does not have such a canopy aerodynamic model. SiB2 updates canopy temperature by taking the heat storage of a canopy into account, while the canopy temperature in CoLM is deter-mined by the canopy radiation budget without considering the canopy heat storage.
In addition, the parameterization for the transfer resis-tances in SiB2 canopy needs a set of aerodynamic parame-ters, which are calculated by a K-theory based model. For nearly bare-soil surfaces, LAI (Leaf Area Index) is very small, and the aerodynamic roughness length (z0m) should
approach the value for bare-soil surfaces. However, the K-theory in SiB2 produces a lower value, because this K-theory is not consistent with the classic mixing-length theory. On the other hand, Watanabe and Kondo (1990) developed a canopy model based on the mixing-length theory; it producesz0m
spontaneously being equal to the value for the bare-soil sur-face when LAI approaches zero. Considering small LAI val-ues on the Plateau, we adopted their canopy model to pro-duce the aerodynamic parameters required in SiB2.
As soil and vegetation parameters are not available from observations, these models are run with individually spec-ified default values of these parameters. In SiB2, soil pa-rameters and vegetation papa-rameters (classification and cover-age) are derived from 1◦×1◦ISLSCP II (International Satel-lite Land Surface Climatology Project Initiative II) soil data (Global Soil Data Task, 2000) and vegetation data (Loveland et al., 2001). In Noah, the soil type is obtained from the FAO (Food and Agriculture Organization) data. The veg-etation type is derived from UMD vegveg-etation classification map (Hansen et al., 2000). In CoLM, land-water mask and land cover are derived from USGS vegetation data files. Soil types and parameters are merged from FAO and US general soil map (STATSGO) data. Both top soil layer (0–30 cm) and bottom soil layer (30–100 cm) data are provided. All soil and vegetation data are available at 30 arc second resolution.
However, some key parameters for the surface radiation
and energy budgets can be derived from observations. Their mean values are shown in Table 2, including albedo and sur-face emissivity at all sites and soil thermal diffusivity at the alpine desert sites. The albedo was directly derived from observed downward and upward shortwave radiations. At MS3478, there are two albedo values, respectively, for the dry-period and wet-period simulations. The emissivity at the meadow sits was optimized from sensible heat flux and me-teorological data for near-neutral conditions (see Yang et al., 2008) and that at the desert sits was derived from radiation data by assuming thermometer measured surface tempera-ture is reliable near sunset. The soil thermal diffusivity at the desert sites was derived from soil temperature data; however, the diffusivity at alpine meadow sites changes considerably with respect to soil moisture and thus its parameterization in the individual models are used in the simulations. These parameter values in Table 2 were used in all simulations to enhance the robustness of the simulated results. In particu-lar, this setting is important for the simulations at the alpine desert sites where energy budget is the major land surface process.
In all simulations, soil moisture and temperatures are ini-tialized with observed data.
3 Errors in land surface modeling 3.1 At alpine meadows
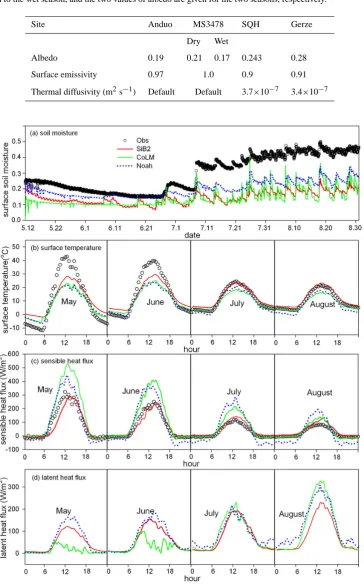
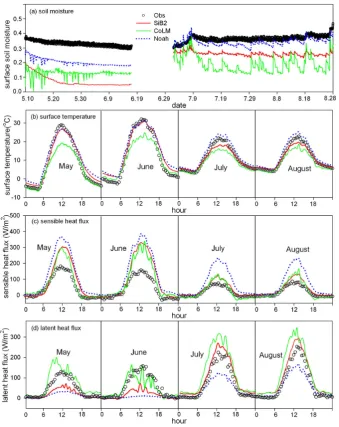
The simulated results at the two alpine meadow sites are shown in Figs. 3–4 for Anduo site and MS3478 site, respec-tively.
Figures 3a–4a show that hourly near-surface soil moisture (4 cm depth) is much under-estimated by all models for al-most all months. This is related to a typical soil stratifica-tion under the Plateau meadows, which will be discussed in Sect. 4.1.
Table 2. Model parameters derived from observations at four sites. At MS3478 site, forcing data were missing during the transitional period from the dry season to the wet season, and the two values of albedo are given for the two seasons, respectively.
Site Anduo MS3478 SQH Gerze
Dry Wet
Albedo 0.19 0.21 0.17 0.243 0.28
Surface emissivity 0.97 1.0 0.9 0.91
Thermal diffusivity (m2s−1) Default Default 3.7×10⁻⁷ 3.4×10⁻⁷
under-estimated soil moisture in Figs. 3a and 4a would lead to overestimation of the diurnal range of surface temperature. However, Figs. 3b and 4b show that the simulated diurnal range of surface temperature is actually not larger than the observed one. In the typical dry month (May), the simulated daytime surface temperature at Anduo site is lower than the observed one by more than 10 K. Theoretically, this under-estimation of surface temperature would result in negative biases in the simulated sensible heat fluxes, but Figs. 3c and 4c show positive biases in most cases. At Anduo site, Noah and CoLM produced lower surface temperature in the day-time than SiB2 did, but their sensible heat fluxes are much higher than the latter one. At MS3478 sites, Noah and SiB2 produced surface temperature fairly well, but they did yield much higher sensible heat fluxes than the observed one. This implies that the relationship between ground-air temperature gradient and sensible heat flux is not represented well in the models, which will be addressed in Sect. 4.3.
Figures 3d and 4d show that there are large discrepancies in the latent heat fluxes simulated by the three models, which is not surprising as the simulated soil moisture amounts are quite different. In Fig. 3d, observed flux at Anduo is not shown, because three independent studies that used different analysis methods (Tanaka et al., 2003; Yang et al., 2004; Su et al., 2006) have demonstrated that the observation is prone to severe errors. Nevertheless, we can figure out the impor-tance of a soil surface resisimpor-tance for evaporation (Sun et al., 1982). For a wet surface, this resistance is negligible and the evaporation is mainly controlled by net radiation rather than by soil moisture. Accordingly, the simulated phase of the di-urnal latent heat flux for July–August is similar to each other among the three models, as shown in the figures. However, for a dry season, this resistance plays a major role in control-ling the evaporation and near-surface soil moisture. If this resistance was not taken into accounted in a model, the sur-face would dry up rapidly after sunrise or sursur-face evaporation varies frequently. This is the case in CoLM in which does not include this resistance. As shown in Figs. 3d and 4d, latent heat flux in CoLM reaches the peak relative early (09:00– 10:00 a.m.) and relatively variable in the daytime, while this phenomenon was not observed in either the observed one or the Noah and SiB2 simulations. The parameterization for this resistance will be discussed in Sect. 4.2.
3.2 At alpine deserts
The simulated results at the two alpine desert sites are shown in Figs. 5–6, respectively, for SQH and Gerze. Turbulent fluxes are not shown as they were not measured at the two sites.
Figures 5a and 6a show all models simulated nighttime surface temperature fairly well, but daytime surface temper-ature was much under-predicted by all models for all months. This performance is similar to that for the dry season at An-duo site (Fig. 3b). The modeling bias is not due to specifying
an erroneous soil thermal inertial, as it was derived from ob-served temperature profiles. This bias for dry surfaces will be investigated in Sect. 4.3.
Figures 5b and 6b show the comparison of the liquid soil water in the top 15 cm between the observation (not available after DOY 211) and the simulations. CoLM and Noah sim-ulated soil freezing and thawing processes and the figures only show the liquid water content to compare with TDR-measured values. In general, all LSMs performed better for the desert sites than for the meadows sites. Nevertheless, the soil moisture in SiB2 rapidly decreases from the beginning and then becomes stable until rainfall occurred, the soil drys up slightly faster in Noah than the observed, and the liquid water content in CoLM looks too variable when soil freezing and thawing occurred. Though partial errors in the simulated soil moisture can be attributed to specifying soil hydraulic parameters, we cannot exclude errors due to improper pa-rameterizations for calculating soil water flow and the soil surface resistance within the dry soils, as will be discussed in Sect. 4.2.
In summary, three major modeling deficiencies are found: (1) at the alpine meadows, soil moisture in the topsoil is much under-predicted; (2) at the alpine deserts, soil moisture within dry soils is not well simulated; (3) at all sites, surface skin temperature for dry conditions is much under-predicted in the daytime.
4 Process parameterizations
Specification of default parameters and model initialization may cause significant errors in soil moisture, surface temper-ature, and surface energy budget. This is fairly common and often documented knowledge (Liang and Guo, 2003; Rodell et al., 2005) and is not the scope of this study. In this sec-tion, we present the model deficiencies that are associated with the aforementioned modeling errors, and then suggest or implement new schemes to improve the modeling. 4.1 Soil stratification beneath alpine meadows
Fig. 4. Similar to Fig. 3, but for MS3478, another alpine meadow site.
Table 3. Soil composition and parameters analyzed by laboratory experiments for Anduo site for five field samples (two at 5 cm, two at 20 cm, and one at 60 cm) (courtesy of N. Hirose).
Sample No. Depth (cm) Sample features Composition (%) ρd θs Gravel Sand silt clay (kg m−3) (m3m−3)
5A 5 dense root N/A 0.667 0.633
5B 5 dense root 0.00 30.64 59.88 9.48 0.817 0.593
20A 20 little root, gravel 3.69 69.02 19.83 7.46 1.378 0.440
20B 20 little root, gravel 4.24 67.08 19.53 9.15 1.694 0.318
[image:7.595.96.499.575.694.2]Fig. 5. Simulated monthly-mean diurnal variations of surface skin temperature and hourly near-surface soil moisture at an alpine desert site (SQH), 1998. Observation-derived albedo, surface emissivity, and soil thermal diffusivity are used in the simulations. Soil moisture data are not available after 30 July DOY 211.
Fig. 6. Similar to Fig. 5, but for another alpine desert site (Gerze).
in the deep soil. Second, the topsoil is of significant impor-tance for the land-surface interactions, because high-level ra-diation over TP is not damped by vegetation and thus the topsoil directly and strongly interacts with the atmosphere. Though SOMs also occur in forest and heavily vegetated
ar-eas, heat exchange and evapo-transpiration mainly occur in the canopy, whereas the exchange with the topsoil and the air is rather weak.
[image:8.595.128.468.345.600.2]Fig. 7. Observed soil water content in the near-surface soil and the deeper soil at GAME-Tibet sites, 1998 (Soil moisture at Naqu was not measured in 1998; plotted is the data for 2001). Panels (a–d) for CE-TP alpine meadow sites and panels (e–f) for W-TP sites.
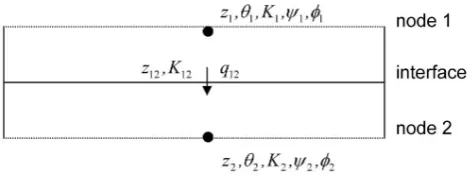
[image:9.595.111.487.420.649.2]Fig. 9. Schematic of computational nodes for the calculation of soil water flow.
water content is high in the topsoil and low in the deep soil, as shown in Fig. 7a–d for CE-TP sites. Such a phenomenon is not found in the western Plateau, as shown in Fig. 7e–f. Ac-cording to an inverse analysis (Yang et al., 2005), the topsoil has high porosity and thus high water-holding capacity; this may enhance the evaporation in the wet season. On the other hand, this layer shows low heat capacity and low thermal conductivity in the dry season; this may lead to high surface temperature and high sensible heat flux. With the consider-ation of stratified soil parameters, the soil moisture profile can be simulated well. Figure 8 shows examples at Anduo and Naqu sites, where near-surface soil moistures were sim-ulated well by a LSM developed in Yang et al. (2005) with a sandwich structure to delineate the soil stratification.
In some models (e.g. CoLM), it is possible to specify soil parameters for each computational layer. Also, there have al-ready been some studies to formulate the effect of SOM on soil parameters (Beringer et al., 2001; Lawrence and Slater, 2008). However, our knowledge on the Plateau soils is still very limited. In order to develop the parameterization for soil properties in this region, laboratory soil experiments are re-quired to measure their basic parameters such as the content of grassroots and SOMs.
4.2 Soil water flow and soil surface resistance for evap-oration
In this section, at first we implement an advanced scheme for soil water flow simulations in SiB2, then a new parameteri-zation is proposed to estimate the soil surface resistance for evaporation.
4.2.1 Implementation of an advance scheme for soil wa-ter flow
Ross (2003) developed a sophisticated scheme to calculate soil water content by Richards Equation, and the following introduces its major merits.
Soil water flow in unsaturated zones is governed by Darcy’s law, which calculates soil water flux by:
q=K−K∂ψ
∂z, (1)
whereK(m s−1)is the soil hydraulic conductivity, andψ(m)
is the soil water potential. q(m s−1)is the soil water flux
(positive if downward) andz(m) is the depth from the soil surface.
In general, Eq. (1) is approximated by
q12 =K12−K12
ψ2−ψ1
(z2−z1)
(2) where subscripts 1 and 2 denotes two adjacent nodes, and
K12is the soil hydraulic conductivity at the interface, as
in-dicated in Fig. 9.
Asψ1andψ2 can be directly calculated from soil water
content θ1 andθ2 at the nodes, the accuracy of Eq. (2) is
then determined by the accuracy ofK12. Because soil
hy-draulic conductivity (K) drastically changes with respect to soil moisture, the calculation ofK12 becomes very sensitive
to the way of how to estimate the soil water contentθ12at the
interface of the adjacent nodes. It becomes particularly diffi-cult to determineK12 if the soil is dry orθ1andθ2are very
different (for example,θ1θ2after a heavy rainfall event).
CoLM assumesθ12=(θ1+θ2)/2, but there is no theory to
jus-tify this average.
To avoid this difficulty, Ross (2003) adopts the following Kirchhorff transform to calculate soil water flux:
φ (θ )= ψ (θ )
Z
−∞
K(ψ )dψ , (3)
whereφ (θ )is the so-called soil flux potential.
Given hydraulic functions by Clapp and Hornberger (1978),φ (θ )has a following simple form
φ= − Kψ
1+3/b, (4)
wherebis the pore size distribution parameter. Then, the soil water flow is calculated by:
q =K(θ )−∂φ (θ )
∂z , (5)
which can be approximated by the following discrete form:
q12 =K12+
φ2−φ1
(z2−z1)
, (6)
The RHS (right hand side) second term of Eq. (6) can be calculated directly from θ1 andθ2 and thus it is no longer
involved in the average of soil water content at the interface. The RHS first term is estimated by the following equation.
K12=wK1+(1−w)K2, (7)
wherewis a weight number.
Ross (2003) proposed a dynamic estimation to the weight number:
w=
φ (ψ2−1z)−φ (ψ2)
1z +K2
(K2−K(ψ2−1z)) (8) where1z=z2−z1.
4.2.2 Soil surface resistance for evaporation
Soil surface resistance (rsoil) is a key parameter to calculate
the surface evaporation and the soil moisture within the top-soil. Without this resistance, simulated latent heat flux would change drastically, as is the case of CoLM shown in Figs. 3d and 4d.
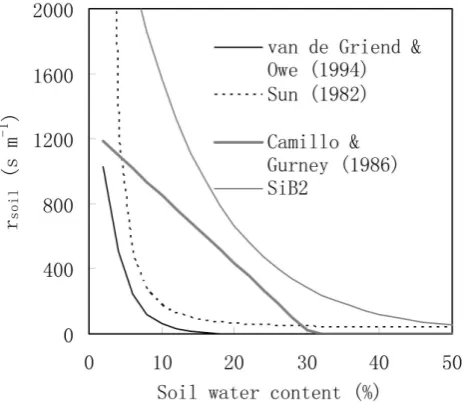
There are quite a few parameterizations for this resistance, as summarized in Schelde (1996), e.g.,
rsoil=10 exp[35.63(0.15 − θ )] in van de Griend and
Owe (1994), rsoil=3.5(θsat/θ )2.3 + 33.5 in Sun (1982),
rsoil=4140(θsat−θ )−805 in Camillo and Gurney (1986), and
[image:11.595.312.545.63.264.2]rsoil=exp [8.206−4.225(θ/θsat)] in Sellers et al. (1996).
Figure 10 shows the variations of rsoil with respect to soil
water content in these parameterizations. The big differences among these parameterizations indicate that it is extremely difficult to estimate this resistance. A new parameterization is developed below.
According to the condition of mass continuity, the water supply from the soil and water demand by the air must be satisfied. Therefore, actual evaporation must be the mini-mum of the two fluxes, which may be expressed as:
E=min(ρwqsupply, Edemand), (9)
qsupply= −(K−
∂φ
∂z), (10)
Edemand=ρ
rheqqsat(Tg)−qa
(rah+rsoil)
, (11)
rheq =exp ψ (θ
sfc)
RvTg
g
, (12)
whereE(mm s−1)is the actual evaporative flux,qsupply (m
s−1; positive if upward) is the maximum soil water flux from the first node to a very dry surface, Edemand (mm s−1)is
the demand water flux by the air. rheq is the equilibrium
relative humidity in the air space of the soil, calculated by Philip (1957). θsfc is the near-surface soil water content,
qsat(Tg) is the saturated specific humidity,Tg(K) is the soil
skin temperature, qa is the air specific humidity at a
refer-ence level, andrahis the heat transfer resistance.ρ(kg m−3)
is the density of air, ρw (kg m−3)is the density of water,
Rv=461.5JK−1kg−1,g=9.81ms−1.
Equation (10) is identical to Eq. (5) but their calculated fluxes have opposite direction.qsupplyis positive if soil water
flow is from the soil to the surface. This flux can be cal-culated by Eqs. (6–8), given node 1 in Fig. 9 at the surface where a very low soil moisture (defined by soil water poten-tialψ=−104m)is assumed and node 2 being the first node where soil water content is computed from Richards equa-tion.
After arrangement of Eqs. (9–11), one gets
rsoil=max
0, ρrheqqsat(Tg)−qa ρwqsupply
−rah
[image:11.595.46.286.328.433.2]. (13)
Fig. 10. Comparisons of formulas of soil surface resistance for evaporation (see the formulas in the text).
This parameterization for the resistance is implemented in SIB2 and the revised SiB2 is then applied to the desert sites with default soil hydraulic parameters. As indicated in Fig. 11, after introducing Ross scheme and the new parame-terization for soil surface resistance into SiB2, the simulated soil moisture in the top 15 cm at the alpine desert sites is closer to the observed one. Though it is still difficult to in-terpret the result due to the uncertainties of specifying model parameters in the simulations, the differences in the simu-lated soil moisture suggest that implementing physically or mathematically advanced schemes in a LSM is an important aspect to be pursued for improving soil moisture simulations. 4.3 Heat flux parameterization
As shown in Sect. 3, the peak of the daytime surface tem-perature for dry surfaces is significantly under-predicted by all models. In fact, this is a common issue for land surface modeling in arid and semiarid regions, as shown in Yang et al. (2007).
Many studies (e.g. Verhoef et al., 1997) have shown that an excess resistance must be introduced to estimate sensi-ble heat flux from ground and air temperature difference. This resistance is due to the difference between the aero-dynamic roughness length (z0m)and the thermal roughness
length (z0h). Their relationship is expressed by:
rhex=P r
ln(z0m/z0h)
ku∗
, (14)
whererhexis the excess resistance,k(=0.4)is the von
Kar-man constant, Pr is the Prandtl number,u∗ is the frictional
velocity (m s−1).
Fig. 11. Comparison of soil water content in the top 15 cm between observation and simulation at an alpine desert site (SQH). The simulation is conducted using SiB2 with or without Eqs. (4–8) for calculating soil water flow and evaporation.
[image:12.595.124.470.344.647.2]the latest progress in this topic. Their study indicates that
z0h depends on flow state and exhibits diurnal variations.
Similar findings are also found in other studies (e.g., Sun, 1999). In particular, ground-air temperature differences in the Plateau region can exceed 30 K, and the diurnal varia-tions of the thermal roughness length are more evident than in other regions. However, many models neglect the differ-ence between the two roughness lengths or specify a con-stant value of their ratio (typically 7.3 or 10). Noah model uses Zilitinkevich (1995) scheme to calculate the roughness length, and Yang et al. (2008) pointed out that this scheme over-estimates the roughness length and thus underestimates peak values of the surface temperature.
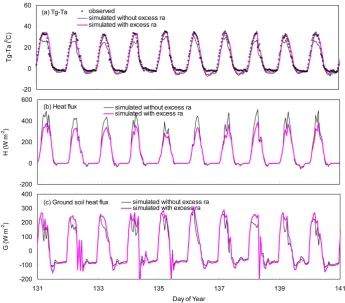
Figure 12 shows the results of SiB2 with and without ac-counting for the excess resistance. The resistance is param-eterized according to a scheme that considers diurnal varia-tions ofz0h(Yang et al., 2008). It is shown that the
ground-air temperature difference is well simulated by SiB2 when the excess resistance is included in the modeling, whereas the simulation without it yields higher sensible heat fluxes though the surface temperature is under-estimated. The higher sensible heat fluxes are consistent with reduced up-ward longwave cooling and higher net radiation amounts dur-ing the daytime. Meanwhile, the lower surface temperature would directly result in lower ground soil heat fluxes, which are also consistent with the higher sensible heat fluxes. The results in Fig. 12 exactly verify this reasoning. Undoubtedly, the parameterization for the excess resistance or the thermal roughness length is very crucial for reproducing the surface temperature and the surface energy budget simultaneously.
5 Conclusions and recommendations
The Tibetan Plateau is a key region of land-atmosphere inter-actions. This study evaluated the performance of three LSMs in the Plateau region. Major finding are as follows.
First, water content within the topsoil of CE-TP alpine meadows is commonly under-predicted by all models, due to the soil stratification. The soil stratification in the Plateau was also investigated by van der Velde et al. (2009). The topsoil contains dense grassroots and soil organic matters. Limited experiments have shown this layer exhibits proper-ties significantly different from the deep soil, and in general, high soil water content is observed in the topsoil. Though the topsoil interacts with atmosphere directly (due to short vege-tation) and strongly (due to high radiation), we have limited knowledge on its hydraulic and thermal properties. Future studies should address this issue so as to develop a proper parameterization for the topsoil parameters.
Second, to improve soil water simulations, we implement Ross (2003) scheme for soil water flow into a LSM and a new parameterization for soil surface resistance for evaporation. Ross scheme can handle the high nonlinearity of soil water flow equation. It is shown that the modeling of soil water
content can be improved through implementing physically or mathematically advanced schemes.
Third, daytime ground-air temperature gradient for the western alpine deserts is under-predicted considerably by all models. This under-estimation actually corresponds to the overestimate of sensible heat flux and the underestimate of soil heat flux. These biases result from the under-estimation or neglect of an excess resistance for heat transfer. After im-plementing into SiB2 an excess-resistance scheme recom-mended in Yang et al. (2008), the ground-air temperature gradient over very dry surfaces can be simulated well. This scheme can also be extended to other arid and semi-arid re-gions.
In summary, in addition to the well-known snow melting and soil freezing/thawing processes, there are some special while dominant processes in the Plateau. In order to well simulate the Plateau surface water and energy budget, fu-ture activities should pursue both field and laboratory exper-iments for appropriately representing these processes in land surface models. Process studies on the dissimilarity between the Plateau and lowland areas and the similarity between the Plateau and the Polar regions may also provide new clues for improving our understanding and modeling of the Plateau land processes.
Acknowledgements. This work was supported by NSFC grant (Number 40875009), CAS key project (KZCX2-YW-Q10-2), and CAS “Hundred Talent” program. The in situ data used in this paper were obtained under the GAME/Tibet project, which was supported by the MEXT, FRSGC, NASDA of Japan, Chinese Academy of Science, and Asian Pacific Network. The NWP MOLTS data were provided by the CEOP Centralized Data Archive System.
Edited by: Z. Su
References
Beringer, J., Lynch, A. H., Chapin III, F. S., Mack, M., and Bo-nan, G. B.: The representation of Arctic soils in the land surface model: The importance of mosses, J. Climate, 14, 3321–3335, 2001.
Camillo, P. J. and Gurney, R. J.: A resistance parameter for bare soil evaporation models, Soil Sci., 141, 95–105, 1986.
Chen, F., Mitchell, K., Schaake, J., Xue, Y., Pan, H.-L., Koren V., Duan, Q.-Y., Ek, M., and Betts, A.: Modeling of land-surface evaporation by four schemes and comparison with FIFE obser-vations, J. Geophys. Res., 101(D3), 7251–7268, 1996.
Clapp, R. B. and Hornberger, G. M.: Empirical Equations for Some Soil Hydraulic Properties, Water Resour. Res., 14(4), 601–604, 1978.
Dai, Y.-J., Zeng, X.-B., Dickinson, R. E., Baker, I., Bonan, G. B., Bosilovich, M. G., Denning A. S., Dirmeyer, P. A., Houser, P. R., Niu, G.-Y., Oleson, K. W., Schlosser, C. A., and Yang, Z.-L.: The Common Land Model (CLM), B. Am. Meteor. Soc., 84, 1013– 1023, 2003.
Programme – Data and Information Services, Oak Ridge Na-tional Laboratory, Oak Ridge, Tennessee, USA, available online at: http://www.daac.ornl.gov/ (last access: February 2003) from the ORNL Distributed Active Archive Center, 2000.
Hansen, M. C., DeFries, R. S., Townshend, J. R. G., and Sholberg, R.: Global land cover classification at 1 km spatial resolution us-ing a classification tree approach, Int. J. Remote Sens., 21, 1331– 1364, 2000.
Hu, H.-P., Ye, B.-S., Zhou, Y.-H., and Tian, F.-Q.: A land surface model incorporated with soil freeze/thaw and its application in GAME/Tibet, Sci. China Ser. D, 49(12), 1311–1322, 2006. Koike, T.: The Coordinated Enhanced Observing Period – an initial
step for integrated global water cycle observation, WMO Bul-letin, 53(2), 1–8, 2004.
Koike, T., Yasunari, T., Wang, J., and Yao, T.: GAME-Tibet IOP summary report, in: Proceeding of the 1st International Work-shop on GAME-Tibet, Xi’an, China, 11–13 January 1999, 1–2, 1999.
Koren, V., Schaake, J., Mitchell, K., Duan, Q.-Y., Chen, F., and Baker, J. M.: A parameterization of snowpack and frozen ground intended for NCEP weather and climate models, J. Geophys. Res., 104, 19569–19585, 1999.
Lawrence, D. M. and Slater, A. G.: Incorporating organic soil into a global climate model, Clim. Dynam., 30, 145–160, doi:10.1007/s00382-007-0278-1, 2008.
Li, Q. and Sun, S.-F.: Development of the universal and simplified soil model coupling heat and water transport, Sci. China Ser. D, 51, 88–102, 2008.
Liang, X. and Guo, J. Z.: Intercomparison of land-surface parame-terization schemes: sensitivity of surface energy and water fluxes to model parameters, J. Hydrol., 279, 182–209, 2003.
Loveland, T. R., Reed, B. C., Brown, J. F., Ohlen, D. O., Zhu, Z., Yang, L., and Merchant, J. W.: Development of a global land cover characteristics database and IGBP DISCover from 1-km AVHRR data, Int. J. Remote Sens., 21, 1303–1330, 2001. Ma, Y.-M., Tsukamoto, O., Wang, J., Ishikawa, H., and Tamagawa,
I.: Analysis of aerodynamic and thermodynamic parameters over the grassy marshland surface of Tibetan Plateau, Prog. Nat. Sci., 12, 36–40, 2002.
Ma, Y.-M., Fan, S.-L., Ishikawa, H., Tsukamoto, O., Yao, T.-D., Koike, T., Zuo, H., Hu, Z.-Y., and Su, Z.: Diurnal and inter-monthly variation of land surface heat fluxes over the central Ti-betan Plateau area, Theor. Appl. Climatol., 80, 259–273, 2005. Ma, Y.-M., Kang, S.-C., Zhu, L.-P., Xu, B.-Q., Tian, L.-D.,
and Yao, T.-D.: Tibetan Observation And Research Platform (Torp): Atmosphere-Land Interaction Over A Heterogeneous Landscape, B. Am. Meteor. Soc., 89, 1487–1492, 2008. Nemoto, T., Koike, T., and Kitsuregawa, M.: Data Analysis
Sys-tem Attached to the CEOP Centralized Data Archive SysSys-tem, J. Meteorol. Soc. Jpn., 85A, 529–543, 2007.
Philip, J. R.: Evaporation, and moisture and heat fields in the soil, J. Meteorol., 14, 354–366, 1957.
Rodell, M., Houser, P. R., Berg, A. A., and Famiglietti, J. S.: Eval-uation of ten methods for initializing a land surface model, J. Hydrometeorol., 6, 146–155, 2005.
Ross, P. J.: Modeling soil water and solute transport – Fast, simpli-fied numerical solutions, Agron. J., 95, 1352–1361, 2003. Schelde, K.: Modelling the Forest Energy and Water Balance,
Se-ries Paper No. 62, Department of Hydrodynamics and Water
Re-sources Technical University of Denmark, 2800 Lyngby, 263 pp., 1996.
Sellers, P. J., Randall, D. A., Collatz, G. J., Berry, J. A., Field, C. B., Dazlich, D. A., Zhang, C., Collelo, G. D., and Bounoua, L.: A revised land surface parameterization (SiB2) for atmospheric GCMs, Part I: Model formulation, J. Climate, 9, 676–705, 1996. Su, Z., Zhang, T., Ma, Y., Jia, L., and Wen, J.: Energy and wa-ter cycle over the Tibetan Plateau: surface energy balance and turbulent heat fluxes, Adv. Earth Sci., 21, 1224–1236, 2006. Sun, J.: Diurnal variations of thermal roughness height over a
grass-land, Bound-Lay. Meteorol., 92, 404–427, 1999.
Sun, S.-F.: Moisture and heat transport in a soil layer forced by atmospheric conditions, M.S. thesis, Dept. of Civil Engineering, University of Connecticut, 72 pp., 1982.
Takayabu, I., Takata, K., Yamazaki, T., Ueno, K., Yabuki, H., and Haginoya, S.: Comparison of the Four Land Surface Models Driven by a Common Forcing Data Prepared from GAME/Tibet POP’97 Products—Snow Accumulation and Soil Freezing Pro-cesses, J. Meteorol. Soc. Jpn., 79(1B), 535–554, 2001.
Tanaka, K., Tamagawa, I., Ishikawa, H., Ma, Y.-M., and Hu, Z.: Surface energy and closure of the eastern Tibetan Plateau during the GAME-Tibet IOP 1998, J. Hydrol., 283, 169–183, 2003. van de Griend, A. A. and Owe, M.: Bare soil surface resistance
to evaporation by vapor diffusion under semiarid, Water Resour. Res., 30, 181–188, 1994.
van der Velde, R., Su, Z., Ek, M., Rodell, M., and Ma, Y.: Influence of thermodynamic soil and vegetation parameterizations on the simulation of soil temperature states and surface fluxes by the Noah LSm over a Tibetan plateau site, Hydrol. Earth Syst. Sci. Discuss., 6, 455–499, 2009,
http://www.hydrol-earth-syst-sci-discuss.net/6/455/2009/. Verhoef, A., de Bruin, H. A. R., and van den Hurk, B. J. J. M.: Some
practical notes on the parameter kB−1for sparse vegetation, J. Appl. Meteorol., 36, 560–572, 1997.
Watanabe, T. and Kondo, J.: The influence of canopy structure and density upon the mixing length within and above vegetation, J. Meteorol. Soc. Jpn., 68, 227–235, 1990.
Xu, X.-D., Zhou, M.-Y., Chen, J.-Y., Bian, L.-G., Zhang, G.-Z., Liu, H.-Z., Li, S.-M., Zhang, H.-S., Zhao, Y.-J., Suolongduoji, and Wang J.-Z.: A comprehensive physical pattern of land-air dynamic and thermal structure on the Qinghai-Xizang Plateau, Sci. China Ser. D, 45, 577–595, 2002.
Xu, X.-D., Zhang, R.-H., Koike, T., Lu, C.-G., Shi, X.-H., Zhang, S.-J., Bian, L.-G., Cheng, X.-H., Li, P.-Y., and Ding, G.-A.: A New Integrated Observational System over the Tibetan Plateau (NIOST), B. Am. Meteor. Soc., 89(10), 1492–1496, 2008. Yanai, M., Li, C., and Song, Z.: Seasonal heating of the Tibetan
Plateau and its effects on the evolution of the Asian summer mon-soon, J. Meteorol. Soc. Jpn., 70, 319–351, 1992.
Yanai, M. and Wu, G.-X.: Effect of the Tibetan Plateau, in: The Asian Monsoon, edited by: Wang, B., Springer, 513–549, 2006. Yang, K., Koike, T., Ishikawa, H., and Ma, Y.-M.: Analysis of the
Surface Energy Budget at a site of GAME/Tibet using a Single-Source Model, J. Meteorol. Soc. Jpn., 82, 131–153, 2004. Yang, K., Koike, T., Ye, B.-S., and Bastidas, L.: Inverse analysis
of the role of soil vertical heterogeneity in controlling surface soil state and energy partition, J. Geophys. Res., 110, D08101, doi:10.1029/2004JD005500, 2005.
Tamagawa, K., Koudelova, P., Kitsuregawa, M., Nemoto, T., Ya-sukawa, M., Ikoma, E., Bosilovich, M., and Williams, S.: Initial CEOP-based review of the prediction skill of operational general circulation models and land surface models, J. Meteorol. Soc. Jpn., 85A, 99–116, 2007.
Yang, K., Koike, T., Ishikawa, H., Kim, J., Li, X., Liu, H.-Z., Liu, S.-M., Ma, Y.-M., and Wang, J.-M.: Turbulent flux transfer over bare soil surfaces: Characteristics and parameterization, J. Appl. Meteorol. Clim., 40, 276–290, 2008.