www.hydrol-earth-syst-sci.net/15/2709/2011/ doi:10.5194/hess-15-2709-2011
© Author(s) 2011. CC Attribution 3.0 License.
Earth System
Sciences
Insights from a joint analysis of Indian and Chinese monsoon
rainfall data
M. Zhou1, F. Tian1, U. Lall2, and H. Hu1
1Department of Hydraulic Engineering, State Key Laboratory of Hydroscience and Engineering, Tsinghua University,
Beijing 100084, China
2Department of Earth and Environmental Engineering, Columbia University, MC 4711 New York, NY 10027, USA
Received: 15 March 2011 – Published in Hydrol. Earth Syst. Sci. Discuss.: 31 March 2011 Revised: 24 August 2011 – Accepted: 24 August 2011 – Published: 29 August 2011
Abstract. Monsoon rainfall is of great importance for agri-cultural production in both China and India. Understanding the features of the Indian and Chinese monsoon rainfall and its long term predictability is a challenge for research. In this paper Principal Component Analysis (PCA) method was adopted to analyze Indian monsoon and Chinese monsoon separately as well as jointly during the period 1951 to 2003. The common structure of Indian monsoon and Chinese mon-soon rainfall data was explored, and its correlation with large scale climate indices and thus the possibility of prediction were analyzed. The joint PCA results gives a clearer correla-tion map between Chinese monsoon rainfall and Indian mon-soon rainfall. The common rainfall structure presents a sig-nificant teleconnection to Sea Surface Temperature anomaly (SSTa), moisture transport and other climate indices. Specifi-cally, our result shows that Northern China would garner less rainfall when whole Indian rainfall is below normal, and with cold SSTa over the Indonesia region more rainfall would be distributed over India and Southern China. The result also shows that SSTa in the previous winter months could be a good indicator for the summer monsoon rainfall in China.
1 Introduction
Chinese monsoon and Indian monsoon are important for agricultural production and economy in China and India (Parthasarathy et al., 1988; Webster et al., 1998; Abrol and Gadgil, 1999). The two monsoons both belong to Asian monsoon and are primarily influenced by Indian Ocean and West Pacific Ocean. There are studies showing that they are
Correspondence to: F. Tian (tianfq@tsinghua.edu.cn)
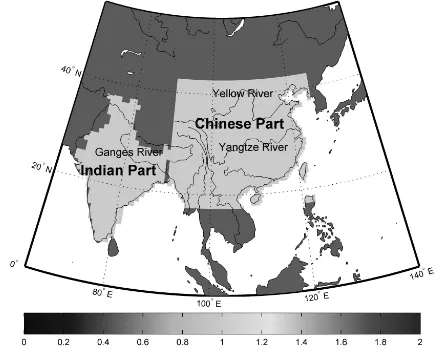
Fig. 1. The study area and major rivers.
It can be, therefore, concluded that Indian monsoon and Chinese monsoon are correlated in some way, and they are similarly influenced by some common climate drivers (like ENSO, SST, Subtropical ridge, etc. at annual scale) although the ways of influencing are different. Encouraged by these existing results, we consider that Indian monsoon and Chi-nese monsoon belong to a larger monsoon structure. The primary goal of this study is to figure out the common cli-mate factors driving both monsoon structures at the annual scale, and the ways how these factors interplay in the mech-anism of a larger monsoon structure. Principal Component Analysis (PCA) method is used to obtain the primary pat-terns of Chinese and Indian monsoon rainfall separately as well as jointly, and then the correlation analysis is performed between the derived principal components and climate in-dices like Sea Surface Temperature Anomalies and moisture transport with the purpose to explore the driving factors.
The remainder of this paper is organized as follows. In Sect. 2 we describe the sources of data used in this study. Following this, in Sect. 3 we first perform PCA on monsoon rainfall data of China and India separately and also the cor-relation analysis between them, and then we perform PCA again on the principal components of rainfall data of both India and China, and correlation analysis is also performed again to investigate the climate factors influencing monsoon rainfalls in the two regions. Finally we discuss our results in Sect. 4 together with the conclusions.
2 Data
The gridded rainfall data of China and India was col-lected from the World Climate Research Programme/Global Climate Observing System (WCRP/GCOS) Global Pre-cipitation Climatology Centre (http://www.wcrp-climate. org/, http://www.wmo.int/pages/prog/gcos/index.php,http://
gpcc.dwd.de/), and the recording period is from the year of 1951 to 2003. The spatial resolution of collected rainfall data for Indian part and Chinese part is different. For the Indian part, the grid resolution is 1.0 by 1.0 degree and we chose to include the entire India (totally 357 grids), while for the Chinese part the resolution is 0.5 by 0.5 degree and we chose the area within 90◦E–125◦E, 17◦N–43◦N (totally 3024 grids), as shown in Fig. 1. To be noted, the latter area includes most part of China and also a small part of north-ern area of Southeast Asia (part of Myanmar, Thailand, Laos and Vietnam), which can represent the characteristics of Chi-nese monsoon and is, therefore, called ChiChi-nese part just for convenience. The Indian monsoon season is from June to September. In Chinese part, the monsoon season varies from region to region, i.e., it begins earlier in Southeastern China while later in Northern China. On average, it lasts for four months from June to September. In this study, we chose the monsoon season of China and India included the four months of June, July, August and September (shortly as JJAS). We acknowledge that the variability in monsoon timing and du-ration is critically important and the corresponding climate driving mechanisms is worthy of intense investigation, which is, however, beyond the scope of this paper and left for future research.
3 Analysis and results
3.1 Principal component analysis of Indian monsoon and Chinese monsoon separately
In this subsection we studied the correlations between mon-soon rainfall patterns in India and China. First we per-formed the principal component analysis on Indian and Chi-nese yearly monsoon rainfall data individually. The results show that the first principal component (PC1) of India takes 20 % of all and the second principal component (PC2) takes 10 %. For Chinese part, the PC1 takes 11 % of all and PC2 takes 8 %. India PC1 and China PC1 have a negative correla-tion−0.5, and India PC2 and China PC1 also have a negative correlation−0.4. China PC2 has low correlation with India PCs. These suggest that Indian monsoon and Chinese mon-soon have some patterns in common.
Table 1. Correlation coefficients between China/India rainfall PCs and monsoon indices (IMI & WNPMI).
Correlation India PC1 India PC2 China PC1 China PC2 Joint PC1 Joint PC2
IMI 0.83 0.04 −0.35 −0.42 −0.73 −0.19
WNPMI 0.21 −0.65 −0.14 0.28 0.08 0.58
(a) (b)
(c) (d)
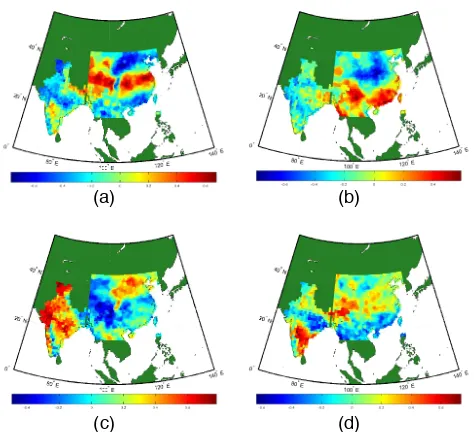
Fig. 2. Correlation maps between rainfall PCs and rainfall field of China and India. (a) China PC1 vs. rainfall field of China and India; (b) China PC2 vs. rainfall field of China and India; (c) India PC1 vs. rainfall field of China and India; (d) India PC2 vs. rainfall field of China and India.
has a high positive correlation with the rainfall in the middle eastern part of China (downstream of Yangtze River) while a high negative correlation with that in the northern part of In-dia and northern part of China around 40◦N 110◦E. It should be highlighted that both maps have similar dipole patterns in the middle part of India and middle eastern part of China (downstream of Yangtze River basin). We also list the cor-responding results in Fig. 2b and d for China PC2 and India PC2 respectively. The similar phenomena could be found in PC2 figures compared to PC1 figures, which shows that In-dia PCs have some common patterns with China PCs besides their own patterns.
Additionally, the correlation coefficients between China/India PCs and monsoon indices (Wang, et al., 2001), i.e., Indian Monsoon Index (IMI) and West-North Pacific Monsoon Index (WNPMI), were calculated, which are listed in Table 1. As we can see from Table 1, India PC1 is significantly correlated to IMI and India PC2 is highly correlated to WNPMI, which agrees with the previous study (Wang et al., 2001). Both China PC1 and PC2 are correlated
to IMI, and the correlation coefficient of China PC1 is slightly higher than that of China PC2. China PC2 is also correlated to WNPMI, while China PC1 is not significantly correlated to WNPMI. To be noted, here and throughout this paper we take significant level for correlations is 99 %.
As the rainfall PCs we obtained present main trends of rainfall in the study areas, the correlation patterns between PCs in India and China suggest common factors affecting rainfall processes. The correlation analysis between PCs in both areas and IMI/WNPMI further reveals that Indian mon-soon and West-North Pacific monmon-soon are two of these com-mon factors. These possible comcom-mon factors will be studied in more details using joint-PCA in Sect. 3.2.
3.2 Joint principal component analysis of Indian monsoon and Chinese monsoon
Since the length of time series is far less than the number of stations for our rainfall data, the ability of PCA to minimize noise is weakened. Furthermore, as the PCs of India and the PCs of China is well correlated, to get these common features (and to reduce noise), the joint PCA was performed with the following steps: first, we chose the first two leading PCs of India and China we got in Sect. 3.1; then we performed PCA again on the 4 PCs (India PC1, India PC2, China PC1, China PC2) and obtained 4 Joint PCs. Among them, the first and second principal component (joint PC1 and PC2) occupies 42 % and 38 % of the total weight respectively. We calculated correlation coefficients between the four individual PCs and four joint PCs, and the results show that joint PC1 is highly related to China PC1 and India PC1, and joint PC2 is highly related to China PC2 and India PC2.
[image:3.595.49.286.164.380.2](a) (b)
Fig. 3. Correlation maps between Joint PCs and rainfall field of
China and India. (a) Joint PC1 vs. rainfall field of China and In-dia; (b) Joint PC2 vs. rainfall field of China and India.
Middle India, and negative correlation with Middle China (mostly Yangtze River basin) and Southern India. From this figure, we can see that the pattern of joint PC2 is closely related to mid-east subtropical jet veered towards India, In-dochina Peninsula and West Pacific Ocean. Joint PC2 load-ing of rainfall variability over India is more or less a dipole of rainfall over Ganges River basin: north cyclone route from Bay of Bangal (BoB) to Northern India and the relatively south route of the cyclones from BoB. The variability of Northern India is coherent with that over Indochina Penin-sula and Southern China, probably with a common cause fa-voring cyclone activities.
Again, we compared these joint PCs with monsoon in-dices (see also Table 1). Joint PC1 is highly correlated to IMI, while joint PC2 is highly correlated to WNPMI. From the previous analysis, joint PC1 mostly comes from Middle China (mainly in Yangtze River basin) and South India, it keeps the feature of India PC1, i.e., the high correlation with IMI. Joint PC2 partly comes from China PC2, and is highly correlated to WNPMI, while China PC2 is not well correlated to WNPMI. This is because the second PCA derived a com-mon character from China PCs and India PCs, which may or may not be present in the first PCA on Chinese monsoon and Indian monsoon alone.
In Sects. 3.1 and 3.2 the primary analysis method we use is PCA. As we know, the raw precipitation dataset used in this paper is huge, and the data is affected by some large scale climate factors that we are interested in, as well as other mi-nor local factors. Those major climate factors determine the main trends in the raw data. PCA is capable of extracting the main trends from the raw data, and separating it from other minor fluctuations. Therefore it is a powerful method for our purpose. Besides PCA, some other methods can also be used for similar purposes such as independent component anal-ysis (ICA) method and maximum value unfolding (MVU) method. ICA is a family of analyzing methods based on varied assumptions of statistical characteristics of the com-ponents in the raw data, while PCA uses a relatively sim-ple assumption. Without any a priori knowledge of the cli-mate factors we are looking for, PCA makes a good starting
(a) (b)
(c) (d)
(e) (f)
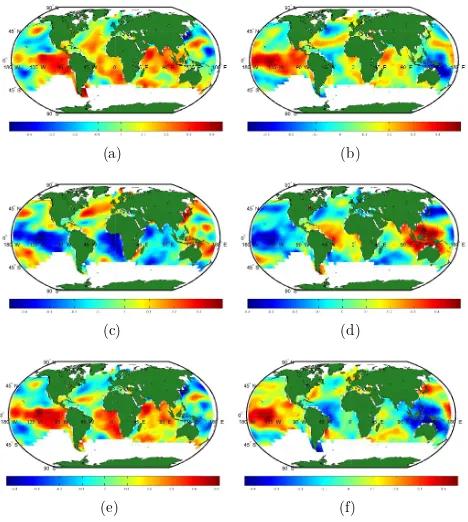
Fig. 4. Correlation maps between SSTa in the monsoon summer
season (JJAS) and PCs. (a) China PC1 vs. SSTa; (b) China PC2 vs. SSTa; (c) India PC1 vs. SSTa; (d) India PC2 vs. SSTa; (e) Joint PC1 vs. SSTa; (f) Joint PC2 vs. SSTa.
point for our study. Comparing to MVU, a nonlinear analyz-ing method, PCA has the weakness of beanalyz-ing linear and can-not fully represent the nonlinear nature in climate processes. However, it is also more stable against noises in the data be-cause of its linearity, and it is an acceptable approximation for our purposes.
3.3 Correlation with Sea Surface Temperature anomaly (SSTa) and other climate indices
[image:4.595.311.545.62.323.2](a) (b)
(c) (d)
[image:5.595.307.546.61.283.2](e) (f)
Fig. 5. Correlation maps between SSTa in the previous winter
sea-son (DJF) and PCs. (a) China PC1 vs. SSTa; (b) China PC2 vs. SSTa; (c) India PC1 vs. SSTa; (d) India PC2 vs. SSTa; (e) Joint PC1 vs. SSTa; (f) Joint PC2 vs. SSTa.
China PC2 and SSTa. Joint PC1 shows a significant positive correlation with SSTa in the months of JJAS within Pacific Ocean around 90◦W–135◦W, 10◦N–10◦S, which is mainly Nino3 area. Joint PC2 shows a significant positive corre-lation within Pacific Ocean around 135◦E–180◦E, 10◦N– 10◦S, which is mainly Nino4 area. Joint PC2 shows a sig-nificant negative correlation with Indonesian Sea.
Also presented here are the correlation maps (Fig. 5) be-tween SSTa in the previous winter months (December, Jan-uary and FebrJan-uary, DJF) and PCs (India PCs, China PCs and joint PCs). Contrary to the correlation pattern between PCs and summer SSTa, joint PC1 shows a negative correlation with SSTa (DJF) around Nino 4 area, and joint PC2 shows a negative correlation with SSTa (DJF) around Nino 3 area. The correlation of summer SSTa with the joint PC1 (Fig. 4e) shows warm anomaly over the whole tropical belt except West Pacific Ocean, especially over Indian Ocean. This sug-gests weaker than normal surface wind speed over the In-dian Ocean. The winter SSTa pattern associated with joint PC2 (Fig. 5f) shows that with cold SSTa over the Indone-sia region, more rainfall would be distributed over India and Southern China.
Besides SSTa, we also checked the correlation of rain-fall PCs with other long term climate indices (e.g., PDO and IOD), which is much less significant comparing to SSTa (be-low the significant level used in this study). Therefore, the
(a) (b)
[image:5.595.53.287.62.322.2](c) (d)
Fig. 6. Average rainfall anomaly in the monsoon months (JJAS)
during five years with lowest or highest PCs values from Joint PCs.
(a) Years with lowest PCs values from Joint PC1; (b) years with
highest PCs values from Joint PC1; (c) years with lowest PCs values from Joint PC2; (d) years with highest PCs values from Joint PC2.
SSTa might probably serve as the most important influencing climate index for the annual variation of precipitation. As revealed by Chang (2000), Hu (2005) among many others, SSTa can in general affect rainfall through atmosphere cir-culation, especially moisture transportation processes. Our PCA results suggest that the physical mechanism affecting Chinese and Indian rainfall can be represented principally by the SSTa.
3.4 Analysis of extreme years
To gain further insight into the spatiotemporal correlation be-tween Chinese and Indian monsoon rainfall, we analyzed the statistical data during the years when these leading modes strike extreme values. For each of the 4 joint PCs, we identi-fied 10 % (5 out of 53) of the years in which the joint PCs had the highest and the lowest values (Table 2). Then we made rainfall anomaly maps, moisture transport maps and SSTa maps for the average of 5 yr with lowest PCs values and 5 yr with highest PCs values. Looking at the average rainfall of years with highest PCs values from joint PC1, the Fig. 6a is consistent with the result from the Fig. 3a. The average rain-fall of the five years with lowest PCs values from joint PC1 shows that Middle China and Southern India are dry, and the locations with negative correlation with PC1 are wet. The pattern is almost the opposite in the years with highest PCs values.
Table 2. Five years with lowest joint PCs values and those with highest values. Years labeled by stars are El Nino years, and ones labeled by
daggers are La Nina years.
Lowest Highest
Joint PC1 1959 1961 1994∗ 1956 1978∗ 1965† 1987∗ 1974† 1991∗ 1999† Joint PC2 1983∗ 1998∗ 1988† 1989† 1964∗ 1994∗ 2001∗ 1997∗ 1952 1961
(a) (b)
[image:6.595.52.285.179.351.2](c) (d)
Fig. 7. Average SSTa in the previous winter months (DJF)
dur-ing five years with lowest or highest PCs values from Joint PCs.
(a) Years with lowest PCs values from Joint PC1; (b) years with
highest PCs values from Joint PC1; (c) years with lowest PCs val-ues from Joint PC2; (d) years with highest PCs valval-ues from Joint PC2.
indicates a weak relationship between joint PC1 and ENSO, as shown in Fig. 7a and b. During the lowest value years, the temperature in the ENSO region is slightly higher, but not high enough to present an El Nino phenomenon. The years with lowest PCs values from PC1 are wetter years for most regions in India. The Sea Surface Temperature pattern in DJF in years with lowest PCs values and years with highest PCs values from joint PC2 indicates a much clearer relationship between joint PC2 and ENSO, as shown in Fig. 7c and d. During the years with lowest PCs values, the temperature in the ENSO region is obviously higher. The years with low-est PCs values from PC2 are wetter years for lower Yangtze River basin in China and Southern India, and are drier years for Middle India.
Moreover, we studied five years average moisture trans-port during the years with lowest and highest PCs values de-termined from joint PC1 and PC2, which are shown in Fig. 8. As we can see from the figures, for the joint PC1, the aver-age moisture transport during the years with lowest values in Western India is stronger and brings more precipitation into Middle India. On the other hand, the moisture transport during years with highest values is weaker and bring more
(a) (b)
[image:6.595.309.547.181.320.2](c) (d)
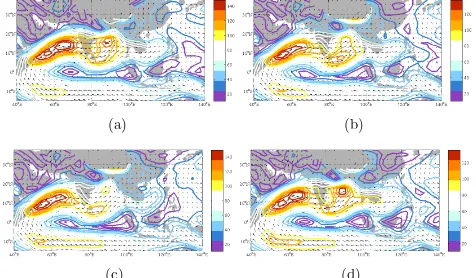
Fig. 8. Average moisture transport at 700 mb–1000 mb in the
mon-soon months (JJAS) during five years with lowest or highest PCs values from Joint PCs. (a) Years with lowest PCs values from Joint PC1; (b) years with highest PCs values from Joint PC1; (c) years with lowest PCs values from Joint PC2; (d) years with highest PCs values from Joint PC2.
precipitation into Southeastern and Northeastern India. For the joint PC2, the moisture from Indian Ocean is compara-tive during the years with lowest value compared to the years with highest values, while the moisture from Pacific Ocean during the years with highest values is a little stronger than the years with lowest values. This could serve as one reason that Southeastern China is wetter during the years with high-est PC2 values than those with lowhigh-est PC2 values (Fig. 6).
These results from moisture transport coincide with the previous results discussed in Sect. 3.2. Joint PC1 is corre-lated with IMI, so that the variation of moisture fluxes from Indian Ocean plays an important role in monsoon precipita-tion during the peak years of joint PC1. Joint PC2 is corre-lated with WNPMI, so that the variation of moisture fluxes from West-North Pacific Ocean plays an important role in monsoon precipitation during the peak years of joint PC2.
4 Summary and conclusion
Quite a few studies indicate that Chinese monsoon and Indian monsoon are correlated in some way. To explore the common structures of the two monsoons and the underlying physical mechanism at the annual scale, the yearly precipitation time series data from Indian and Chinese areas with the recording length of over 50 yr were collected and analyzed by Prin-cipal Component Analysis method and Correlation Analysis method. After a traditional treatment of monsoon data (i.e., PCA of Indian monsoon and Chinese monsoon separately), a joint PCA were performed on the PCs of Indian monsoon and Chinese monsoon obtained from the previous PCA ma-nipulation. Also, the correlation of monsoon rainfall and the PCs with SSTa and other large scale climate indices were ex-plored and the extreme years were particularly selected for detail analysis.
Our results indicate the intertwined correlation between and within Indian monsoon and Chinese monsoon. For ex-ample, joint PCA clearly shows that the joint PC1 has high positive correlation with Middle China and Southern India and has high negative correlation with Northeastern China, part of Southern China, Northern India and Middle India. The results also show that Northern China garners less rain-fall when whole Indian rainrain-fall is below normal, while Mei-Yu over the Yangtze River Valley along about 30 N gets more rainfall. The possible reason might be the weaker than nor-mal monsoon induced by warmer tropical SST and thus the smaller land-sea temperature difference. Under this circula-tion situacircula-tion, Mei-yu advances northward slower and stays over Yangtze River valley for a longer time, which produces more rainfall there but less rainfall over Northern China. These characteristics and many other common features be-tween Indian monsoon and Chinese monsoon suggest that both monsoons belong to a larger monsoon structure which should be studied as a whole. Compared to traditional uti-lization of PCA method separately on the rainfall data in the two monsoon regions, the joint PCA can give clearer patterns of Indian and Chinese monsoon rainfall.
Furthermore, the analysis reveals the teleconnec-tions between monsoon rainfall and monsoon indices (IMI/WNPMI), SSTa and other large scale climate indices. For example, our results suggest two moisture sources for Indian monsoon and Chinese monsoon, i.e., the Indian Ocean and West Pacific Ocean, each of which dominates monsoon rainfall in different areas indicated by the joint PCs. The results also show that generally the SSTa in the previous winter season can be linked to the following sum-mer monsoon rainfall, and specifically with cold SSTa over the Indonesia region during winter season more monsoon rainfall would be distributed over India and Southern China in summer season. This provides predictability for Indian and Chinese monsoon rainfall through joint PC1 and PC2, which will be presented in more detail in a following paper (Zhou et al., 2011).
Acknowledgements. We thank World Climate Research
Pro-gramme for providing all the data used in this study. The work was funded in part by the National Science Foundation of China (NSFC 50823005, 51179084), China Scholarship Council, and Water Center of Columbia University. The financial support is gratefully acknowledged.
Edited by: M. Sivapalan
References
Abrol, Y. P. and Gadgil, S. (Eds.): Rice- in a Variable Climate, APC Publications, Pvt Ltd, New Delhi, 243 pp., 1999.
Chang, C. P., Zhang, Y. S., and Li, T.: Interannual and interdecadal variations of the East Asian summer monsoon and tropical Pa-cific SSTs, Part I: roles of the subtropical ridge, J. Climate, 13(24), 4310–4325, 2000.
Chan, J. C. L. and Zhou, W.: PDO, ENSO and the early sum-mer monsoon rainfall over south China, Geophys. Res. Lett., 32, L08810, doi:10.1029/2004GL022015, 2005.
Kripalani, R. H. and Kulkarni, A.: Monsoon rainfall variations and teleconnections over South and East Asia, Int. J. Climatol., 21(5), 603–616, 2001.
Kripalani, R. H. and Singh, S. V.: Large scale aspects of India-China summer monsoon rainfall, Adv. Atmos. Sci., 10(1), 71–84, 1993.
Hu, Z., Wu, R., James, L., and Yang, S.: Connection of sum-mer rainfall variations in South and East Asia: role of El Nino-southern oscillation, Int. J. Climatol., 25(9), 1279–1289, 2005. Huang, R. and Sun, F.: Impacts of the thermal state and the
convec-tive activities in the tropical western warm pool on the summer climate anomalies in East Asia, Chinese J. Atmosph. Sci., 18(2), 46, 1994.
Parthasarathy, B., Munot, A. A., and Kothawale, D. R.: Regression model for estimation of Indian food grain production from Indian summer rainfall, Agr. Forest Meteorol., 42, 167–182, 1988. Wang, B., Wu, R., and Lau, K. M.: Interannual variability of Asian
summer monsoon: Contrast between the Indian and Western North Pacific-East Asian monsoons, J. Climate, 14, 4073–4090, 2001.
Webster, P. J., Magana, V. O., Palmer, T. N., Shukla, J., Tomas, R. T., Yanai, M., and Yasunari, T.: Monsoons: Processes, pre-dictability and the prospects of prediction, J. Geophys. Res., 103(C7), 14451–14510, 1998.
Yang, F. L. and Lau, K. M.: Trend and variability of China precipi-tation in spring and summer: linkage to sea-surface temperatures, Int. J. Climatol., 24(13), 1625–1644, 2004.
Zhang, Q., Xu, C. Y., Jiang, T., and Wu, Y. J.: Possible influence of ENSO on annual maximum streamflow of the Yangtze River, China, J. Hydrol., 333(2–4), 265–274, 2007.