www.hydrol-earth-syst-sci.net/18/4871/2014/ doi:10.5194/hess-18-4871-2014
© Author(s) 2014. CC Attribution 3.0 License.
Comparison of rainfall estimations by TRMM 3B42, MPEG and
CFSR with ground-observed data for the Lake Tana basin in
Ethiopia
A. W. Worqlul1,4,5, B. Maathuis2, A. A. Adem3, S. S. Demissie6, S. Langan4, and T. S. Steenhuis1,5
1Cornell University, Ithaca, New York, USA 2University of Twente, Faculty ITC, the Netherlands
3Amhara Design and Supervision Works Enterprise, Bahir Dar, Ethiopia 4International Water Management Institute, Addis Ababa, Ethiopia
5Bahir Dar University, School of Civil and Water Resource Engineering, Bahir Dar, Ethiopia 6DRS Development & Research Solutions, Addis Ababa, Ethiopia
Correspondence to: A. W. Worqlul (aww64@cornell.edu)
Received: 25 June 2014 – Published in Hydrol. Earth Syst. Sci. Discuss.: 14 July 2014 Revised: 27 October 2014 – Accepted: 30 October 2014 – Published: 5 December 2014
Abstract. Planning for drought relief and floods in devel-oping countries is greatly hampered by the lack of a suf-ficiently dense network of weather stations measuring pre-cipitation. In this paper, we test the utility of three satel-lite products to augment the ground-based precipitation mea-surement to provide improved spatial estimates of rain-fall. The three products are the Tropical Rainfall Measur-ing Mission (TRMM) product (3B42), Multi-Sensor Pre-cipitation Estimate–Geostationary (MPEG) and the Climate Forecast System Reanalysis (CFSR). The accuracy of the three products is tested in the Lake Tana basin in Ethiopia, where 38 weather stations were available in 2010 with a full record of daily precipitation amounts. Daily gridded satellite-based rainfall estimates were compared to (1) point-observed ground rainfall and (2) areal rainfall in the ma-jor river sub-basins of Lake Tana. The result shows that the MPEG and CFSR satellites provided the most accurate rain-fall estimates. On average, for 38 stations, 78 and 86 % of the observed rainfall variation is explained by MPEG and CFSR data, respectively, while TRMM explained only 17 % of the variation. Similarly, the areal comparison indicated a better performance for both MPEG and CFSR data in cap-turing the pattern and amount of rainfall. MPEG and CFSR also have a lower root mean square error (RMSE) compared to the TRMM 3B42 satellite rainfall. The bias indicated that
TRMM 3B42 was, on average, unbiased, whereas MPEG consistently underestimated the observed rainfall. CFSR of-ten produced large overestimates.
1 Introduction
4872 A. W. Worqlul et al.: Comparison of rainfall estimations for the Lake Tana basin in Ethiopia large uncertainties into rainfall distribution estimation, and
will evidently undermine the dependability of hydrologic models used in simulating flow (both low flows and floods), sediment load and nutrient fluxes (Kaba et al., 2014). The unavailability of good quality rainfall data renders hydrol-ogists reluctant to deal confidently with pressing and un-precedented societal questions vis-à-vis food deficits, global warming, climate change, water scarcity and water shortage issues (Baveye, 2013).
The growing availability of high-resolution (and near-real-time) satellite rainfall products can help hydrologists to ob-tain more accurate precipitation data, particularly in devel-oping countries and remote locations where weather radars are absent and conventional rain gauges are sparse (Cre-utin and Borga, 2003; Kidd, 2001). Satellite-derived rainfall estimates have become a powerful tool for supplementing the ground-based rainfall estimates. Recently, Earth obser-vation data for environmental or societal purposes have be-come readily available through Earth observation (EO) satel-lites and data distribution systems. Some of the freely avail-able spatially distributed rainfall estimates are the Tropical Rainfall Measuring Mission (TRMM; Simpson et al., 1988), EUMETSAT’s Meteorological Product Extraction Facility (MPEF), Multi-Sensor Precipitation Estimate–Geostationary (MPEG), the Climate Forecast System Reanalysis (CFSR), the NOAA/Climate Prediction Center morphing technique (CMORPH), precipitation estimation from remotely sensed information using artificial neural network (PERSIANN), the Naval Research Laboratory’s blended product (NRLB), and more.
Passive microwave (PM) and thermal infrared (TIR) sen-sors are the most widely used channels of the electromag-netic spectrum for satellite rainfall estimation (Huffman et al., 2007; Negri et al., 1984; Joyce et al., 2004; Kidd et al., 2003). A TIR sensor provides useful information on storm clouds based on top cloud temperature. The assumption in the TIR is that relatively cold clouds are associated with thick and high clouds that tend to be associated with the produc-tion of high rainfall rates (Haile et al., 2010). One of the lim-itations with a TIR sensor is that it only uses the top cloud temperature from which the depth of the cloud is inferred (Todd et al., 2001), and it also underestimates warm rain and misidentifies cirrus clouds as rain (Dinku et al., 2011). Mi-crowave sensors utilize a more direct way of retrieving pre-cipitation from satellites; they gather information about the rain rather than the cloud (Todd et al., 2001). The absorp-tion of microwave radiaabsorp-tion by liquid water and its scatter-ing by ice particles can be related to rainfall over the ocean and over land (Ferraro, 1997). The disadvantage of PM sen-sors is that they are not available on geostationary satellites, which makes them have a longer latency (Heinemann et al., 2002). A combination of both, microwave (MW) data from polar orbiting satellites and IR data from geostationary sys-tems, is an obvious approach to overcoming some of the shortcomings in the estimation of precipitation. In this study,
satellite-estimated rainfall by TRMM 3B42 (hereafter, sim-ply “TRMM”), MPEG and CFSR is validated by comparing the estimates with the ground observation rainfall data in the Lake Tana basin, Ethiopia.
Validation of satellite rainfall products in the Ethiopian highlands will give an insight into how the different prod-ucts perform in this region. In general, three seasons exist in Ethiopia. The main rainfall season from June to Septem-ber, called the “Kremt” season, accounts for a large propor-tion of the annual rainfall (approximately 86 %), and the dry season extending from October to January called “Bega” is followed by a small rainy season called “Belg”. The most important weather systems that cause rain over the country include the intertropical convergence zone (ITCZ), the Red Sea convergence zone (RSCZ), the tropical easterly jet (TEJ) and the Somalia jet (NMSA, 1996; Seleshi and Zanke, 2004). The main rainy seasons were found to be significantly corre-lated with the El Niño–Southern Oscillation (ENSO; Cam-berlin, 1997), and most of the drought seasons in Ethiopia are more likely to occur during warm ENSO events (Seleshi and Demaree, 1995).
A number of studies have been done to validate TRMM in the Ethiopian highlands (Dinku et al., 2010; Tsidu, 2012). These studies have focused on comparisons of gridded satel-lite rainfall estimations to ground rainfall observation data. This study validates satellite rainfall products in two ways: by comparing satellite-gridded rainfall data to point obser-vation data and, second, by comparing satellite areal rain-fall estimates to areal ground-observed rainrain-fall interpolated by the Thiessen polygon method for the major sub-basins of Lake Tana. The Lake Tana basin is selected to take advantage of a relatively higher rainfall observation station density and the availability of daily rainfall data. These rainfall products are selected for comparison given the fact that the state-of-the-art algorithms are used to generate them. They are also freely available for use in Africa. For example, Bahir Dar University, in collaboration with the Tana sub-basin office and the University of Twente, the Netherlands, have estab-lished a GEONETCast ground-receiving station (Wale et al., 2011) that makes the MPEG satellite rainfall product locally available. In addition, all three rainfall estimates (TRMM, CFSR and MPEG) have a relatively high spatial resolution, global coverage and high temporal resolution.
The general objective of the study is to examine which of the three freely available satellite products gives the best es-timates of the spatial distribution of rainfall in mountainous terrain of Ethiopia. The satellite estimates are compared with a relatively dense network of ground rainfall observation sta-tions distributed across the Lake Tana basin for the year 2010 for which we were able to obtain the most dense distribution of daily precipitation data.
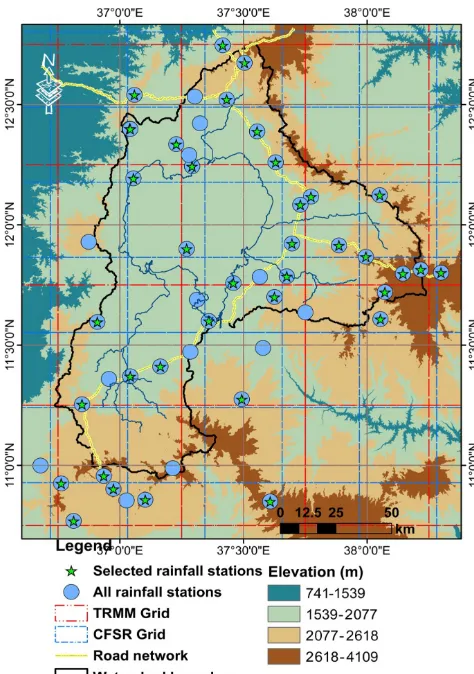
Figure 1. The Lake Tana watershed, showing the TRMM and CFSR grids and the location of the available and selected rainfall stations (90 m digital elevation model as background).
1.1 Description of the study area
The study is carried out in the Lake Tana basin source of the Blue Nile River in the northwestern highlands of Ethiopia, with a total catchment area of 15 000 km2. The lake covers around 3060 km2 at an altitude of 1786 m. The lake is lo-cated at 12◦000N, 37◦150E around 564 km from the capital Addis Ababa (Wale, 2008). The basin has a complex topog-raphy with significant elevation variations ranging from 1786 to 4107 m. The long-term annual average rainfall from 1994 to 2008 ranges from 2500 mm south of Lake Tana to 830 mm west of Lake Tana. Fig. 1 shows the spatial distribution of the rain gauge station network in and around the Lake Tana basin with a TRMM and CFSR grid.
1.2 Data availability
The data required for this study, gauge-observed rainfall data, are collected from the Ethiopian National Meteoro-logical Agency (ENMA). Long-term average annual rainfall from 1994 to 2008, daily rainfall data for the year 2010 and
station location and elevation for 51 stations in and around the Lake Tana basin are obtained from ENMA. Some sta-tions did not record the rainfall consistently on a daily basis or, for other stations, the location and the elevation were not known. Thirty-eight stations remained that have continuous daily rainfall data for the selected study period (2010). Of these 38, there are seven stations classified as Class 1 (syn-optic stations), where all meteorological parameters are mea-sured every hour. The majority of the 17 stations are Class 3 (ordinary stations), where only rainfall and maximum and minimum temperature are collected on a daily basis. The re-maining 14 stations are Class 4; only daily rainfall amounts are recorded.
Some of the MPEG data at 15 m temporal intervals are acquired in near real time from the low-cost satel-lite image reception station established at Bahir Dar Uni-versity, Institute of Technology (Wale et al., 2011). The daily aggregated MPEG data from 00:00 till 23:45 UTC, in mm day−1, are available online at ftp://ftp.itc.nl/pub/ mpe/msg/. TRMM gridded rainfall estimates are collected from the ftp site, available at ftp://disc2.nascom.nasa. gov/data/s4pa/TRMM_L3/TRMM_3B42_daily/. The daily gridded CFSR rainfall data can be collected from http://rda.ucar.edu/datasets/ds094.1/.
2 Methods
The predicted satellite rainfall estimate and observed gauged rainfall data have different spatial and temporal scales. The ground observation consists of 38 daily observations of point rainfall amounts irregularly distributed across the Lake Tana basin (Fig. 1). The MPEG, TRMM and CFSR rainfall con-sists of spatially distributed time series regularly gridded data with spatial resolutions of 3 km, 0.25◦(≈27 km at the Equator) and 38 km, respectively. A detailed description of TRMM, MPEG and CFSR data is provided in Appendix A. The average annual rainfall from 1994 to 2008 is plotted against the station elevation to see the stations likely affected by convective precipitation and those very much affected by a combination of orographic and convective precipitation. The backwards elimination technique was used to obtain the lin-ear trends with elevation in the long-term average rainfall. The backward elimination technique successively eliminates the weakest independent station (variable), after which the regression will be recalculated (Xu and Zhang, 2001). If re-moving the variable significantly weakens the linear model, then the variable is re-entered; otherwise, it is deleted. This procedure is then repeated until only useful variables remain in the linear elevation–rainfall model.
4874 A. W. Worqlul et al.: Comparison of rainfall estimations for the Lake Tana basin in Ethiopia
[image:4.612.310.545.66.190.2]18 1
Figure 2: Averaged monthly gauged rainfall distribution of selected stations in the Lake Tana 2
Basin (from 1994 -2008). 3 4 0 80 160 240 320 400 480
Jan Feb Mar Apr May Jun Jul Aug Sep Oct Nov Dec
R ai n fa ll (m m ) Month
[image:4.612.51.286.69.182.2]Yifag Bahir Dar Enfiranz Chuahit
Figure 2. Averaged monthly gauged rainfall distribution of selected stations in the Lake Tana basin (from 1994 to 2008).
Point-to-grid comparison
The grids of satellite rainfall estimation (MPEG, TRMM and CFSR) are compared to the ground rainfall observa-tion data within the satellite grid box. This means that point ground observation data are compared against satellite grid data of sizes of 3×3 km, 0.25×0.25◦ and 38×38 km for MPEG, TRMM and CFSR, respectively. Finally, the com-parison on monthly and annual bases is done by applying standard statistics.
Areal comparison
Satellite rainfall estimation is compared with the interpolated observed rainfall stations. The ground rainfall observations are interpolated adopting a Thiessen polygon method and compared with the respective satellite rainfall estimation for the major gauged river basins of Lake Tana; the accuracy is measured using standard statistics. The major river basins in Lake Tana used for this study are Gilgel Abay, Gumara, Ribb and Megech; according to Kebede et al. (2006), these rivers contribute approximately 93 % of the surface water inflow.
2.1 Ground rainfall observation station (GROS) There are 51 meteorological stations operated by ENMA in the study area. Some of them have no location information and/or the actual elevation provided is not considered reli-able. For the 38 selected stations, daily rainfall is available in the 2010 study period. Monthly rainfall amounts for selected stations are given in Fig. 2. Long-term annual average rainfall varies between 830 and 2500 mm yr−1 from 1994 to 2008. Approximately 86 % of the annual rainfall falls between June and September.
2.2 Statistical measures
Three statistical measures were used to compare the satellite rainfall estimates with the ground rainfall observations con-sisting of the coefficient of determination (R2), multiplicative bias (bias) RMSE.
19 1
2
(a) (b)
Figure 3: (a.) Elevation verses long-term annual average rainfall relations in the Lake Tana
3
Basin (38 stations from 1984 to 2008) and (b.) Two clear relationships: first one shows a 50 4
mm of rainfall increase for every 100 m elevation increase and the second trend observed was 5
a 125 mm rainfall increase for every 100 m elevation increase. 6 7 700 1000 1300 1600 1900 2200 2500 2800
1700 1950 2200 2450 2700 2950 3200
Lon g-te rm A n n u al R ai n fa ll (m m )
Elevation (m )
y = 0.49x + 120.01 R² = 0.69
y = 1.25x - 773.81 R² = 0.64
700 1000 1300 1600 1900 2200 2500 2800
1700 1950 2200 2450 2700 2950 3200
Lon g-te rm A n n u al R ai n fa ll (m m ) Elevation (m)
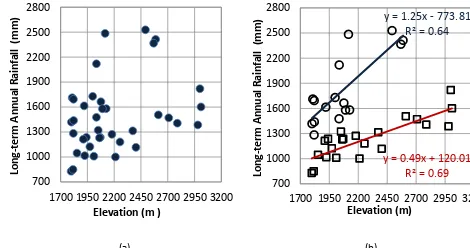
Figure 3. (a) Elevation vs. long-term annual average rainfall rela-tions in the Lake Tana basin (38 starela-tions from 1984 to 2008) and (b) two clear relationships: the first one shows a 50 mm rainfall increase for every 100 m elevation increase, and the second trend observed was a 125 mm rainfall increase for every 100 m elevation increase.
The coefficient of determination (R2) is used to evaluate the goodness of fit of the relation.R2addresses the question of how well the satellite rainfall estimates correspond to the ground rainfall observations: it is the degree of linear associ-ation between the two terms; see Eq. (1).
R2=
nP
(GiSi)− P
Gi P
Si r n P
G2i
− P Gi 2 n P
S2i
− P Si 2 2 , (1)
whereR2is the coefficient of determination,Gi the ground rainfall measurements,Si the satellite rainfall estimates, and
nthe number of data pairs.
RMSE measures the difference between the distributions of the ground-observed rainfall and the distribution of satel-lite rainfall estimation, and calculates a weighted average er-ror, weighted according to the square of the error. RMSE is useful when large errors are undesirable. The lower the RMSE score, the closer the satellite rainfall estimation repre-sents the observed ground rainfall measurement; see Eq. (2).
RMSE= s
P
(Gi−Si)2
n , (2)
where RMSE is the root mean square error,Gi the ground rainfall measurements,Si the satellite rainfall estimates, and
nthe number of data pairs.
Bias is a measure of how the average satellite rainfall mag-nitude compares to the ground rainfall observation. It is sim-ply the ratio of the mean satellite rainfall estimation value to the mean of the ground rainfall observed value. A bias of 1.1 means the satellite rainfall is 10 % higher than the average ground rainfall observations; see Eq. (3).
Bias= P Si P Gi , (3)
whereGi are the ground rainfall measurements andSi the satellite rainfall estimates.
3 Result and discussion
The long-term annual average rainfall from 1994 to 2008 is plotted against station elevation to see the rainfall–elevation relation (Fig. 3). Two clear relationships can be observed; the first one shows a 50 mm of rainfall increase for every 100 m elevation increase and the second trend observed was a 125 mm rainfall increase for every 100 m elevation increase. These two relations can be explained by stations likely af-fected by convective rainfall only (rectangles) and those very much affected by a combination of orographic and convec-tive precipitation (in circles) in Fig. 3.
3.1 Point-to-grid comparison
The satellite rainfall estimates are aggregated to monthly temporal intervals, and the monthly satellite rainfall estima-tion was extracted for the 38 staestima-tion locaestima-tions. The observed ground rainfall and the extracted satellite rainfall for all 38 stations are depicted for the three standard statistical tech-niques in Fig. 4a–c.
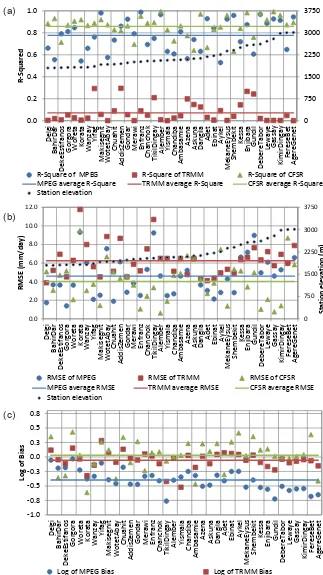
As shown in Fig. 4a, the monthly MPEG and CFSR have strong correlations with the ground rainfall observation sta-tions (GROS). For MPEG, the coefficient of determination ranges from a maximum of 0.99 (Enfranz station) to a mini-mum value of 0.63 (Yismala station). On average, 78 % of the total observed rainfall variation is explained by the MPEG satellite rainfall estimate. The CFSR has a coefficient of de-termination ranging from 0.63 to 0.99 for Shembekit and Gassay, respectively; on average, 86 % of the total observed rainfall variation is explained by CFSR rainfall data for the 38 stations. The correlation between TRMM and GROS on a monthly basis is weak, with a maximum coefficient of de-termination of 0.29 (Addis Zemen station) and a minimum value of 0.00. Multiple stations did not show a correlation with TRMM data. On average, only 7 % of the total ob-served rainfall variation is explained by the TRMM satel-lite rainfall estimates. The root mean square error in Fig. 4b gives very much the same trends as in Fig. 4a. The MPEG and CFSR have a much better RMSE (ranging from 0.63 to 9.5 mm day−1), while TRMM has a RMSE ranging from 3.8 to 11.8 mm day−1.
Thus, MPEG and CFSR rainfall estimates are clearly bet-ter related to gauged rainfall than TRMM. This is in agree-ment with the findings of Dinku et al. (2008), where, on av-erage, TRMM-3B42 captures only 15 % of the rainfall vari-ability for the whole of Ethiopia.
Finally, if we look at the rainfall distribution throughout the year, we found that the rainfall estimates of MPEG and CFSR agree with the ground-based observation of 84 to 86 % of the annual rainfall that occurs in the rainy monsoon phase
from June to September, as exemplified in Fig. 5 for Addis Zemen and Agre Genet stations. In contrast, TRMM finds that only 30 % of rainfall is during the rainy season. Fig. 6 shows the spatial distribution of total rainfall for the year 2010 from MPEG, CFSR and TRMM.
The bias calculated (Fig. 4c, logarithm of bias) for MPEG, TRMM and CFSR ranges from 0.2 to 0.9, 0.5 to 1.9 and 0.24 to 2.69, with average values of 0.43, 1.0 and 1.3, re-spectively. The MPEG is consistent in underpredicting the observed rainfall; on average, it underestimates it by 57 %. The TRMM overestimates for 15 stations, and it underesti-mates for the remainder. The CFSR also overestiunderesti-mates for 24 stations, and it has the largest standard deviation of bias indicating the spread of the bias between stations.
Stations likely affected by convective rainfall (22 stations, marked in rectangles in Fig. 3) have a better correlation coef-ficient and a smaller RMSE than the stations likely affected by a combination of orographic and convective precipitation (16 station, marked in circles in Fig. 3). The bias also indi-cated that stations likely affected by both convective and oro-graphic rainfall will have a higher bias than the stations likely affected by convective rain only. This is quite reasonable, be-cause orographic lifting of the moist air will lead to precipita-tion, while the cloud-top temperature is still relatively warm. Satellite rainfall products may not detect the rainfall from the warm clouds, as the cloud-top temperature would be too warm for TIR thresholds (Dinku et al., 2008), and there will not be much ice aloft to be determined by PM sensors, but both sensors can detect the rainfall from the deep convection (Tsidu, 2012).
3.2 Areal comparison
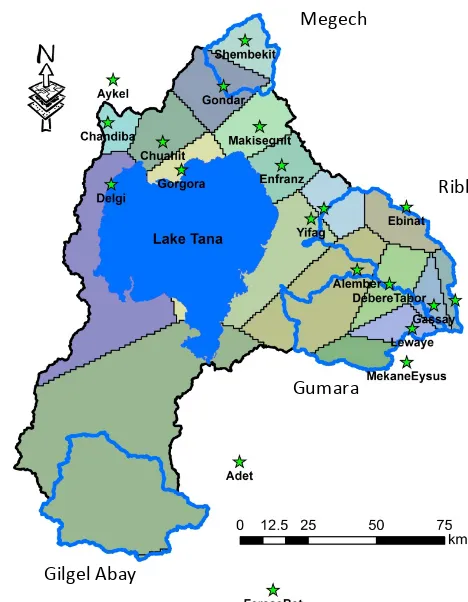
Stations likely affected by convective rainfall are interpo-lated using the Thiessen polygon method, and their weights on areal rainfall for the major watersheds are determined (Fig. 7). Gilgel Abay watershed has two stations likely af-fected by convective rainfall; Megech has three, Gumara six and Ribb seven stations. The areal observed rainfall is com-pared with the areal satellite rainfall estimation for the major gauged river basins in Lake Tana. Figure 8 shows the correla-tion and RMSE of areal ground rainfall observacorrela-tion stacorrela-tions (GROS) vs. MPEG, areal GROS vs. TRMM and areal GROS vs. CFSR for the major river basins of Lake Tana. Figure 9 shows the bias of satellite rainfall estimation compared with the ground observation stations.
4876 A. W. Worqlul et al.: Comparison of rainfall estimations for the Lake Tana basin in Ethiopia (a) (c) (b) 20 1 2
Figure 4a: R-Squared of MPEG, TRMM and CFSR compared with 38 Ground Rainfall 3
Observation Stations (GROS) in the Lake Tana Basin sorted according to increasing stations
4 elevation. 5 0 750 1500 2250 3000 3750 0.0 0.2 0.4 0.6 0.8 1.0 Del gi Bah irD ar De keE st ifan os Gor gor a Wo re ta Ko rata Wan
zay Yifag
M ak isegn it Wo tet Ab ay Chuah it Ad di sZe me n Gon dar M eraw i En franz Ch anc ho k Tik ilD in ga y Al em ber Yi smal a Ch and iba Amb asami e Az en a Ask un a Da ng ila Ad et Eb in at Ayke l M ek an eE ys us Sh em bek it Kessa En jib ara Gu nd il De ber eT ab or Leway e Gassay Ki mi rDi ngay Fe re seB et Ager eGen et St ati on e le va tion (m ) R-Squ ar ed
R-Square of MPEG R-Square of TRMM R-Square of CFSR MPEG average R-Square TRMM average R-Square CFSR average R-Square Station elevation
21 1
Figure 4b: RMSE of MPEG, TRMM and CFSR compared with the 38 Ground Rainfall 2
Observation Stations (GROS) in the Lake Tana Basin sorted according to increasing stations
3 elevation. 4 5 0 750 1500 2250 3000 3750 0.0 2.0 4.0 6.0 8.0 10.0 12.0 Del gi Bah irD ar De keE st ifan os Gor gor a Wo re ta Ko rata Wan
zay Yifag
M ak isegn it Wo tet Ab ay Chuah it Ad di sZe me n Gon dar M eraw i En franz Ch anc ho k Tik ilD in ga y Al em ber Yi smal a Ch and iba Amb asami e Az en a Ask un a Da ng ila Ad et Eb in at Ayke l M ek an eE ys us Sh em bek it Kessa En jib ara Gu nd il De ber eT ab or Leway e Gassay Ki mi rD in gay Fe re seB et Ager eGen et St ati on e le va tion (m ) RM SE (m m /da y)
RMSE of MPEG RMSE of TRMM RMSE of CFSR
MPEG average RMSE TRMM average RMSE CFSR average RMSE Station elevation
22 1
2
Figure 4c: Logarithm Bias of MPEG, TRMM and CFSR compared with 38 Ground Rainfall
3
Observation Stations (GROS) in the Lake Tana Basin.
4 5 -1.0 -0.8 -0.5 -0.3 0.0 0.3 0.5 0.8 Del gi Bah irD ar De keE st ifan os Gorgor a Wo re ta Ko rata Wan
zay Yifag
M ak isegn it Wo tet Ab ay Chuah it Ad di sZe me n Gon dar M eraw i En franz Ch anc ho k Tik ilD in ga y Al em ber Yi smal a Ch and iba Amb asami e Az en a Ask un a Da ng ila Ad et Eb in at Ayke l M ek an eE ys us Sh em bek it Kessa En jib ara Gu nd il De ber eT ab or Leway e Gassay Ki mi rD in gay Fe re seB et Ager eGen et Log of Bi as
Log of MPEG Bias Log of TRMM Bias
Log of CFSR Bias Log of MPEG average Bias
Figure 4. (a)R2of MPEG, TRMM and CFSR compared with 38 ground rainfall observation stations in the Lake Tana basin, sorted according to increasing station elevation. (b) RMSE of MPEG, TRMM and CFSR compared with the 38 ground rainfall observation stations in the Lake Tana basin, sorted according to increasing station elevation. (c) Logarithm bias of MPEG, TRMM and CFSR compared with 38 ground rainfall observation stations in the Lake Tana basin.
[image:6.612.134.457.65.640.2]23 1
(A) Gorgara station (B) Agre Genet station
2
Figure 5: Temporal distribution of gauged rainfall and satellite rainfall estimation from 3
Tropical Rainfall Measuring Mission's (TRMM), Multi-Sensor Precipitation Estimate-4
Geostationary (MPEG) and Climate Forecast System Reanalysis (CFSR) for Gorgara and 5
Agre Genet stations (year 2010). 6
7
0 150 300 450 600
Jan Feb Mar Ap
r
M
ay Jun Jul Aug Sep Oct
N
o
v
D
ec
R
ai
n
fa
ll
(m
m
)
GROS MPEG TRMM CFSR
0 150 300 450 600 750 900
Jan Feb Mar Ap
r
M
ay Jun Jul Aug Sep Oct
N
o
v
D
ec
R
ai
n
fa
ll
(m
m
)
GROS MPEG TRMM CFSR
Figure 5. Temporal distribution of gauged rainfall and satellite rainfall estimation from the Tropical Rainfall Measuring Mis-sion (TRMM), Multi-Sensor Precipitation Estimate–Geostationary (MPEG) and Climate Forecast System Reanalysis (CFSR) for Gor-gara and Agre Genet stations (year: 2010).
24 1
2 3
4
Figure 6: Spatial distribution of annual rainfall estimate for year 2010 from MPEG, CFSR and 5
TRMM data. 6
7
Figure 6. Spatial distribution of the annual rainfall estimates for the year 2010 from MPEG, CFSR and TRMM data.
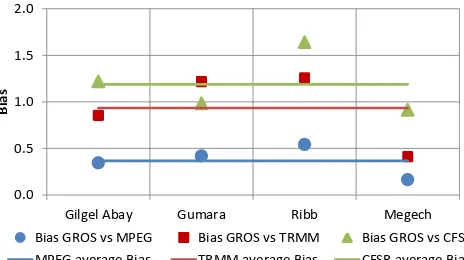
rainfall only, and the satellite observation data are average values over the grid area. The areal bias computed (Fig. 9) indicated that the MPEG rainfall consistently underestimates the observed rainfall by an average of 60 %, while the areal CFSR overestimates for Gilgel Abay and Ribb (on average by 40 %) and underestimates for Megech and Gumara (on average by 5 %). The areal RMSE of MPEG is smaller than areal CFSR estimation. The areal TRMM rainfall indicated a very smallR2and a very high RMSE. The bias for TRMM rainfall estimation is not constant; it overestimates for Gilgel Abay and Gumara by 40 and 10 %, respectively, and under-estimates for Ribb and Megech watersheds by 10 %. Thus, the consistence bias with an excellent correlation for MPEG rainfall estimate means MPEG data can be easily corrected by using a scaling factor.
4 Conclusions
This study evaluated EUMETSAT’s MPEF Multi-Sensor Precipitation Estimate–Geostationary (MPEG), Tropical Rainfall Measuring Mission (TRMM) multi-satellite pre-cipitation analysis TRMM 3B42 data version 7 and Cli-mate Forecast System Reanalysis (CFSR) rainfall estima-tion, using 38 ground rainfall observation stations in and
25 1
Figure 7: Thiessen Polygon of stations likely affected by convective rainfall in the Lake Tana
2
Basin. The green stars represent the rainfall stations likely affected by convective rainfall
3
alone.
4
Megech
Ribb
Gumara
Gilgel Abay
[image:7.612.309.543.63.364.2]Figure 7. Thiessen polygon of stations likely affected by convective rainfall in the Lake Tana basin. The green stars represent the rainfall stations likely affected by convective rainfall alone.
Figure 8.R2and RMSE of areal ground observed rainfall vs. the satellite rainfall estimate for the major river basins in Lake Tana.
[image:7.612.50.286.66.179.2] [image:7.612.49.286.263.372.2] [image:7.612.311.545.426.568.2]4878 A. W. Worqlul et al.: Comparison of rainfall estimations for the Lake Tana basin in Ethiopia
26 1
Figure 8: R-Squared and RMSE of areal ground observed rainfall versus satellite rainfall 2
estimate for the major river basins in the Lake Tana. 3
4
Figure 9: Bias of areal ground observed rainfall versus satellite rainfall estimate for the major 5
river basins in the Lake Tana. 6
7
0.0 0.3 0.5 0.8 1.0
0.0 2.5 5.0 7.5 10.0
Gilgel Abay Gumara Ribb Megech
R
-Squ
ar
e
d
R
M
SE
(m
m
/da
y)
RMSE GROS vs MPEG RMSE GROS vs TRMM RMSE GROS vs CFSR
R^2 GROS vs MPEG R^2 GROS vs TRMM R^2 GROS vs CFSR
0.0 0.5 1.0 1.5 2.0
Gilgel Abay Gumara Ribb Megech
Bi
as
Bias GROS vs MPEG Bias GROS vs TRMM Bias GROS vs CFSR
MPEG average Bias TRMM average Bias CFSR average Bias
Figure 9. Bias of areal ground observed rainfall vs. the satellite rainfall estimate for the major river basins in Lake Tana.
comparisons was better than that for the TRMM satellite rainfall amounts. Although the MPEG satellite rainfall un-derestimated consistently the ground-observed rainfall by an average of 60 %, it captured the rainfall pattern well. CFSR satellite rainfall also captured the observed rainfall pattern, but it overestimated for some and underestimated for the other stations. TRMM rainfall estimated poorly the ground rainfall observations for both point-to-grid and areal comparison.
The ground observation data indicated that 86 % of the annual rainfall occurred from June to September, and the MPEG and CFSR indicated approximately the same percent-age. The TRMM indicated that only 30 % of the annual rain-fall occurred during the rainy season of June to September. Although the TRMM 3B42 bias is adjusted with monthly gauged rainfall data and has performed well in many parts of the world (Ouma et al., 2012; Javanmard et al., 2010), such an adjustment was not made for the Ethiopian highlands, be-cause observed rainfall data were not made available to the TMPA research team (Haile et al., 2013). Based on the study period for the study area, MPEG has performed better in cap-turing the spatial and temporal patterns of observed rainfall. The result suggested that there should be a further calibration for the TRMM 3B42 rainfall product to capture the temporal variation of rainfall, and MPEG can easily be calibrated by a correction factor to capture the observed rainfall.
[image:8.612.52.284.66.196.2]Appendix A: Multi-Sensor Precipitation Estimate–Geostationary (MPEG)
The Multi-Sensor Precipitation Estimate-Geostationary (MPE-G or MPEG) is one of the products from MPEF as part of the Meteosat Second Generation (MSG) ground segment. The MPEF primary function is to generate meteo-rological products from the Level 1.5 image data supplied like those from the SEVIRI instrument onboard the MSG series of geostationary satellites by the image processing facility (IMPF; EUMETSAT, 2008). The Multi-Sensor Precipitation Estimate (MPE) is derived from the infrared data (IR data) of the EUMETSAT geo-stationary satellites by continuous re-calibration of the algorithm with rain-rate data derived from polar orbiting microwave sensors.
The algorithm is based on a combination of MSG images from the infrared IR10.8 µm channel and passive microwave data from the Special Sensor Microwave/Imager (SSM/I) in-strument on the United States Defence Meteorological Satel-lite Program (DMSP) polar satelSatel-lites. The role model for the MPE algorithm was the algorithm developed by Turk et al. (1999). The product is most suitable for convective pre-cipitation, and is intended mainly for areas with poor radar coverage (Heinemann and Kerényi, 2003). The MPEG data are available through the GEONETCast near-real-time global network of satellite-based data dissemination systems de-signed to distribute space-based, air-borne and in situ data. A ground GEONETCast reception station is established at the compound of Bahir Dar University, engineering faculty (Wale et al., 2011), in collaboration with the Tana Sub-basin Organization (TaSBO) and with the University of Twente, faculty ITC, the Netherlands. The MPEG data are available at a temporal resolution of 15 m, with a spatial resolution of 3 km for the whole field of view of MSG. The 15 m MPEG data are aggregated to daily, monthly and annual rainfall for the study area for 2010, using a daily aggregation time be-tween 00:00 and 23:45 UTC.
Appendix B: Tropical Rainfall Measuring Mission (TRMM)
TRMM, the Tropical Rainfall Measuring Mission, was launched by the H-II rocket from Tanegashima Space Cen-ter of the National Space Development Agency of Japan (NASDA) on 28 November 1997. This satellite has been de-veloped as a joint project between Japan and the US, which is the first space mission dedicated to measuring rainfall (NASDA, 2001).
TRMM works by combining both TIR and MW sensors (Dinku et al., 2011). The MW channel carefully measures the minute amounts of microwave energy emitted and scattered by the Earth and its atmospheric constituents. TRMM also operates in active radar. The TRMM satellite orbits the Earth at a 35◦inclination angle with respect to the Equator. TRMM covers an area of the Earth’s surface that extends well be-yond the tropics, covering a swath between 38◦N and 38◦S. TRMM makes these data available in both near real time and delayed-research-quality formats. The TRMM rainfall prod-uct has a spatial resolution of 0.2◦ and a temporal resolu-tion of 3 h. For this study, TRMM product 3B42 version 7 is used. The TRMM-3B42 estimates are produced in four steps (Dinku et al., 2010): (i) the PM estimates are adjusted and combined, (ii) TIR precipitation estimates are created using the PM estimates for calibration, (iii) PM and TIR estimates are combined, and (iv) the data are rescaled to monthly totals whereby gauge observations are used indirectly to adjust the satellite product. The major inputs into the 3B42 algorithm are IR data from geostationary satellites and PM data from the TRMM microwave imager (TMI), the Special Sensor Mi-crowave/Imager (SSM/I), the Advanced Microwave Sound-ing Unit (AMSU), the MHS (Microwave Humidity Sounder) and the Advanced Microwave Sounding Radiometer-Earth Observing System (AMSR-E; Ouma et al., 2012). The suc-cessor GPM was launched in February 2014 with advanced radar and passive microwave sensors, and will provide con-tinuous precipitation estimates for the next years to come.
Appendix C: Climate Forecast System Reanalysis (CFSR)
4880 A. W. Worqlul et al.: Comparison of rainfall estimations for the Lake Tana basin in Ethiopia
Acknowledgements. Abeyou Wale is a fellow of the Nor-man E. Borlaug Leadership Enhancement in Agriculture program funded by USAID. IWMI and Cornell University provided as-sistantship funds. We are grateful to the National Meteorological Agency of Ethiopia for providing daily rainfall data for multiple stations free of charge. The data providers of the Tropical Rainfall Measuring Mission (TRMM) product (3B42), Multi-Sensor Precip-itation Estimate–Geostationary (MPEG) and the Climate Forecast System Reanalysis (CFSR) are also acknowledged. Finally, the authors also acknowledge the Editor and the anonymous reviewers for their constructive comments and suggestions.
Edited by: H. Leijnse
References
Baveye, P. C.: Hydrology and the looming water crisis: It is time to think, and act, outside the box, J. Hydrol. Hydromech., 61, 89–96, 2013.
Camberlin, P.: Rainfall anomalies in the source region of the Nile and their connection with the Indian summer monsoon, J. Clim., 10, 1380–1392, 1997.
Chaubey, I., Haan, C., Grunwald, S., and Salisbury, J.: Uncertainty in the model parameters due to spatial variability of rainfall, J. Hydrol., 220, 48–61, 1999.
Creutin, J. D. and Borga, M.: Radar hydrology modifies the mon-itoring of flash-flood hazard, Hydrol. Process., 17, 1453–1456, 2003.
Dinku, T., Chidzambwa, S., Ceccato, P., Connor, S., and Ro-pelewski, C.: Validation of high-resolution satellite rainfall prod-ucts over complex terrain, Int. J. Remote Sens., 29, 4097–4110, 2008.
Dinku, T., Connor, S. J., and Ceccato, P.: Comparison of CMORPH and TRMM-3B42 over mountainous regions of Africa and South America, in: Satellite Rainfall Applications for Surface Hydrol-ogy, Springer Netherlands, 193–204, 2010.
Dinku, T., Ceccato, P., and Connor, S. J.: Challenges of satel-lite rainfall estimation over mountainous and arid parts of east Africa, Int. J. Remote Sens., 32, 5965–5979, 2011.
EUMETSAT: MSG Meteorological Products Extraction Facility Algorithm Specification Document, Darmstadt, Germany, 2008. Ferraro, R. R.: Special sensor microwave imager derived global rainfall estimates for climatological applications, J. Geophys. Res.-Atmos., 102, 16715–16735, 1997.
Haile, A. T., Rientjes, T., Gieske, A., and Gebremichael, M.: Mul-tispectral remote sensing for rainfall detection and estimation at the source of the Blue Nile River, Int. J. Appl. Earth Obs., 12, S76–S82, 2010.
Haile, A. T., Habib, E., Elsaadani, M., and Rientjes, T.: Inter-comparison of satellite rainfall products for representing rainfall diurnal cycle over the Nile basin, Int. J. Appl. Earth Obs., 21, 230–240, 2013.
Heinemann, T., Latanzio, A., and Roveda, F.: The Eumetsat multi-sensor precipitation estimate (MPE), Second International Pre-cipitation Working group (IPWG) Meeting, 23–27 September 2002, Madrid, Spain, 2002.
Heinemann, T. and Kerényi, J.: The EUMETSAT multi sensor pre-cipitation estimate (MPE): Concept and validation, EUMETSAT Users Conf., Weimar, Germany, 2003,
Huffman, G. J., Bolvin, D. T., Nelkin, E. J., Wolff, D. B., Adler, R. F., Gu, G., Hong, Y., Bowman, K. P., and Stocker, E. F.: The TRMM multisatellite precipitation analysis (TMPA): Quasi-global, multiyear, combined-sensor precipitation estimates at fine scales, J. Hydrometeorol., 8, 38–55, 2007.
Javanmard, S., Yatagai, A., Nodzu, M., BodaghJamali, J., and Kawamoto, H.: Comparing high-resolution gridded precipitation data with satellite rainfall estimates of TRMM_3B42 over Iran, Adv. Geosci., 25, 119–125, 2010,
http://www.adv-geosci.net/25/119/2010/.
Joyce, R. J., Janowiak, J. E., Arkin, P. A., and Xie, P.: CMORPH: A method that produces global precipitation estimates from passive microwave and infrared data at high spatial and temporal resolu-tion, J. Hydrometeorol., 5, 487–503, 2004.
Kaba, E., Philpot, W., and Steenhuis, T.: Evaluating suitability of MODIS-Terra images for reproducing historic sediment concen-trations in water bodies: Lake Tana, Ethiopia, Int. J. Appl. Earth Obs., 26, 286–297, 2014.
Kebede, S., Travi, Y., Alemayehu, T., and Marc, V.: Water balance of Lake Tana and its sensitivity to fluctuations in rainfall, Blue Nile basin, Ethiopia, J. Hydrol., 316, 233–247, 2006.
Kidd, C.: Satellite rainfall climatology: a review, Int. J. Climatol., 21, 1041–1066, 2001.
Kidd, C., Kniveton, D. R., Todd, M. C., and Bellerby, T. J.: Satel-lite rainfall estimation using combined passive microwave and infrared algorithms, J. Hydrometeorol., 4, 1088–1104, 2003. NASDA: TRMM Data Users Handbook, National Space
Develop-ment Agency of Japan, Japan, 2001.
Negri, A. J., Adler, R. F., and Wetzel, P. J.: Rain estimation from satellites: An examination of the Griffith-Woodley technique, J. Clim. Appl. Meteorol., 23, 102–116, 1984.
NMSA: Climatic and Agroclimatic Resources of Ethiopia, Na-tional Meteorology Service Agency of Ethiopia, Addis Ababa, Ethiopia, 137 pp., 1996.
Ouma, Y. O., Owiti, T., Kipkorir, E., Kibiiy, J., and Tateishi, R.: Multitemporal comparative analysis of TRMM-3B42 satellite-estimated rainfall with surface gauge data at basin scales: daily, decadal and monthly evaluations, Int. J. Remote Sens., 33, 7662– 7684, 2012.
Pardo-Igúzquiza, E.: Optimal selection of number and location of rainfall gauges for areal rainfall estimation using geostatistics and simulated annealing, J. Hydrol. 210, 206–220, 1998. Ramakrishna, S. and Nasreen, S. A. A. N.: An overview on
wa-ter resources: pollution and nanomawa-terials, in: Applications of Nanomaterials for Water Quality, edited by: van der Bruggen, B., Future Science, London, UK, 8–29, 2013.
Saha, S., Moorthi, S., Wu, X., Wang, J., Nadiga, S., Tripp, P., Behringer, D., Hou, Y.-T., Chuang, H.-Y., and Iredell, M.: The NCEP climate forecast system version 2, J. Clim., 27, 2185– 2208, 2014.
Seleshi, Y. and Demaree, G.: Rainfall variability in the Ethiopian and Eritrean highlands and its links with the Southern Oscillation Index, J. Biogeogr., 945–952, 1995.
Seleshi, Y. and Zanke, U.: Recent changes in rainfall and rainy days in Ethiopia, Int. J. Climatol., 24, 973–983, 2004.
Simpson, J., Adler, R. F., and North, G. R.: A proposed tropical rainfall measuring mission (TRMM) satellite, B. Am. Meteorol. Soc., 69, 278–295, 1988.
Todd, M. C., Kidd, C., Kniveton, D., and Bellerby, T. J.: A com-bined satellite infrared and passive microwave technique for esti-mation of small-scale rainfall, J. Atmos. Ocean. Tech., 18, 742– 755, 2001.
Tsidu, G. M.: High-Resolution Monthly Rainfall Database for Ethiopia: Homogenization, Reconstruction, and Gridding, J. Clim., 25, 8422–8443, 2012.
Turk, F. J., Rohaly, G. D., Hawkins, J., Smith, E. A., Marzano, F. S., Mugnai, A., and Levizzani, V.: Meteorological applications of precipitation estimation from combined SSM/I, TRMM and infrared geostationary satellite data, in: Microwave Radiometry and Remote Sensing of the Earth’s Surface and Atmosphere, edited by: Pampaloni, P. and Paloscia, S., VSP Intl. Sci. Publ, the Netherlands, 353–363, 1999.
Wale, A.: Hydrological balance of Lake Tana, M.Sc Thesis, Inter-national Institute for Geo-Information Science and Earth Obser-vation (ITC), the Netherlands, 2008.
Wale, A., Kaba, E., Mengeste, A., Workaferahu, A., Mulken, M., and Aemro, B.: Opportunities of the Low-Cost Satellite Image Reception Station, established at: GIS & RS Center of Bahir Dar University, Institute of Technology, 2nd Symposium on bio-diversity and Natural Conservation at Arba Minch University, Ethiopia, 3–5 June 2010, 2011.
Wang, W., Xie, P., Yoo, S.-H., Xue, Y., Kumar, A., and Wu, X.: An assessment of the surface climate in the NCEP climate forecast system reanalysis, Clim. Dynam., 37, 1601–1620, 2011. WMO: World Meteorological Organization, Guide to Hydrological
Practices: Data Acquisition and Processing, Analysis, Forecast-ing and other Applications, WMO-No. 168, WMO, Geneva, 770, 1994.