https://doi.org/10.5194/hess-22-4201-2018 © Author(s) 2018. This work is distributed under the Creative Commons Attribution 4.0 License.
Extending seasonal predictability of Yangtze River summer floods
Shanshan Wang1,2and Xing Yuan1
1Key Laboratory of Regional Climate-Environment for Temperate East Asia (RCE-TEA), Institute of Atmospheric Physics, Chinese Academy of Sciences, Beijing, 100029, China
2Key Laboratory of Arid Climatic Change and Reducing Disaster of Gansu Province, and Key Open Laboratory of Arid Climate Change and Disaster Reduction of CMA, Institute of Arid Meteorology, CMA, Lanzhou 730020, China Correspondence:Xing Yuan (yuanxing@tea.ac.cn)
Received: 4 March 2018 – Discussion started: 28 March 2018
Revised: 17 June 2018 – Accepted: 20 July 2018 – Published: 7 August 2018
Abstract. Extreme pluvial floods across China’s Yangtze River basin in the summer of 2016 were strongly connected with intense atmospheric moisture transport, and resulted in vast loss of properties after a strong El Niño winter. Predict-ing such extreme floods in advance is essential for hazard mitigation, but the flood forecast skill is relatively low due to the limited predictability of summer precipitation. By using a “perfect model” assumption, here we show that atmospheric moisture flux has a higher potential predictability than pre-cipitation over the Yangtze River at seasonal timescales. The predictability of precipitation and moisture flux is higher in post-El Niño summers than in post-La Niñas, especially for flooding events. As compared with extreme precipitation, the potential detectability of extreme moisture flux increases by 20 % in post-El Niño summers, which suggests that atmo-spheric moisture flux could be crucial for early warning of Yangtze River summer floods.
1 Introduction
Located in eastern China with a dense population and ma-jor agricultural and industrial productions, the Yangtze River basin suffers from frequent flooding due to large interan-nual variability of the East Asian summer monsoon. In June– July 2016, extreme pluvial floods hit the middle and lower reaches of the Yangtze River, caused severe inundations over many big cities, and resulted in a direct economic loss of RMB 70 billion (about USD 10 billion) (Yuan et al., 2018). Effective early warning of upcoming extreme flood events is urgently needed to mitigate the potential damages, which strongly depends on accurate precipitation forecasts not only
at synoptic, but also subseasonal to seasonal scales (Yang et al., 2008; Tian et al., 2017). However, predicting flood at sea-sonal timescales is still a grand challenge due to limited fore-cast skill in precipitation at long leads (Alfieri et al., 2013; Yuan et al., 2015). This raises the interest in exploring other relevant variables that are more predictable than precipitation for flood early warning.
precipitation predictability relation also applies in China’s monsoonal summer seasons where convection is active, such as the Yangtze River summer flood, is still unclear.
The middle and lower reaches of the Yangtze River basin in eastern China form one of the most strongly El Niño– Southern Oscillation (ENSO)-affected regions in the world (e.g., Wang et al., 2000; Wu et al., 2003; Ding and Chan, 2005). The persistent sea surface temperature (SST) anoma-lies in the equatorial eastern Pacific can alter the tropical and subtropical circulations via local air–sea interaction and/or teleconnections, and thus affect the East Asia summer cli-mate significantly, including the summer precipitation in the Yangtze region. Such an ENSO-related climate anomaly in the Yangtze region is not concurrent with the ENSO cycle, but has a seasonal lag. A possible mechanism for this lag impact of ENSO on East Asia summer climate is the Indo-western Pacific Ocean capacitor (IPOC), where the North In-dian Ocean warming after El Niño plays a crucial role (e.g., Xie et al., 2016). Therefore, the precipitation predictability over the Yangtze River is closely associated with the atmo-spheric and oceanic conditions, which is similar to other re-gions (Gershunov, 1998; Kumar and Hoerling, 1998; Lavers et al., 2016a). For instance, Kumar and Hoerling (1998) in-dicated that the North American climate is most predictable during the late winter and early spring seasons of the warm ENSO events. Lavers et al. (2016a) showed that the moisture flux and extreme precipitation have different prediction skill during different North Atlantic Oscillation (NAO) phases. In short, the weather or climate forecasts initialized at differ-ent atmospheric/oceanic conditions can have varying levels of predictability, so understanding how the Yangtze River rainfall predictability varies during different ENSO phases is also a concern.
In the present study, we aim to address the above ques-tions by evaluating the seasonal predictability of precipita-tion and moisture flux for the middle and lower reaches of the Yangtze River (110–123◦E, 27–34◦N) based on multi-source observational data, ensemble hindcasts, and real-time forecasts from a dynamical seasonal forecast model – Cli-mate Forecast System version 2 (CFSv2; Saha et al., 2014) – for the period of 1982–2016.
2 Data and method
2.1 Observation and reanalysis data
Monthly mean precipitation data at 1◦×1◦ resolution over the Yangtze River basin were obtained from NOAA’s pre-cipitation reconstruction over land (PREC/L), which agrees well with gauge-based datasets (Chen et al., 2002). Monthly mean atmospheric fields including geopotential height, u -wind,v-wind, and specific humidity at 300, 400, 500, 700, 850, 925, and 1000 hPa were derived from the ERA-Interim reanalysis (Dee et al., 2011). Herein, the mean June–July
zonal and meridional atmospheric moisture fluxes between 300 and 1000 hPa were calculated separately, and their mag-nitudes were combined as the total moisture flux (Lavers et al., 2016a).
The NINO3.4 (5◦S–5◦N, 120–170◦W) SST anomaly based on ERSSTv4 monthly data (Huang et al., 2016) dur-ing 1948–2016 was used to analyze the impact of ENSO on the seasonal predictability of rainfall and moisture flux over the Yangtze River. An ENSO event was defined as the averaged NINO3.4 SST anomaly during the preceding December–January–February (DJF), exceeding its 0.5 stan-dard deviation (σ ).
2.2 CFSv2 seasonal hindcast and real-time forecast data
The ensemble hindcast and real-time forecast datasets in-cluding the monthly specific humidity and wind field at dif-ferent levels and monthly precipitation from Climate Fore-cast System version 2 (CFSv2) (Saha et al., 2014) were used here to quantify the potential predictability. The predicted moisture flux was calculated in the same way as the obser-vation mentioned in Sect. 2.1. CFSv2 has 24 ensemble mem-bers with different initial conditions (Yuan et al., 2011) and has been widely used for subseasonal to seasonal forecast-ing (e.g., Kirtman et al., 2014; Yuan et al., 2015; Tian et al., 2017). All monthly anomalies were calculated based on the climatology from the entire hindcast period (1982–2010). The 0.5-month lead forecast ensembles started from mid-May to early June (Saha et al., 2014) and predicted through June–July. Similarly, the 1.5-month lead forecasts for June– July started from the middle of April, and so on.
In order to investigate the predictability at finer temporal resolution (e.g., weekly mean fields), the CFSv2 daily refore-casts were also obtained from the Subseasonal to Seasonal (S2S) prediction project for the period of 1999–2010, with the forecast lead times up to 45 days (Vitart et al., 2017). As for the 1–7 June weekly mean fields, the reforecasts started from 18 May were used as the first ensemble member, the re-forecasts started from 19 May were used as the second, and so on. This resulted in 14 ensemble members, with forecast lead times from 1 to 14 days. The above process was repeated for other weekly averaged fields during June and July. This is called the first group of ensemble subseasonal forecasts, with lead times of 1–14 days. The second group of ensemble reforecasts starting from 17, 18 . . . , and 30 May were formed similarly, with lead times of 2–15 days, and so on.
2.3 The potential predictability approach
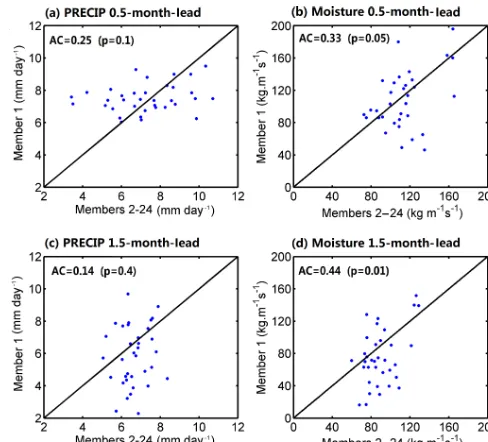
Yangtze River basin (110–123◦E, 27–34◦N) at a given lead time, ensemble member 1 was considered the observation and the average of members 2–24 was taken as the pre-diction, which resulted in two time series with 35 years of record (1982–2016). The skill of this forecast was then cal-culated by using the anomaly correlation (AC; Becker et al., 2013) between these two time series, which is defined as AC=
P
X0Y0
[P
(X0)2(Y0)2]1/2, whereX
0is the “observed” precipita-tion/moisture flux anomaly andY0is the predicted counter-parts. Here, the 95 % (90 %) significance level is 0.33 (0.22) for AC according to a two-tailed Student’s t-test. Figure 1 gives an example of the potential predictability calculation at a grid near Wuhan, where ensemble member 1 was taken as the truth and the mean of members 2–24 was the prediction. The result shows that moisture flux has a higher predictability (AC) than precipitation at 0.5- and 1.5-month leads for mem-ber 1. This method was repeated 24 times, with each memmem-ber being considered the observation, so as to obtain 24 AC val-ues; the average of these 24 values was the final estimate of the potential predictability. In addition to the calculation for individual grid cells, the AC value was also calculated by us-ing both spatial and temporal samples for the Yangtze River basin with 72 CFSv2 grid cells. Here, an AC higher than 0.05 would be considered significant at the 95 % confidence level, both for ENSO events and the entire period. The rationale for this “perfect model” approach is that the statistical character-istics of the “observation” (one of the ensemble members) and the prediction (ensemble mean of the remaining mem-bers) are the same, so the estimate of potential predictability is not affected by model biases (Koster et al., 2004; Kumar et al., 2014).
In addition, the hit rate (HR) was also used to assess the seasonal predictability for extreme hydrologic events (Ma et al., 2015), where the flooding condition was defined as the June–July mean precipitation or moisture flux greater than the 90th percentile of their climatology. Here, a forecast for the flooding event can be counted at a given grid or region when taking ensemble member 1 as the observation and the average of members 2–24 as the prediction: the HR was com-puted as HR= a
a+c, wherearepresents the number of events
where flooding is forecast and observed andcis for observed flooding that is not forecast. Similar to the AC calculation, 24 HR values would be obtained when each member was considered as the observation, and their average HR value was the final potential predictability for extreme hydrologic events.
3 Results
3.1 Yangtze River 2016 pluvial flood and its associated atmospheric circulation
[image:3.612.307.551.64.285.2]Figure 2a shows the spatial distribution of the June– July 2016 mean rainfall anomaly. Extreme pluvial flooding
Figure 1.An example of the potential predictability calculation, where ensemble member 1 is the truth and the mean of members 2–24 is the prediction. This is for 116◦E and 28◦N near to Wuhan at(a–b)the 0.5-month lead and(c–d)the 1.5-month lead.
hit the middle and lower reaches of the Yangtze River, where the area-averaged precipitation increased by about 40 % rel-ative to the climatology. In particular, continuous heavy rain-fall hit the Yangtze River basin, with rainrain-fall anomalies lo-cally exceeding 300 mm within 10 days (26 June–5 July; Yuan et al., 2018). Figure 2b shows that the June–July mean precipitation averaged over the Yangtze River basin ranks second only to the 1954 flood during the period 1948–2016, and is even heavier than the 1998 flood.
Figure 2.The 2016 extreme summer flood.(a)Mean precipitation anomaly (shading, mm day−1) during June–July 2016.(b)Time series of the June–July mean precipitation anomaly averaged over the middle and lower reaches of the Yangtze River basin (110–123◦E, 27– 34◦N) in(a).(c)Anomaly of 500 hPa geopotential height (shading, gpm) superimposed by absolute integrated horizontal moisture transport between the 1000 and 300 hPa layers (vectors, kg m−1s−1). The thick contour lines are 5880 gpm, implying the location of the West Pacific Subtropical High, where the black denotes June–July 2016 and the cyan is the climatology during 1982–2010.(d)Anomaly of the integrated horizontal moisture transport amount (shading, kg m−1s−1).
River (Fig. 2c). As a result, there was a significantly anoma-lous moisture band in the east–west direction characterized by the largest moisture transport amount in the middle and lower reaches of the Yangtze River, which was directly re-sponsible for the 2016 summer flood (Fig. 2d).
3.2 Seasonal predictability of precipitation and moisture flux
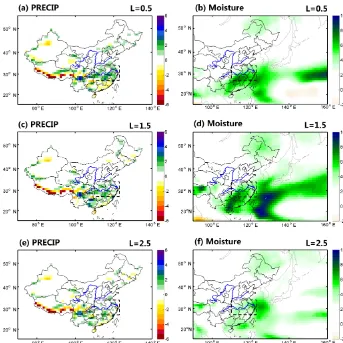
Considering the association between intense moisture flux and heavy rainfall over the Yangtze River basin, which is known within the canonical East Asian monsoon region (Ding and Chan, 2005), testing whether atmospheric mois-ture flux is more predictable than precipitation at the sea-sonal timescale is helpful for flood control and disaster relief. Figure 3 shows the predictions for June–July mean anoma-lies of precipitation and corresponding moisture flux from the CFSv2 dynamical climate forecast model for the 2016 summer flood at the first 3-month leads. As compared with the observed precipitation, CFSv2 successfully captured the rainfall surplus across the middle and lower reaches of the Yangtze River at a 0.5-month lead (Fig. 3a), and predicted a visible moisture transport band along the middle and lower reaches of the Yangtze River (Fig. 3b). The highest moisture flux anomaly occurred over the southern bank of the Yangtze River, which corresponded exactly to the location of heavy precipitation and flood. At a 1.5-month lead, CFSv2 still per-formed well for the anomalous moisture flux, but the pre-dicted precipitation anomaly was much weaker than that at
the 0.5-month lead (Fig. 3c–d). At the 2.5-month lead, the prediction skill of precipitation significantly weakened with almost no anomaly (Fig. 3e), but the predicted moisture flux could reproduce the anomaly to some extent (Fig. 3f).
Figure 3.Spatial distributions of CFSv2 predicted anomalies of precipitation (shading, mm day−1) and atmospheric moisture flux (shading, kg m−1s−1) in June–July 2016 at the 0.5-, 1.5- and 2.5-month leads, where the 0.5-month lead was initialized from mid-May to early June, the 1.5-month lead was initialized from mid-April to early May, and so on.
Figure 4g indicates the corresponding spread for precipi-tation and moisture flux predictability throughout the middle and lower reaches of the Yangtze River region (110–123◦E, 27–34◦N). The median (mean) value for precipitation is 0.25 (0.23) at the 0.5-month lead, but reaches 0.37 (0.35) for mois-ture flux. At the 2.5-month lead, the median (mean) value for moisture flux is 0.25 (0.24), which is much higher than the value of 0.18 (0.16) for precipitation. The changes in poten-tial predictability with different forecast leads are also dis-played in Fig. 4h, based on both spatial and temporal samples for the Yangtze River basin. The difference between precip-itation and moisture flux is statistically significant (p<0.05) with a two-tailed Student’st-test. It is evident that moisture flux has consistently higher predictability than precipitation out to an 8.5-month lead. A similar result is also found at the location (30◦N, 114◦E) near Wuhan (Fig. 4i), one of the big cities along the Yangtze River, which suffered widespread inundation in the summer of 2016.
3.3 Varying predictability conditioned on different ENSO phases
sum-Figure 4. (a–f)Potential predictability (AC value; see “Method”) for June–July mean precipitation and atmospheric moisture flux at different lead times during 1982–2016 over the middle and lower reaches of the Yangtze River for the 0.5-, 1.5-, and 2.5-month leads; the stippling indicates a 95 % confidence level according to a two-tailed Student’st-test.(g)Median, lower, and upper quartiles, 1.5 times the interquartile ranges for AC values for precipitation (black) and moisture (red) throughout the study region (110–123◦E, 27–34◦N); outliers are displayed with+signs.(h–i)Potential predictability throughout the study region and Wuhan (pink pentagram ina) at different lead times; the error bars are standard deviations according to 24 members.
Figure 5. (a–b) Spatial and (c) temporal patterns of the second modes based on the maximum covariance analysis (MCA) for SST in the preceding winter (December–January–February) and the pre-cipitation field in summer (June–July) for 1948–2016. Here the sec-ond MCA mode explains 23 % of the variance, as indicated in the square fraction of covariance (SFC).
mer precipitation in the Yangtze region is significantly above normal (Fig. 5b). Therefore, the Yangtze region is prone to experiencing a rainy or flooding summer if the SST over the eastern tropical Pacific is warmer than normal in the preced-ing winter based on the covariance analysis durpreced-ing the period 1948–2016; whether the predictability varies during different ENSO phases should be investigated.
[image:6.612.137.462.66.381.2] [image:6.612.69.265.482.645.2]Figure 6.Potential predictability at different lead times in terms of(a)anomaly correlation (AC) for precipitation and moisture, and(b)hit rate (HR) for flood events (> 90th percentiles) across the Yangtze River region conditioned on ENSO phases.(c–d)Composites of pre-dicted anomalies of 500 hPa geopotential height (contour, gpm) superimposed by 850 hPa wind (vectors, m s−1) and moisture flux (shading, g cm−1hPa−1s−1) at the 0.5-month lead during different ENSO phases.(e–f)The same as(c–d), but for a 6.5-month lead time.
atmospheric response to the tropical Pacific SST anomaly is inherently nonlinear (Hoerling et al., 1997), where both the amplitude of the SST anomaly in the equatorial eastern Pacific and the associated atmospheric response are signifi-cantly larger during El Niño than during La Niña episodes (Burgers and Stephenson, 1999). Figure 6 also shows that the predictability is high conditional on El Niños even out to a 6.5-month lead, which is consistent with previous stud-ies. For instance, Sooraj et al. (2012) have mentioned that forecasting seasonal rainfall anomalies over central tropi-cal Pacific islands from El Niño winter into the following spring/summer is skillful by using CFS, and Ma et al. (2015) have demonstrated high predictability for seasonal drought over ENSO-affected regimes in southern China. The excep-tion for 3.5-month lead forecast (started in March) where the predictability conditioned on La Niña is slightly higher than El Niño (Fig. 6a) is perhaps related to the “spring predictabil-ity barrier”, but such chaos disappears for extreme events (Fig. 6b).
Figure 7. (a–f)Potential predictability (AC value) for weekly mean precipitation and atmospheric moisture flux at different lead times during June–July of 1999–2010 over the middle and lower reaches of the Yangtze River for the 1–14-, 5–18-, and 8–21-day leads; the stippling indicates a 95 % confidence level according to a two-tailed Student’st-test.(g)Potential predictability throughout the study region at different lead times.
to a low-pressure anomaly in the next summer, accompa-nied by an abnormal cyclonic circulation, and thereby pre-venting the moisture from moving northwards to the Yangtze region (Fig. 6d). It implies that the precipitation deficits or droughts are more likely to occur in this region in post-La Niña summers. The contrast is obvious even for forecasts for 6.5-month leads (Fig. 6e–f). The differences in predicted cir-culation and associated moisture transport largely result in higher predictability for extreme hydrologic events over the middle and lower reaches of the Yangtze River basin in post-El Niño summers (Hu et al., 2014).
4 Summary and discussion
Previous studies have revealed that moisture flux has higher predictability than precipitation in weather forecasts over
[image:8.612.150.449.64.446.2]initialized in warm ENSO conditions, not only for precipita-tion, but also for moisture flux. More importantly, the mois-ture flux shows a higher detectability (hit rate) than precipi-tation for extreme pluvial flooding events following El Niño winters. The results suggest that it may be possible to extend the predictability of Yangtze River summer floods and to pro-vide more reliable early warning by using atmospheric ture flux predictions. However, the degree to which mois-ture flux is connected with precipitation and floods might be model dependent. It is necessary to explore their connections in a multi-model framework (e.g., NMME; Kirtman et al., 2014; Shukla et al., 2016).
This study extends previous findings on the predictability of precipitation and moisture flux at synoptic scales (Lavers et al., 2014) to seasonal timescales, and from atmospheric river-affected regions to the East Asian summer monsoon re-gion. Given that the transport of atmospheric moisture from oceanic source regions is important for extreme rainfall in monsoon regions (Gimeno et al., 2012), moisture flux might also be useful for long-range forecasting over other areas af-fected by the monsoon and low-level jets. In fact, extreme precipitation and floods are found to be associated with large-scale moisture transport over the North American monsoon (Schmitz and Mullen, 1996) and South American monsoon (Carvalho et al., 2011) regions. Extreme precipitation and floods usually occur accompanied by intensive atmospheric moisture transport, especially over a large area such as the middle and lower reaches of the Yangtze River. Given higher predictability of atmospheric moisture flux, it can be used as a precursor for flooding forecasting, either directly link-ing moisture flux to streamflow prediction through statis-tical techniques (e.g., conditional distribution or Bayesian methods), or adding moisture flux information into precip-itation prediction, and consequently improving flood predic-tion. Moreover, it is suggested that assimilating moisture flux observations into numerical climate forecast models would benefit the prediction of hydrological extremes.
The higher moisture flux predictability largely arises from more predictable large-scale circulation (Li et al., 2016), which strongly determines the atmospheric moisture trans-port. Although precipitation variability is affected by both large-scale moisture transport and localized processes and features, such as condensation nuclei in the atmosphere and lifting movement, it is expected that moisture transport could still be used as a crucial source of predictability for flooding over monsoonal regimes, especially at long leads where meso-scale convection is still unpredictable at sea-sonal timescales.
Data availability. Monthly mean precipitation were obtained from NOAA’s precipitation reconstruction over land (PREC/L, https: //www.esrl.noaa.gov/psd/data/gridded/data.precl.html; Chen et al., 2002); the ERA-Interim reanalysis monthly products were down-loaded from the ERA-Interim website: http://www.ecmwf.int/
en/research/climate-reanalysis/era-interim (Dee et al., 2011); the NINO3.4 SST anomaly based on ERSSTv4 monthly data was ob-tained from the KNMI Climate Explorer website: http://climexp. knmi.nl/selectindex.cgi?id=someone@somewhere (Huang et al., 2016); the ensemble hindcast and real-time forecast datasets from Climate Forecast System version 2 (CFSv2) are available from the IRI Data Library website: http://iridl.ldeo.columbia.edu/ SOURCES/.NOAA/.NCEP/.EMC/.CFSv2/ (Saha et al., 2014). The CFSv2 daily reforecasts are available from the Subseasonal to Seasonal (S2S) prediction project website: http://apps.ecmwf.int/ datasets/data/s2s/levtype=sfc/type=cf/ (Vitart et al., 2017). All these data’s last access was 29 July 2018.
Author contributions. XY conceived and designed the study. SW performed the analyses and wrote the paper. XY revised the paper.
Competing interests. The authors declare that they have no conflict of interest.
Acknowledgements. This work was supported by the National Natural Science Foundation of China (91547103, 41605055, 41630426). The authors thank Arun Kumar for helpful discussions. The authors acknowledge NCEP/EMC and IRI (http://iridl.ldeo. columbia.edu/SOURCES/.NOAA/.NCEP/.EMC/.CFSv2/, last access: 29 July 2018) for making the CFSv2 hindcast and real-time forecast information available. We are also grateful for the con-structive comments from three anonymous reviewers that improved the quality of this paper.
Edited by: Shraddhanand Shukla Reviewed by: three anonymous referees
References
Alfieri, L., Burek, P., Dutra, E., Krzeminski, B., Muraro, D., Thie-len, J., and Pappenberger, F.: GloFAS – global ensemble stream-flow forecasting and flood early warning, Hydrol. Earth Syst. Sci., 17, 1161–1175, https://doi.org/10.5194/hess-17-1161-2013, 2013.
Banacos, P. C. and Schultz, D. M.: The use of moisture flux conver-gence in forecasting convective initiation: Historical and opera-tional perspectives, Weather Forecast., 20, 351–366, 2005. Barnston, A. G., Tippett, M. K., L’Heureux, M. L., Li, S., and
De-Witt, D. G.: Skill of real-time seasonal ENSO model predic-tions during 2002–11: Is our capability increasing?, B. Am. Me-teorol. Soc., 93, 631–651, https://doi.org/10.1175/BAMS-D-11-00111.1, 2012.
Becker, E. J., van den Dool, H. M., and Pena, M.: Short-termclimate extremes: Prediction skill and predictability, J. Climate, 26, 512– 531, https://doi.org/10.1175/JCLI-D-12-00177.1, 2013. Boer, G. J., Kharin, V. V., and Merryfield, W. J.: Decadal
pre-dictability and forecast skill, Clim. Dynam., 41, 1817–1833, https://doi.org/10.1007/s00382-013-1705-0, 2013.
cli-mate data, J. Clicli-mate, 5, 541–560, https://doi.org/10.1175/1520-0442(1992)005<0541:AIOMFF>2.0.CO;2, 1992.
Burgers, G. and Stephenson, D. B.: The “normality” of El Niño, Geophys. Res. Lett., 26, 1027–1030, https://doi.org/10.1029/1999GL900161, 1999.
Carvalho, L. M. V., Silva, A. E., Jones, C., Liebmann, B., Silva Dias, P. L., and Rocha, H. R.: Moisture transport and intraseasonal variability in the South America Monsoon system, Clim. Dy-nam., 46, 1865–1880, https://doi.org/10.1007/s00382-010-0806-2, 2011.
Chen, M., Xie, P., Janowiak, J. E., and Arkin, P. A.: Global Land Precipitation: A 50-yr Monthly Anal-ysis Based on Gauge Observations, J. Hydrome-teorol., 3, 249–266, https://doi.org/10.1175/1525-7541(2002)003<0249:GLPAYM>2.0.CO;2, 2002.
Dee, D. P., Uppala, S. M., Simmons, A. J., Berrisford, P., Poli, P., Kobayashi, S., Andrae, U., Balmaseda, M. A., Balsamo, G., Bauer, P., Bechtold, P., Beljaars, A. C. M., van de Berg, L., Bid-lot, J., Bormann, N., Delsol, C., Dragani, R., Fuentes, M., Geer, A. J., Haimberger, L., Healy, S. B., Hersbach, H., Hólm, E. V., Isaksen, L., Kållberg, P., Köhler, M., Matricardi, M., McNally, A. P., Monge-Sanz, B. M., Morcrette, J.-J., Park, B.-K., Peubey, C., de Rosnay, P., Tavolato, C., Thépaut, J.-N., and Vitart, F.: The ERA-Interim reanalysis: Configuration and performance of the data assimilation system, Q. J. Roy. Meteor. Soc., 137, 553–597, https://doi.org/10.1002/qj.828, 2011.
Ding, Y. H. and Chan, J. C. L.: The East Asian summer monsoon: An overview, Meteor. Atmos. Phys., 89, 117–142, https://doi.org/10.1007/s00703-005-0125-z, 2005.
Gershunov, A.: ENSO influence on intraseasonal extreme rainfall and temperature frequencies in the contiguous United States: Implications for long-range predictability, J. Climate, 11, 3192–3203, https://doi.org/10.1175/1520-0442(1998)011<3192:EIOIER>2.0.CO;2, 1998.
Gimeno, L., Stohl, A., Trigo, R. M., Dominguez, F., Yoshimura, K., Yu, L., Drumond, A., Durán-Quesada, A. M., and Nieto, R.: Oceanic and terrestrial sources of continental precipitation, Rev. Geophys., 50, RG4003, https://doi.org/10.1029/2012RG000389, 2012.
Hoerling, M. P., Kumar, A., and Zhong, M.: El Niño, La Niña, and the nonlinearity of their teleconnections, J. Climate, 10, 1769– 1786, 1997.
Hu, Z.-Z., Kumar, A., Huang, B., Zhu, J., and Guan, Y.: Prediction Skill of North Pacific Variability in NCEP Climate Forecast Sys-tem, J. Climate, 27, 4263–4272, https://doi.org/10.1175/JCLI-D-13-00633.1, 2014.
Huang, B., Thorne, P., Smith, T., Liu, W., Lawrimore, J., Banzon, V., Zhang, H., Peterson, T., and Menne, M.: Further Exploring and Quantifying Uncertainties for Extended Reconstructed Sea Surface Temperature (ERSST) Version 4 (v4), J. Climate, 29, 3119–3142, https://doi.org/10.1175/JCLI-D-15-0430.1, 2016. Huang, R., Chen, J., and Huang, G.: Characteristics and variations
of the East Asian monsoon system and its impacts on climate disasters in China, Adv. Atmos. Sci., 24, 993–1023, 2007. Kirtman, B. P., Min, D., Infanti, J. M., Kinter, J. L., Paolino, D.
A., Zhang, Q., van den Dool, H., Saha, S., Mendez, M. P., Becker, E., Peng, P., Tripp, P., Huang, J., DeWitt, D. G., Tip-pett, M. K., Barnston, A. G., Li, S., Rosati, A., Schubert, S. D., Rienecker, M., Suarez, M., Li, Z. E., Marshak, J., Lim,
Y.-K., Tribbia, J., Pegion, Y.-K., Merryfield, W. J., Denis, B., and Wood, E. F.: The North American multimodel ensemble: phase-1 seasonal-to-interannual prediction; phase-2 toward developing intraseasonal prediction, Bull. Am. Meteorol. Soc., 95, 585–601, https://doi.org/10.1175/BAMS-D-12-00050.1, 2014.
Koster, R. D., Suarez, M. J., and Heiser, M.: Variance and pre-dictability of precipitation at seasonal-to-interannual timescales, J. Hydrometeorol., 1, 26–46, https://doi.org/10.1175/1525-7541(2000)001<0026:VAPOPA>2.0.CO;2, 2000.
Koster, R. D., Suarez, M. J., Liu, P., Jambor, U., Berg, A., Kistler, M., Reichle, R., Rodell, M., and Famiglietti, J.: Re-alistic initialization of land surface states: Impact on sub-seasonal forecast skill, J. Hydrometeorol., 5, 1049–1063, https://doi.org/10.1175/JHM-387.1, 2004.
Kumar, A. and Hoerling, M. P.: Annual cycle of Pacific–North American seasonal predictability as-sociated with different phases of ENSO, J. Cli-mate, 11, 3295–3308, https://doi.org/10.1175/1520-0442(1998)011<3295:ACOPNA>2.0.CO;2, 1998.
Kumar, A., Peng, P., and Chen, M.: Is there a relationship between potential and actual skill?, Mon. Weather Rev., 142, 2220–2227, https://doi.org/10.1175/MWR-D-13-00287.1, 2014.
Lau, K. M. and Weng, H.: Coherent modes of global SST and summer rainfall over China: An assessment of the regional impacts of the 1997–98 El Nino, J. Climate, 14, 1294–1308, https://doi.org/10.1175/1520-0442(2001)014<1294:CMOGSA>2.0.CO;2, 2001.
Lavers, D. A., Pappenberger, F., and Zsoter, E.: Extending medium-range predictability of extreme hydrological events in Europe, Nat. Commun., 5, 5382, https://doi.org/10.1038/ncomms6382, 2014.
Lavers, D. A., Pappenberger, F., Richardson, D. S., and Zsoter, E.: ECMWF Extreme Forecast Index for water va-por transva-port: A forecast tool for atmospheric rivers and ex-treme precipitation, Geophys. Res. Lett., 43, 11852–11858, https://doi.org/10.1002/2016GL071320, 2016a.
Lavers, D. A., Waliser, D. E., Ralph, F. M., and Dettinger, M. D.: Predictability of horizontal water vapor transport relative to pre-cipitation: Enhancing situational awareness for forecasting west-ern U.S. extreme precipitation and flooding, Geophys. Res. Lett., 43, 2275–2282, https://doi.org/10.1002/2016GL067765, 2016b. L’Heureux, M. L., Takahashi, K., Watkins, A. B.,
Barn-ston, A. G., Becker, E. J., Di Liberto, T. E., Gamble, F., Gottschalck, J., Halpert, M. S., Huang, B., Mosquera-Vásquez, K., and Wittenberg, A. T.: Observing and Predicting the 2015/2016 El Niño, B. Am. Meteorol. Soc., 98, 1363–1382, https://doi.org/10.1175/BAMS-D-16-0009.1, 2017.
Li, C. F., Scaife, A., and Lu, R. Y.: Skillful seasonal prediction of Yangtze river valley summer rainfall, Environ. Res. Lett., 11, 094002, https://doi.org/10.1088/1748-9326/11/9/094002, 2016. Luo, L. and Wood, E. F.: Assessing the idealized
predictabil-ity of precipitation and temperature in the NCEP Cli-mate Forecast System, Geophys. Res. Lett., 33, L04708, https://doi.org/10.1029/2005GL025292, 2006.
Ma, F., Yuan, X., and Ye, A.: Seasonal drought predictability and forecast skill over China, J. Geophys. Res.-Atmos., 120, 8264– 8275, https://doi.org/10.1002/2015JD023185, 2015.
Russian River: Role of atmospheric rivers, Geophys. Res. Lett., 33, L13801, https://doi.org/10.1029/2006GL026689, 2006. Saha, S., Moorthi, S., Wu, X., Wang, J., Nadiga, S., Tripp, P.,
Behringer, D., Hou, Y.-T., Chuang H.-Y., Iredell, M., Ek, M., Meng, J., Yang, R., van den Dool, H., Zhang, Q., Wang, W., Chen, M., and Becker E.: The NCEP climate forecast system ver-sion 2, J. Climate, 27, 2185–2208, https://doi.org/10.1175/JCLI-D-12-00823.1, 2014.
Schmitz, J. T. and Mullen, S. L.: Water vapor trans-portassociated with the summertime North Ameri-can Monsoon as depicted by ECMWF analyses, J. Climate, 9, 1621–1634, https://doi.org/10.1175/1520-0442(1996)009<1621:WVTAWT>2.0.CO;2, 1996.
Shukla, S., Roberts, J., Hoell, A., Funk, C. C., Robertson, F., and Kirtman, B.: Assessing North American multimodel ensemble (NMME) seasonal forecast skill to assist in the early warn-ing of anomalous hydrometeorological events over East Africa, Clim. Dynam., 1–17, https://doi.org/10.1007/s00382-016-3296-z, 2016.
Sooraj, K. P., Annamalai, H., Kumar, A., and Wang, H.: A Compre-hensive Assessment of CFS Seasonal Forecasts over the Tropics, Weather Forecast., 27, 3–27, https://doi.org/10.1175/WAF-D-11-00014.1, 2012.
Tian, D., Wood, E. F., and Yuan, X.: CFSv2-based sub-seasonal precipitation and temperature forecast skill over the contigu-ous United States, Hydrol. Earth Syst. Sci., 21, 1477–1490, https://doi.org/10.5194/hess-21-1477-2017, 2017.
Vitart, F., Ardilouze, C., Bonet, A., Brookshaw, A., Chen, M., Codorean, C., Déqué, M., Ferranti, L., Fucile, E., Fuentes, M., Hendon, H., Hendon, H., Hodgson, J., Kang, H.-S., Kumar, A., Lin, H., Liu, G., Liu, X., Malguzzi, P., Mallas I., Manoussakis, M., Mastrangelo, D., MacLachlan, C., McLean, P., Minami, A., Mladek, R., Nakazawa„ T. , Najm, S., Nie, Y., Rixen, M., Robert-son, A.W., Ruti, P., Sun, C. Takaya, Y., Tolstykh, M., Venuti, F. Waliser, D., Woolnough, S., Wu, T., Won, D.-J., Xiao, H., Zaripov, R., and Zhang, L.: The Subseasonal to Seasonal (S2S) prediction project database, B. Am. Meteorol. Soc., 98, 163–173, https://doi.org/10.1175/BAMS-D-16-0017.1, 2017.
Wang, B., Wu, R., and Fu, X.: Pacific-East Asian tele-connection: How does ENSO affect the East Asian cli-mate?, J. Climate, 13, 1517–1536, https://doi.org/10.1175/1520-0442(2000)013<1517:PEATHD>2.0.CO;2, 2000.
Wang, S., Huang, J., He, Y., and Guan, Y. P.: Combined effects of the Pacific decadal oscillation and El Nino-southern oscil-lation on global land dry–wet changes, Sci. Rep., 4, 6651, https://doi.org/10.1038/srep06651, 2014.
Wu, R., Hu, Z.-Z., and Kirtman, B. P.: Evolution of ENSO-related rainfall anomalies in East Asia, J. Cli-mate, 16, 3741–3757, https://doi.org/10.1175/1520-0442(2003)016<3742:EOERAI>2.0.CO;2, 2003.
Xie, S. P., Kosaka, Y., Du, Y., Hu, K., Chowdary, J. S., and Huang, G.: Indo-Western Pacific Ocean capacitor and coherent climate anomalies in post-ENSO summer: A review, Adv. Atmos. Sci., 33, 411–432, https://doi.org/10.1007/s00376-015-5192-6, 2016. Yang, S., Zhang, Z., Kousky, V. E., Higgins, R. W., Yoo, S. H., Liang, J., and Fan, Y.: Simulations and seasonal prediction of the Asian summer monsoon in the NCEP Climate Forecast System, J. Climate, 21, 3755–3775, https://doi.org/10.1175/2008JCLI1961.1, 2008.
Yuan, X., Wood, E. F., Luo, L., and Pan, M.: A first look at Climate Forecast System version 2 (CFSv2) for hydro-logical seasonal prediction, Geophys. Res. Lett., 38, L13402, https://doi.org/10.1029/2011GL047792, 2011.
Yuan, X., Roundy, J. K., Wood, E. F., and Sheffiled, J.: Sea-sonal forecasting of global hydrologic extremes: system devel-opment and evaluation over GEWEX basins, Bull. Am. Meteo-rol. Soc., 96, 1895–1912, https://doi.org/10.1175/BAMS-D-14-00003.1, 2015.
Yuan, X., Wang, S., and Hu, Z.-Z.: Do climate change and El Niño increase likelihood of Yangtze River extreme rainfall?, Bull. Am. Meteorol. Soc., 99, S113–S117, https://doi.org/10.1175/BAMS-D-17-0089.1, 2018.