ScholarWorks @ Georgia State University
ScholarWorks @ Georgia State University
Psychology Theses Department of Psychology
Summer 5-2-2012
Language Profile and Performances on Math Assessments for
Language Profile and Performances on Math Assessments for
Children with Mild Intellectual Disabilities
Children with Mild Intellectual Disabilities
Katherine T. Rhodes
Georgia State University
Follow this and additional works at: https://scholarworks.gsu.edu/psych_theses
Recommended Citation Recommended Citation
Rhodes, Katherine T., "Language Profile and Performances on Math Assessments for Children with Mild Intellectual Disabilities." Thesis, Georgia State University, 2012.
https://scholarworks.gsu.edu/psych_theses/98
LANGUAGE PROFILE AND PERFORMANCES ON MATH ASSESSMENTS FOR
CHILDREN WITH MILD INTELLECTUAL DISABILITIES
by
KATHERINE T. RHODES
Under the Direction of Rose A. Sevcik ABSTRACT
It has been assumed that mathematics testing indicates the development of mathematics
concepts, but the linguistic demands of assessment have not been evaluated, especially for children with mild intellectual disabilities. 244 children (grades 2 – 5) were recruited from a
larger reading intervention study. Using a multilevel longitudinal SEM model, baseline and post-intervention time points were examined for the contribution of item linguistic complexity, child language skills, and their potential interaction in predicting item level mathematics assessment
performance. Item linguistic complexity was an important, stable, and negative predictor of mathematics achievement with children’s language skills significantly and positively predicting
mathematics achievement. The interaction between item linguistic complexity and language skills was significant though not stable across time. Following intervention, children with higher language skills performed better on linguistically complex mathematics items. Mathematics
achievement may be related to an interaction between children’s language skills and the linguistic demands of the tests themselves.
LANGUAGE PROFILE AND PERFORMANCES ON MATH ASSESSMENTS FOR
CHILDREN WITH MILD INTELLECTUAL DISABILITIES
by
KATHERINE T. RHODES
A Thesis Submitted in Partial Fulfillment of the Requirements for the Degree of
Master of Arts
in the College of Arts and Sciences
Copyright by Katherine T. Rhodes
LANGUAGE PROFILE AND PERFORMANCES ON MATH ASSESSMENTS FOR
CHILDREN WITH MILD INTELLECTUAL DISABILITIES
by
KATHERINE T. RHODES
Committee Chair: Rose A. Sevcik
Committee: Robin Morris
MaryAnn Romski
Electronic Version Approved:
ACKNOWLEDGMENTS
This research would not have been possible without the participation of students, teachers, and
schools included in the Reading Intervention Study. The study research staff and senior
researchers also dedicated countless hours to accomplish this research. Thank you to my Thesis Committee, Rose Sevcik, Robin Morris, and MaryAnn Romski, for their guidance and support. I
TABLE OF CONTENTS
ACKNOWLEDGMENTS ... iv
LIST OF TABLES ... vii
LIST OF FIGURES ... ix
CHAPTER 1: LITERATURE REVIEW ... 1
Mathematics Achievement in the United States ... 2
Disparities in U.S. Mathematics Achievement for Children with Disabilities ... 2
Challenges In Assessing Mathematics Achievement ... 5
Language Difficulties and Assessment Demands for Children with MID ... 7
Research Questions and Hypotheses ... 9
CHAPTER 2: METHODS ... 11
Participants ... 11
Measures ... 12
Design ... 26
Data Collection ... 27
CHAPTER 3: RESULTS ... 28
Analysis Overview ... 28
Covariate Analyses ... 28
Preliminary Measurement Model Analyses ... 42
Child Language Profile Measurement Invariance ... 55
Multilevel Structural Model Analyses ... 62
CHAPTER 4: DISCUSSION ... 70
Conclusions and Practical Applications ... 75
REFERENCES ... 77
APPENDICES ... 82
Appendix A ... 82
Appendix B... 86
LIST OF TABLES
Table 1Continuous Demographic Variables N, Mean, and Range Overall and By Intervention
Group 13
Table 2Non-Continuous Demographic Variables Frequency Data Overall and By Intervention
Group 15
Table 3Child Language Indicators (Baseline) By Child Demographic Variables Correlation
Matrix 32
Table 4Child Language Indicators (Post Intervention) By Child Demographic Variables
Correlation Matrix 33
Table 5Child Item Response (at Baseline) By Child Demographic Correlation Matrix 34
Table 6Child Item Response (Post-Intervention) By Child Demographic Correlation Matrix 35 Table 7Child Demographic Variable Correlation Matrix 38
Table 8KM-R Item Linguistic Complexity Indices 40
Table 9Item Linguistic Complexity Indicators By Item Characteristic Variables Correlation
Matrix 41
Table 10Baseline Child Language Profile Indicator Means, SDs, and Correlations 44 Table 11Baseline Child Language Profile CFA Standardized and Unstandardized Factor
Loadings, Standard Errors, and Confidence Intervals 45
Table 12Post Intervention Child Language Profile Indicator Means, SDs, and Correlations 47 Table 13Post Intervention Child Language Profile CFA Standardized and Unstandardized
Factor Loadings, Standard Errors, and Confidence Intervals 48
Table 15Item Linguistic Complexity CFA Standardized and Unstandardized Factor Loadings,
Standard Errors, and Confidence Intervals 51
Table 16Modified Item Linguistic Complexity CFA Standardized and Unstandardized Factor
Loadings, Standard Errors, and Confidence Intervals 53
Table 17Measurement Invariant Child Language Profile Models: Equal Loadings Tests with
Global Fit Chi-square Statistics and Chi-square Difference Tests 59
Table 18Final, Partial Measurement Invariant Child Language Profile Model Standardized and Unstandardized Factor Loadings, Standard Errors, and Confidence Intervals 60
LIST OF FIGURES
Figure 1. Proposed two level model of mathematics item performance. 29
Figure 2. Child language profile proposed factor structure. 43
Figure 3. Modified and final item linguistic complexity proposed factor structure. 54
Figure 4. Baseline CFA measurement model for measurement invariance testing. 57
Figure 5. Final, partial invariance measurement model. 61
Figure 6. Baseline structural two-level model of mathematics item performance. 64
CHAPTER 1: LITERATURE REVIEW
General mathematics skills are an important aspect of successful daily living. School-age
children in the United States are regularly tested for mathematics proficiency, and the results of these tests are used to inform curriculum development and intervention efforts for those students who are not performing at grade level. Although there is concern about poor mathematics
achievement in the overall U.S. population of school age children, those children with mild to moderate disabilities have the largest achievement gap compared to their peers without
disabilities. Children with mild intellectual disabilities represent a large portion of the U.S. population of children with developmental disabilities, and their specific mathematics
achievement profile is an area in need of additional research to design targeted interventions.
While it often has been assumed that mathematics testing results indicate poor development of mathematics concepts, the linguistic demands of auditory processing and verbal working
memory have not been substantially evaluated as potentially confounding assessment effects for children with mild intellectual disability. Intervention efforts targeting only mathematics
concepts, without attention to the language skills needed to interpret assessment demands, may
be ineffective for children with certain cognitive-linguistic profiles.
To address this area of concern, the current study sought to examine the role of cognitive
linguistic skills and mathematics assessment performance in children with mild intellectual disabilities. The purpose of this research was to characterize the relationship between the linguistic demands of mathematics assessments and language skills of school-age children with
Mathematics Achievement in the United States
Basic mathematics skills are essential in all aspects of independent living (e.g.,
navigating personal finances, measuring distances, planning events and manipulating schedules, etc.). Mathematics achievement from Kindergarten to postgraduate levels is a focus in the objectives of the U.S. Department of Education because it is also vital to achievement in the
sciences (STEM Education Coalition, 2000). Through agencies like the National Science Foundation and the Institute of Education Sciences, the U.S. government has attempted to
monitor and improve national education trends in mathematics. However, many children in the U.S. still fail to achieve grade level proficiency.
The most recent National Assessment of Educational Progress (NAEP) National Report
Card indicated that a significant percentage of students were below grade level proficiency in the 2011 national sample. The NAEP reported that across all students tested, 60% of fourth graders
in the United States were below grade level proficiency in mathematics (NCES, 2011). As grade level increases, the trend of mathematics achievement is worse, with 65% of 8th graders
performing below grade level proficiency (NCES, 2011). Although 12th grade was not assessed
during the most recent (2011) National Report Card, in the 2009 assessment 74% of 12th graders were performing below grade level proficiency in mathematics (IES, 2010). Of the school-age
children tested in 2011, approximately 11% of the 4th grade students tested and 10% of the 8th grade students tested were children identified as having one or more disabling conditions (e.g., hearing difficulty, visual difficulty, learning disability, mild intellectual disability; NCES, 2011).
Disparities in U.S. Mathematics Achievement for Children with Disabilities
compared to children without disabilities. Among those students who were labeled with a
disability, 83% of 4th graders and a devastating 91% of 8th graders were below grade level proficiency (NCES, 2011; note that the 2009 results indicated that 93% of 12th graders with disabilities were performing below grade level proficiency, IES, 2010). In contrast, those
children who were not identified as having disabilities did not evidence the same extreme achievement problems; 57% of 4th grade students and 62% of 8th grade students who did not
have a disability performed below grade level proficiency (NCES, 2011).
Although the national achievement statistics often dichotomize disability, educational research has provided some clarity as to the achievement trends of children with mild disabilities
(including learning disabilities, emotional-behavioral disorders, and mild intellectual disabilities). In analyzing the mathematics achievement literature for children with mild
disabilities, Parmar, Frazita, and Cawley (1996) identified three troubling achievement trends, (1) the contemporary age-to-grade performance of children with mild disabilities is similar to what it was in the 1930s, (2) the rate of growth for children with mild disabilities is
approximately one year of grade level achievement for every two years of school, and (3) by the end of secondary school, children with mild disabilities reach only the 5th or 6th grade level of
mathematics knowledge with competencies in arithmetic computation and no competencies in problem solving and applications.
Historically, students with disabilities have been excluded from large scale achievement
studies, because their participation requires special testing accommodations. Since 1996, the NAEP has been working to ensure more testing accommodations for students with disabilities
access to large-print or magnification devices, testing in small groups, etc.). However, despite
increased efforts towards inclusion, exclusion of persons with disabilities was still an issue in the 2011 National Report Card: students could be excluded by their schools (not by independent assessments with the NAEP examiners) on the basis of labels of severe cognitive impairments,
concerns that testing accommodations would necessitate multiple days of testing, or concerns that students would require non-permitted testing accommodations (U.S. Department of
Education, 2009).
Those students who were included in the most recent NAEP testing most likely represented children with mild to moderate disabilities; however, specific characterization of
these students is difficult because "disability" is not specifically described in terms of overall functioning or diagnosis. The NAEP dichotomizes disability in terms of those students who were
labeled with one or more disabilities, as evidenced by IEPs and other school records, and those students who were not labeled as having a disability (NCES, 2011). A dichotomized treatment of disability does not allow for the characterization of specific types of disabilities (e.g., learning
disabilities, intellectual disabilities, autism spectrum disorders, hearing impairments, visual impairments, etc.); it allows only for generalizations about the achievement trends of some
portion of those children receiving special education who were selected for test participation by their schools. Understanding national mathematics learning and achievement profiles relative to specific disability diagnoses is an area in need of additional research.
Among developmental disabilities, intellectual disability is the most common and ranks first among conditions causing major limitations in activity in the U.S. (CDC, 1996), but children
age, definitions and measurements of disability, and overall study methodology, there seems to
be some agreement that U.S. national prevalence for mild intellectual disability in school-age children is between 1% and 3% (Roeleveld, Zielhuis, & Gabreels, 1997). The 1991, 1996, and 2000 MADDSP reports have consistently estimated that mild intellectual disability accounts for
approximately two thirds of children with intellectual disability (Bhasin, Brocksen, Avchen, & Van Naarden Braun, 2006; Boyle, Yeargin-Allsopp, Doernberg, Holmgreen, Murphy, &
Schendel, 1996). Thus, a large percentage of the children with disabilities reported in national achievement testing are most likely children with mild intellectual disability.
Challenges In Assessing Mathematics Achievement
Many popular mathematics assessments (e.g., the Kaufman Assessment Battery for
Children, KABC, Kaufman & Kaufman, 1985; the Wechsler Individual Achievement Test, WIAT, Psychological Corporation, 1992; the KeyMath-Revised Diagnostic Inventory of
Essential Mathematics, KM-R, Connolly, 1988) have been criticized for their lack of content validity for use with children who have mild disabilities (Parmar, Fazita, & Cawley, 1996). These assessments often fail to provide balanced coverage of mathematic concepts, focusing
largely on arithmetic computation and not on strategy and problem solving. The content reflected in assessments is also not always relevant to the curriculum emphasized at the classroom level or
in students' IEPs, and thus, testing recommendations may have little practical relevance to educational placement, curriculum design, and instructional strategies.
The mathematics achievement tests most commonly used in the U.S. rely on dichotomous
(right/wrong) scoring systems for evaluating students' responses, but a dichotomized scoring system does not allow for the characterization of cognitive features contributing to mathematics
struggling to provide correct answers in various mathematics content areas, but it does not
provide insight as to why. A failure to provide a correct answer on a mathematics assessment item can be the result of any number of errors, (1) an error in understanding what one is being asked to do, (2) an error in selecting the correct approach to a mathematics question or the
correct operation to a mathematics problem, (3) a computational error in correctly completing a mathematics operation, or (4) an error in reporting the correct answer one has derived
(Goodstein, Kahn, & Cawley, 1976). While some types of errors are more indicative of difficulty with mathematics knowledge or skill (which could be the result of cognitive difficulties with mathematics concepts or instructional shortcomings in relaying mathematics information), other
errors could be indicative of more general cognitive, linguistic, or even motor difficulties. Few studies have addressed the specific pattern of mathematics assessment errors for
children with mild intellectual disabilities (MID). Error analysis studies conducted with other populations of children with mild disabilities (including learning disabilities and emotional behavioral disabilities but excluding MID) indicate that most of the mathematics errors are being
made in (1) correctly interpreting the instructions and linguistic demands of the question, and (2) selecting the correct operation and approach to the question (Parmar, 1992).In Parmar's (1992)
study with 31 children with learning disabilities or emotional-behavioral disorders aged 8 to 14 years,reading questions aloud was not sufficient to help students with disabilities identify and remember key features of the problems, break problems down into steps, or integrate the relevant
steps of a solution.These students also struggled with selecting operations that were appropriate for solving particular problems and matching operations to arithmetic symbols, even though they
self-correction, (2) difficulty selectively attending to relevant information and suppressing extraneous
information, and (3) difficulty with concentration for prolonged periods without prompts (Parmar, 1992). The error patterns evidenced for other students with mild disabilities would seem to suggest that even with the provision of testing accommodations, students with MID may
not be able to access the linguistic demands of mathematics assessment items.
The fact that testing accommodations are needed for the inclusion of children with (mild
to moderate) disabilities in national achievement testing highlights the major issues of validity in using standardized mathematics assessments with populations of children who have disabilities. Children with intellectual disabilities are routinely assessed with measures that were designed
and normed using typically developing children. The vast majority of testing accommodations provided to children during the 2011 NAEP study involved reading test questions and/or
directions aloud. These allowed testing accommodations are in place, not to reduce the mathematics content demands of the assessment questions, but to enable students with disabilities to access testing instructions and the meanings of the questions themselves. Such
accommodations are derived from students' individualized educational plans (IEPs), and they are used across standardized testing scenarios (NCES, 2011). However, even with the provision of
these testing accommodations, the mathematics achievement disparity of children with
disabilities remains extreme. This pattern may speak to the linguistic demands of mathematics assessments.
Language Difficulties and Assessment Demands for Children with MID
Language is commonly understood as some combination of skills in the areas of syntax, morphology, vocabulary (including expressive and receptive vocabulary knowledge), semantics,
auditory processing (specifically phonological awareness), social knowledge, working memory,
and executive functioning also may be incorporated to understand and measure language. For the purposes of this study, language was of interest insofar as language was used in direct
mathematics testing situations. Child language abilities were considered in terms of syntax,
morphology, vocabulary, and semantics.
For children with mild intellectual disabilities, language functioning is often a significant
impairment for overall functioning. Miller, Chapman, and MacKenzi (1981) reported that for approximately 50% of children with intellectual disability, language comprehension and/or production is significantly below the level of general cognitive functioning. The auditory
processing tasks of attending to relevant cues, discriminating between similar and different cues, organizing and categorizing cues, storing and retrieving cues, and synthesizing linguistic
information (both simultaneously and sequentially) may all represent significant challenges for children with intellectual disabilities (Owens, Metz, & Haas, 2007).
As mathematics questions become more complex along the dimensions of syntax,
morphology, vocabulary, and semantics, they may become more difficult for children with MID to answer. While it often has been assumed that mathematics testing results indicate poor
development of mathematics concepts for these children, the linguistic demands of auditory processing and verbal working memory have not been substantially explored as potentially confounding assessment effects.
Measures of mathematics ability often rely heavily on language as the primary modality of question delivery and response delivery. Paper/pencil or verbal formats are common for
1996). Though accommodations may be provided to aid children with intellectual disabilities in
completing mathematics assessments (reading questions aloud, repeating verbal stimuli, and allowing extra time and prompting), the auditory language processing demands of assessment may still present significant challenges for children with MID. Language-heavy assessments may
unintentionally become measures of language ability, as opposed to measures of mathematics ability, when used with children who have language difficulties.The current study sought to
characterize the relationship between children's language profiles, mathematics assessment items' linguistic complexity, and children's mathematics performance.
Research Questions and Hypotheses
Research Question 1.
What is the relationship between item linguistic complexity and children’s language
skills in predicting the mathematics achievement of children with mild intellectual disability (MID)? It is expected that both item linguistic complexity and children's language skills are
significant predictors of mathematics achievement.
Research Question 2.
Is there an association between mathematics performance and item linguistic complexity, and if so, is that association dependent upon a child’s language profile? It is expected that a
significant interaction between item linguistic complexity and children's language skills predicts mathematics performance.
Research Question 3.
Is the relationship between item linguistic complexity and children's language skills
between item linguistic complexity and children's language skills is not stable over time, such
CHAPTER 2: METHODS
Participants
The participants were recruited for a reading intervention study designed to test the
efficacy of reading programs for students with mild intellectual disability. The parent study spanned five years from 2005 to 2010 (Sevcik, 2005). Participants were selected using initial school-based referrals and then screened for additional inclusionary and exclusionary criteria.
Schools in the greater metro-Atlanta area referred children who were between the ages of 7 (at the end of the first grade) and 10 (at the end of fourth grade), met the state criteria for mild
intellectual disability, and were eligible for special education services. Consent packets were sent home for parents to review, and participation was allowed for those students who returned
completed consent forms.
Students were eligible for inclusion in the reading intervention study if they demonstrated difficulty in developing reading skills. Students were excluded from the study if they spoke
English as a second language, demonstrated hearing impairment, demonstrated uncorrected vision impairment, or had a history of serious emotional and/or psychiatric disturbance based on school records. Recruitment also attempted to balance the sample across the sexes.
A final sample of 244 children, who completed one year of intervention, was selected for the current study from the reading intervention study sample. At baseline this sample ranged in
age from 80 months to 147 months, with a mean age of 110.80 months (SD = 16.18). The overall sample grade level mean was 3.33 (SD = 1.14). These children represented two metro-Atlanta area counties, A (n = 78) and B (n = 166), and 12 schools. The mean PPVT language age of this
for 206 of the total 244 students participating. Missing data patterns were considered during
subsequent data analysis. Approximately 62.20% of the sample was male (n = 158). The sample was racially and ethnically diverse (56.15% African American, 20.90% Caucasian, 16.39% Hispanic, 2.05% Asian, 4.10% Multiracial, and .41% Not reported).
Parents of students eligible for participation were asked to complete a family demographic questionnaire including information about parent education and income and
information about child developmental and medical history. The information from this questionnaire was then coded using the Hollingshead Two Factor Index of Social Position in order to obtain numerical values for socioeconomic labels (Hollingshead, 1975). The mean
family Hollingshead score was 30.28 (SD = 12.96), the mean level of education for mothers (n=226 respondents) was 12.70 years (SD = 3.03), and the mean level of education for fathers
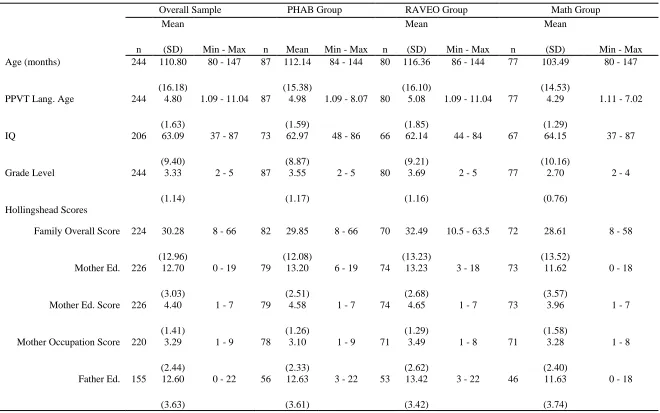
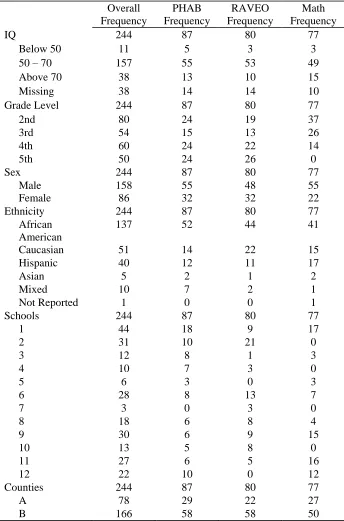
(n=155 respondents) was 12.60 years (SD = 3.63). Table 1 presents a breakdown of continuous descriptive variables for the overall sample and for each intervention group. Table 2 presents frequency data for discrete descriptive variables for the overall sample and for each intervention
group.
Measures
Measures overview.
An assessment battery was selected by the parent study researchers to describe students’
initial cognitive and linguistic profiles and to assess the outcomes of the interventions in areas of academic achievement and language skills. This assessment battery was administered at four time points, (1) at a baseline time point when students had received 0 hours of intervention
Table 1
Continuous Demographic Variables N, Mean, and Range Overall and By Intervention Group
Overall Sample PHAB Group RAVEO Group Math Group
n
Mean
(SD) Min - Max n Mean Min - Max n
Mean
(SD) Min - Max n
Mean
(SD) Min - Max
Age (months) 244 110.80
(16.18)
80 - 147 87 112.14
(15.38)
84 - 144 80 116.36
(16.10)
86 - 144 77 103.49
(14.53)
80 - 147
PPVT Lang. Age 244 4.80
(1.63)
1.09 - 11.04 87 4.98
(1.59)
1.09 - 8.07 80 5.08
(1.85)
1.09 - 11.04 77 4.29
(1.29)
1.11 - 7.02
IQ 206 63.09
(9.40)
37 - 87 73 62.97
(8.87)
48 - 86 66 62.14
(9.21)
44 - 84 67 64.15
(10.16)
37 - 87
Grade Level 244 3.33
(1.14)
2 - 5 87 3.55
(1.17)
2 - 5 80 3.69
(1.16)
2 - 5 77 2.70
(0.76)
2 - 4
Hollingshead Scores
Family Overall Score 224 30.28
(12.96)
8 - 66 82 29.85
(12.08)
8 - 66 70 32.49
(13.23)
10.5 - 63.5 72 28.61
(13.52)
8 - 58
Mother Ed. 226 12.70
(3.03)
0 - 19 79 13.20
(2.51)
6 - 19 74 13.23
(2.68)
3 - 18 73 11.62
(3.57)
0 - 18
Mother Ed. Score 226 4.40
(1.41)
1 - 7 79 4.58
(1.26)
1 - 7 74 4.65
(1.29)
1 - 7 73 3.96
(1.58)
1 - 7
Mother Occupation Score 220 3.29
(2.44)
1 - 9 78 3.10
(2.33)
1 - 9 71 3.49
(2.62)
1 - 8 71 3.28
(2.40)
1 - 8
Father Ed. 155 12.60
(3.63)
0 - 22 56 12.63
(3.61)
3 - 22 53 13.42
(3.42)
3 - 22 46 11.63
(3.74)
Father Ed. Score 155 4.31
(1.52)
1 - 7 56 4.32
(1.51)
1 - 7 53 4.62
(1.44)
1 - 7 46 3.93
(1.57)
1 - 7
Father Occupation Score 147 4.18
(2.24)
1 - 9 54 3.96
(2.09)
1 - 9 50 4.66
(2.34)
1 - 9 43 3.91
(2.27)
1 - 9
Mother Hollingshead Score 216 29.91
(14.86)
8 - 66 76 29.46
(13.94)
11 - 66 70 31.74
(15.24)
8 - 61 70 28.57
(15.46)
8 - 58
Father Hollingshead Score 142 34.22
(14.03)
8 - 66 53 33.17
(13.53)
8 - 66 47 37.72
(14.25)
13 - 66 42 31.62
(13.96)
8 - 66
Note. PPVT: Peabody Picture Vocabulary Test III Form A (Dunn & Dunn, 1997). Hollingshead Two Factor Index of Social Position
Table 2
Non-Continuous Demographic Variables Frequency Data Overall and By Intervention Group
Overall PHAB RAVEO Math
Frequency Frequency Frequency Frequency
IQ 244 87 80 77
Below 50 11 5 3 3
50 – 70 157 55 53 49
Above 70 38 13 10 15
Missing 38 14 14 10
Grade Level 244 87 80 77
2nd 80 24 19 37
3rd 54 15 13 26
4th 60 24 22 14
5th 50 24 26 0
Sex 244 87 80 77
Male 158 55 48 55
Female 86 32 32 22
Ethnicity 244 87 80 77
African American
137 52 44 41
Caucasian 51 14 22 15
Hispanic 40 12 11 17
Asian 5 2 1 2
Mixed 10 7 2 1
Not Reported 1 0 0 1
Schools 244 87 80 77
1 44 18 9 17
2 31 10 21 0
3 12 8 1 3
4 10 7 3 0
5 6 3 0 3
6 28 8 13 7
7 3 0 3 0
8 18 6 8 4
9 30 6 9 15
10 13 5 8 0
11 27 6 5 16
12 22 10 0 12
Counties 244 87 80 77
A 78 29 22 27
B 166 58 58 50
Note. For the purposes of sample characterization, IQ and grade level were characterized as discrete variables in this table; however, both were treated as continuous variables in
Mathematics achievement measure.
The KeyMath-Revised Inventory (KM-R; Connolly, 1988) is one of the most widely used
mathematics assessments for children with disabilities receiving special education services. The KM-R was designed to assess students’ basic math competencies in concepts, operations, and applications across a variety of math domains. The KM-R is diagnostic in the sense that it
provides measurement of performance across specific areas of mathematics curriculum (e.g., numeration, addition, subtraction, geometry, problem solving, etc.), but it does not yield specific
patterns of error analysis (e.g., incorrect algorithm selection, computational error, etc.; Goodstein, Kahn, & Cawley, 1976).
The KM-R was designed for students in grades K through 9, normed on 1,794 typically
developing students 5 to 15 years of age. It consists of 13 subscales, each representing a major concentration of mathematics skills. For the purposes of the parent study and the current project,
only six subscales of the KM-R (Form A) were administered to the students. The Numeration, Geometry, Addition, Subtraction, Measurement, and Time and Money subscales were selected to reflect the curriculum experiences of students with mild intellectual disability receiving special
education in grades 1 to 5.
Questions on the KM-R are administered orally with minimal visual support from an
illustration array, and student responses are provided orally. For example, an examiner might administer an item on the numeration subscale by saying, “How many children do you see in this
picture,” while the student observes a visual array depicting several children of varying sizes and
Split half reliability coefficients for the KM-R assessment are dependent on subtest and
grade level. For the numeration subtest, students in grades 1 through 5 of the normative sample all demonstrated reliability coefficients at or above .75. For the geometry subtest, students in grades 1 through 5 demonstrated reliability coefficients at or above .72. For the addition subtest,
students in grades 1 through 5 demonstrated reliability coefficients at or above .56. For the subtraction subtest, grades 1 through 5 demonstrated reliability coefficients at or above .68. For
the measurement subtest, students in grades 1 through 5 demonstrated reliability coefficients at or above .72. For the time and money subtest, students in grades 1 through 5 demonstrated reliability coefficients at or above .67 (Connolly, 1988).
Content validity for the KM-R was examined using essential math content to reflect curricula and national trends, consultations with numerous experts in mathematics education, and
subdivision of the assessment into domains to reflect equal weighting among concepts. However, the content validity of the KM-R, when used with populations of children who have mild
disabilities, has been called into question for failure to provide balanced coverage of
mathematics concepts, overemphasis on computation and under emphasis on problem solving, and mismatch with students' special education classroom experiences and IEP goals (Parmar,
Fazita, & Cawley, 1996).
Construct validity of the KM-R was examined using developmental stage progression analyses, reliability analyses, and convergent validity with the Comprehensive Test of Basic
Skills (with an overall correlation of .66) and the Iowa Test of Basic Skills (with an overall correlation of .76; Connolly, 1988). However, Connolly (1988) did not provide empirical
KeyMath have been criticized by a number of researchers (Walker & Arnault, 1991; Williams,
Fall, Eaves, Darch, & Woods-Groves, 2007; see Appendix A).
The KM-R assessment was not timed. Each subscale was administered until students reached a ceiling with three consecutive incorrect responses. At the item level, correct responses to each item are recorded as ‘1’ and incorrect responses are recorded as ‘0’. Raw scores can be
computed for each subtest by adding the total number of correct responses. All 244 participants
had an opportunity to provide responses to a minimum of items 1 through 3 on each subtest. Because the focus of the current study involved item level analyses, only items 1-3 of each subtest were included, thus assuring that all student participants had had an opportunity to
provide an item level answer.
Child language profiles.
Defining children’s language ability. Child language abilities were defined as a
combination of syntax, morphology, vocabulary, and semantics, and were operationalized using the Clinical Evaluation of Language Fundamentals edition four (CELF-4; Semel, Wiig, & Secord, 2003), the Peabody Picture Vocabulary Test III Form A (PPVT; Dunn & Dunn, 1997),
and the Expressive Vocabulary Test (EVT; Williams, 1997). These measures of language are considered below.
Syntactic and morphological functioning. Syntactic and morphological functioning can be conceptually defined as awareness of grammaticality. The CELF-4 Language Structure Index was used to measure children’s syntactic and morphological functioning. The CELF-4 is a
commonly used measure of language functioning with high construct validity across typical and atypical language users (including gifted students, students with hearing impairments, visual
& Secord, 2003). The CELF-4 standardization sample included more than 4,500 participants
(ages 5 to 21 years) from geographically diverse regions in the United States. For this sample of children, with average language age 4.80 years (SD = 1.63), subtests appropriate for children ages 5 to 8 years were selected to indicate receptive language, expressive language, language
content (semantics), and language structure (syntax and morphology) of interest on the CELF-4 (appropriate subtests included Concepts and Following Directions, Word Structure, Recalling
Sentences, Formulated Sentences, Word Classes I Receptive Vocabulary, Word Classes I Expressive Vocabulary, and Sentence Structure).
The Word Structure subtest, Recalling Sentences subtest, Formulated Sentences subtest,
and Sentence Structure subtest comprise the CELF-4 Language Structure Index score. All of the subtests included in the Language Structure Index were administered and used as indicators of
the syntactic and morphological aspects of child language profile.
The Word Structure subtest presented students with verbal statements to be completed using the aid of illustrations. Administrators asked the students using verbal statements about one
picture, and students responded with grammatically equivalent statements about another picture in the array (e.g., “This boy is walking, and this boy ___” would entail answering with the
grammatically equivalent statement “is running”). All 32 items in the subtest were administered
in this untimed assessment. Raw scores were computed from totaling correct responses.
The Recalling Sentences subtest presented students with verbal statements to be repeated
made. The assessment was untimed. Ceiling was reached when students answered five
consecutive items with four or more errors in repetition. Raw scores were computed by totaling the scores for each item.
The Formulated Sentences subtest presented the students with an illustration and a single
word verbal prompt. The single word was to be used in a complete sentence relating to the illustration presented (e.g., “Make a sentence about this picture using the word ‘book.’”).
Responses were scored ‘2’ if no grammatical errors were made and the target word was used, ‘1’ if a grammatical error was made and the target word was used, and ‘0’ if two or more
grammatical errors were made and/or if the target word was not used. The subtest was untimed and administered until a ceiling of five, consecutive scores of ‘0’ were obtained. Raw scores
were computed by totaling the scores for each item.
The Sentence Structure subtest was administered with a visual array of four, similar scenes and an orally presented stimulus. The stimulus was a complete sentence describing one of the scenes depicted, and students responded by selecting the scene described by the verbal
prompt. The items varied in grammatical content and difficulty. The subtest was untimed, and all 26 items were administered. Raw scores were computed by totaling the number of correct
responses.
In general, reliability for the CELF is dependent on subtest and age of examinee, and so reliability was considered relative to the ages and language skills of the participants in the
current study. Selected subtests demonstrate high reliability (.70 and higher internal consistency coefficient alpha) across content, time, and scorer (Semel, Wiig, & Secord, 2003). The Sentence
Language Structure subtests all displayed reliabilities at and above .85 (Semel, Wiig, & Secord,
2003).
Vocabulary knowledge. Vocabulary knowledge, with regard to both receptive and
expressive vocabulary, can be conceptually defined as a combination of both stored phonological
and semantic representations of words (Levelt, Roelofs, & Meyer, 1999). The Peabody Picture Vocabulary Test III Form A (PPVT; Dunn & Dunn, 1997) was used to assess receptive
vocabulary, and the Expressive Vocabulary Test (EVT; Williams, 1997) was used to assess expressive vocabulary because they are commonly accepted measures of the constructs and also have demonstrated validity across examinees with both typical and atypical language profiles,
including individuals with mild intellectual disabilities. The PPVT III and EVT are both appropriate for a broad range of ages (two years and six months through adulthood). These
assessments were administered such that basal scores and ceilings were established for all participants.
The PPVT III was administered by presenting students with an array of four illustrations. Students were asked to point to the picture that depicted the target vocabulary item (e.g., “Point to the picture that shows ‘baby’.”). Items were divided into 17 sets with 12 items each. The
PPVT III is not a timed assessment. Items were administered until students reached a ceiling of eight incorrect items in a set. Raw scores were calculated by subtracting the total number of incorrectly answered items from the last item in the ceiling set. Higher raw scores indicated
higher receptive vocabulary.
For all applicable ages, the reliability for the PPVT III is high across content, time, and
differentiation. The PPVT III correlates well with other measures of vocabulary and moderately
well with measures of verbal ability, indicating high construct validity (Dunn & Dunn, 1997). The first section of the EVT (designed for children ages two years and six months to four years and eleven months) was administered by presenting students with an illustration and asking them to name objects or actions (e.g., “What is this,” or “Tell me a word for this?”). The second
section of the EVT (designed for children age five to adults) was administered by presenting an
illustration and a verbal label of that illustration. Examinees were then asked to provide another word for the illustration (e.g., “I am going to say a word and I want you to tell me another word
that means the same thing. Bag. Tell me another word for ‘bag’.”). The assessment was not
timed. Items were administered until students reached a ceiling of five consecutive incorrect responses. Raw scores were calculated by subtracting the total incorrectly answered items from
the last item administered. Higher raw scores indicated higher expressive vocabulary.
The EVT demonstrates high reliability in both test-retest results and item uniformity in the normative sample. The EVT also demonstrates high construct validity as evidenced by word
frequency data, age differentiation, and correlation with other language measures requiring expression.
Semantic knowledge. Semantic knowledge can be conceptually defined as awareness of meaning at the word, sentence, and connected text levels (Semel, Wiig, & Secord, 2003). The CELF-4 Language Content Index was used to measure children’s semantic knowledge. For
typically developing children ages 5 to 8 years (and for children with similar language
development), the Concepts and Following Directions subtest, the Word Classes I subtest, and
the Expressive Vocabulary subtest comprise the CELF-4 Language Content Index score.
considerations of total testing time and child fatigue, the CELF-4 Expressive Vocabulary subtest
was not included in the total testing battery for this study. Instead, Concepts and Following Directions and Word Choices I were selected as the subtests to be included as indicators of the semantic aspects of child language profile.
The Concepts and Following Directions subtest presented students with verbal directions of increasing complexity and length to be completed using the aid of illustrations. Administrators
asked the students to point to illustrations with specific names and attributes in the order specified by the directions, and students responded by pointing to picture(s) in the illustrated array (e.g., “Point to the pictures that are red,” would entail pointing to only the red items in an
array). All 23 of the set 1 items in the subtest were administered, and the 31 items in set 2 were administered to a ceiling of seven consecutive incorrect items. The Concepts and Following
Directions subtest was untimed. Raw scores were computed from totaling correct responses. The Word Choices I subtest presented students with illustrated arrays of objects, a verbal prompt to identify the two objects that “go together,” and a verbal prompt to identify how the two selected objects “go together.” First, administrators labeled objects in the array and asked the
students to identify the two objects that "go together." Students responded with either verbal
statements or by pointing to identify objects (e.g., “Here are sandwich, apple, and plate. Which two go together?” would entail answering with “sandwich and apple”), completing the Receptive
portion of the Word Classes subtest. Next, administrators prompted the students to explain how
types of food.”). All 21 items in the subtest were administered in this untimed assessment. Raw
scores were computed from totaling correct responses.
Selected subtests demonstrate high reliability (.84 and higher internal consistency coefficient alpha) across content, time, and scorer (Semel, Wiig, & Secord, 2003). For children
identified as having intellectual disabilities, the Concepts and Following Directions subtest and the Word Choices I subtest both displayed reliabilities at and above .85 (Semel, Wiig, & Secord,
2003).
Linguistic complexity of mathematics test items.
Defining linguistic complexity. For the purposes of this study, linguistic complexity was considered under the relative linguistic complexity definition. Relative linguistic complexity
considers not only the form and meaning of language, but also the language abilities of the user. Because this study was evaluating linguistic complexity as it interacted with the language
profiles of atypical language users, relative linguistic complexity was most appropriate.
Linguistic complexity was defined as the relative complexity of a unit of language with regard to both structure and content (a combination of vocabulary, utterance length, and grammatical
complexity). The vocabulary level of linguistic complexity was measured using the relative frequency of occurrence of words in the English language. Utterance length was measured using
the number of morphemes, words, and different words occurring in each item. Grammatical complexity was measured using the Developmental Sentence Score of each item. These operational definitions are explored in more detail below.
Word frequency. The Educator’s Word Frequency Guide (Zeno, Ivens, Millard, & Duvvuri, 1995) is a collection of various frequency measures of words in the English language,
variety of disciplines and content areas (e.g., language arts, social sciences, science,
mathematics, fine arts, health, safety, etc.). The “D statistic” of word frequency describes the relative entropy of a word, its frequency of use from zero (words appearing rarely and in only one content area) to one (words appearing frequently and across all content areas). For example, the word “the” has a D statistic of .9971, reflecting a relatively large frequency of use, while the
word “anorexia” has a D statistic of .2221, reflecting a relatively small frequency of use. The
standardized item prompts for each target KM-R item in the analysis were transcribed according to CHAT transcription program conventions (MacWhinney, 2000). D statistics for each word were identified using the Word Frequency Guide (Zeno et al., 1995).
Utterance length. CHAT transcripts for each target KM-R item in the analysis were analyzed for standard utterance length measures using the CLAN software program
(MacWhinney, 2000). Number of different words, number of total words, mean length utterance in words, and mean length utterance in morphemes were of particular interest in defining
utterance length.
Developmental sentence score. The CLAN Developmental Sentence Score (DSS) program (MacWhinney, 2000) computes the DSS statistic first described by Lee (1974).
Sentences are scored based on morphosyntactic and lexical considerations across eight grammatical domains (indefinite pronouns, personal pronouns, main verbs, secondary verbs, negatives, conjunctions, interrogative reversals, and Wh-questions). Higher scores are associated
with higher grammatical complexity. KM-R item CHAT transcripts were first analyzed for morphological codes using the CLAN MOR program for English (MacWhinney, 2000). Once a
with disambiguated grammatical markers for each word in an utterance. The final output was
reviewed for correct morphosyntactic coding. Finally, the CLAN DSS program was run to identify the Developmental Sentence Scores for each utterance (in the interactive mode) to determine the CLAN DSS score.
KM-R items were evaluated using the CHAT transcription conventions and the CLAN software program. CLAN outputs of number of different words, number of total words, mean
length utterance in words, mean length utterance in morphemes, and DSS were each
incorporated as item level measures in an item level database for item linguistic complexity analyses.
Design
Students in the parent project were randomly assigned to one of three interventions, all of which included some direct instruction with an emphasis on repetition, review, and teaching to
skill mastery. The Phonological Decoding and Blending reading intervention (PHAB; Engelmann & Bruner, 1988a & 1988b) featured explicit teaching of phonemes and blending exercises at the phoneme, word, and connected text levels. The PHAB + RAVEO reading
intervention (abbreviated as the RAVEO condition, meaning Retrieval-Rate, Automaticity, Vocabulary Elaboration, and Orthography; Wolf, Miller, & Donnelly 2000) featured the
phonological components of the PHAB intervention but also incorporated vocabulary development, fluency, and comprehension skill development. The Mathematics intervention contrast condition (MATH; Engelmann & Carnine, 1992) incorporated the same instructional
format as the reading interventions, but with focused content in the areas of numeration,
addition, subtraction, multiplication, division, mental math, oral arithmetic, word problems, and
Only children who completed the scheduled 120 hours of intervention were included in
this research study. Although the parent project featured assessments of language and
mathematics at 0 hours of instruction, 60 hours of instruction, 120 hours of instruction, and 12 months after instruction had completed, the current research focused on data only from the
baseline and 120 instructional hour time points of assessment.
Data Collection
After obtaining child assent for testing, a battery of standardized and experimental
assessments was administered individually with trained graduate students or psychometrists in the school setting in private areas. The same measurement battery was administered at both the baseline and the 120 instructional hour time points. All test administrators received ongoing
training in assessment and feedback on assessment performance. Academic measures for the parent study (e.g., mathematics and reading assessments) were administered before language
measures at each time point of assessment in order to avoid potential confounds of continuing academic instruction over the school year. For the purposes of this study, the KM-R was
administered to students before the PPVT, EVT, and CELF. Administration of the entire testing
battery for the parent study (of which these assessments are only a subset) was estimated to require approximately two hours of a student’s time.
After assessment data were obtained, data were scored and checked by two separate research personnel. Both raw and standard scores were entered into a secure SPSS database. Two separate data entries with two separate research personnel were performed, and all data entries
CHAPTER 3: RESULTS
Analysis Overview
The central research questions of this study sought to examine (1) the contribution of
item linguistic complexity, (2) the contribution of child language skills, and (3) the potential interaction between item linguistic complexity and child language skill in predicting item level mathematics assessment performance on the KeyMath-Revised Diagnostic Inventory of
Essential Mathematics (KM-R). The longitudinal stability of these relationships was specified as a planned post hoc analysis. Prior to analyzing the multilevel research model, relevant child-level
and item-level covariates were identified in a series of correlation analyses. Next, child language profile and item linguistic complexity were analyzed for confirmation of specified factor
structures. Next, because children's language profiles could change over time and intervention
experience, measurement invariance of the child language profile factor was analyzed in a single sample longitudinal invariance model prior to analyses for structural invariance. Finally, the
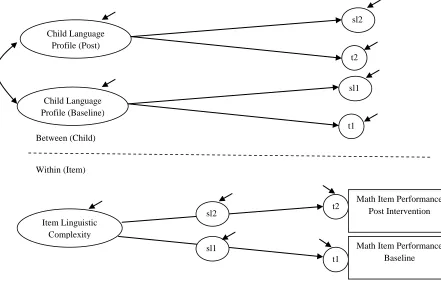
relationship between item linguistic complexity and child language profile was modeled in a multilevel interaction presented in Figure 1. The proposed structural model was examined at both baseline and post intervention, and the specified structural relationship at these two time points
was also examined for structural invariance in order to test the stability of item linguistic complexity and child language profile as predictors of mathematics achievement over time and
educational experiences. Each of these analyses are presented in the sections that follow. Covariate Analyses
Group and School Level Covariates.
Figure 1. Proposed two-level model of mathematics item performance.
for disaggregated contributions at the child-level. Intervention group and school differences were
examined with particular interest in identifying child-level covariates. Intervention group composition analyses are included in Appendix B. The results of school characterization
analyses are presented in Appendix C. The intervention group analyses indicated some significant group differences in age, grade level, mother education, and father education. The school analyses indicated some significant differences in intervention groups in the following
school-level variables: Title I status, percentage of students eligible for free or reduced lunch, percentage of White students, percentage of Hispanic students, and percentage of Multiracial
Between (Child)
Within (Item) Child Language
Profile (Post)
t2 sl2
Child Language Profile (Baseline)
t1 sl1
Item Linguistic Complexity
t1 t2 sl2
sl1 Math Item Performance
Baseline Math Item Performance
students. Special attention was paid to student age, grade level, socioeconomic status, and race in
subsequent child-level covariate analyses.
Child Level Correlations and Covariates.
Potential covariates were examined in a series of bivariate correlation analyses. First, potential covariates were examined with planned indicators of the child language profile latent
factor (CELF-4 raw scores for the Concepts and Following Directions, Word Structure, Recalling Sentences, Formulating Sentences, Word Classes I, and Sentence Structure subtests,
and total raw scores for the PPVT III and EVT). Significant correlations greater than .33 were considered to be of interest for inclusion as covariates. The following child demographic variables were considered for inclusion as covariates: age, sex, race, IQ, grade level, and
socioeconomic variables measured by the Hollingshead index. Of these child demographic variables, only age, grade level and IQ met the criteria for additional examination as covariates
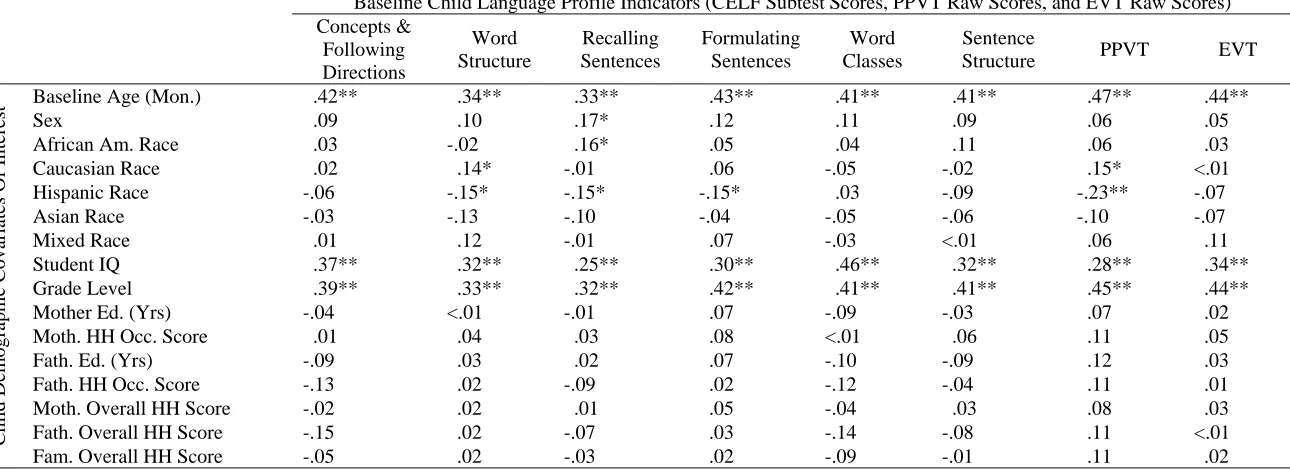
in both the baseline child language profile and post child language profile correlation analyses (see Tables 3 and 4 for full child-language by child-demographic correlation results). Age correlated at between .33 and .47 with child language profile indicators at baseline and at
between .24 and .41 with child language profile indicators post intervention. Grade level correlated at between .32 and .45 with child language profile indicators at baseline and at
between .21 and .46 with child language profile indicators post intervention. Finally, IQ correlated at between .25 and .46 with child language profile indicators at baseline and at between .21 and .46 with child language profile indicators post intervention.
Next, potential covariates were examined with the outcome variable of interest, item-level child responses to KeyMath questions (at both baseline and post intervention). Full
correlated with the KM-R items of interest above .33. Both age and grade level correlated with
Table 3
Child Language Indicators (Baseline) By Child Demographic Variables Correlation Matrix
Baseline Child Language Profile Indicators (CELF Subtest Scores, PPVT Raw Scores, and EVT Raw Scores) Concepts & Following Directions Word Structure Recalling Sentences Formulating Sentences Word Classes Sentence
Structure PPVT EVT
Chil d Dem ogr aph ic C ovariat
es Of Intere
st Baseline Age (Mon.) Sex .42** .09 .34** .10 .17* .33** .43** .12 .41** .11 .09 .41** .06 .47** .44** .05
African Am. Race .03 -.02 .16* .05 .04 .11 .06 .03
Caucasian Race .02 .14* -.01 .06 -.05 -.02 .15* <.01
Hispanic Race -.06 -.15* -.15* -.15* .03 -.09 -.23** -.07
Asian Race -.03 -.13 -.10 -.04 -.05 -.06 -.10 -.07
Mixed Race .01 .12 -.01 .07 -.03 <.01 .06 .11
Student IQ .37** .32** .25** .30** .46** .32** .28** .34**
Grade Level .39** .33** .32** .42** .41** .41** .45** .44**
Mother Ed. (Yrs) -.04 <.01 -.01 .07 -.09 -.03 .07 .02
Moth. HH Occ. Score .01 .04 .03 .08 <.01 .06 .11 .05
Fath. Ed. (Yrs) -.09 .03 .02 .07 -.10 -.09 .12 .03
Fath. HH Occ. Score -.13 .02 -.09 .02 -.12 -.04 .11 .01
Moth. Overall HH Score -.02 .02 .01 .05 -.04 .03 .08 .03
Fath. Overall HH Score -.15 .02 -.07 .03 -.14 -.08 .11 <.01
Fam. Overall HH Score -.05 .02 -.03 .02 -.09 -.01 .11 .02
Note. **. Correlation is significant at the .01 level (2-tailed). *. Correlation is significant at the .05 level (2-tailed).
CELF: Clinical Evaluation of Language Fundamentals 4th edition (Semel, Wiig, & Secord, 2003). PPVT: Peabody Picture Vocabulary Test III Form A (Dunn & Dunn, 1997).
EVT: Expressive Vocabulary Test (Williams, 1997).
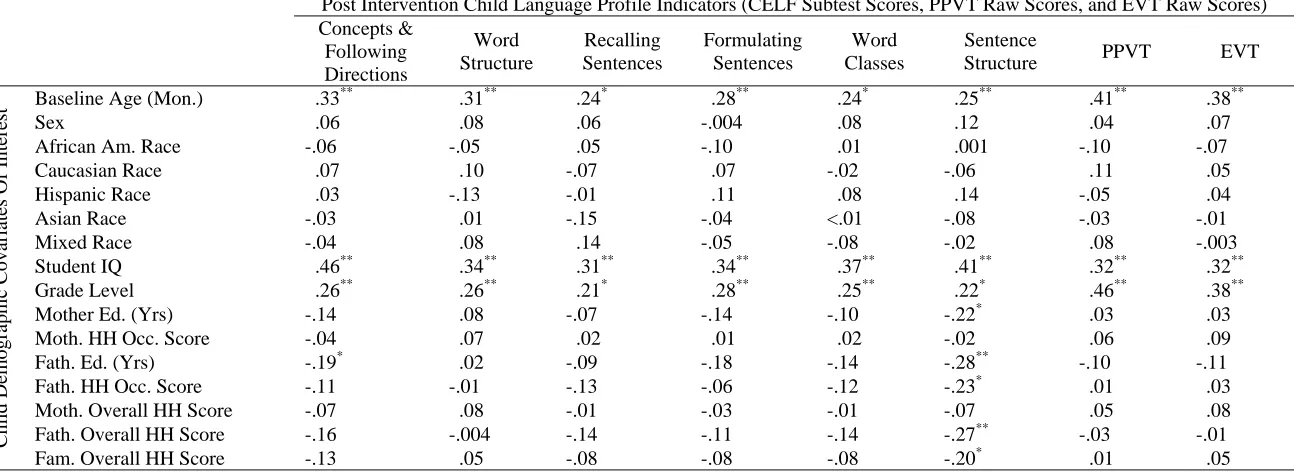
Table 4
Child Language Indicators (Post Intervention) By Child Demographic Variables Correlation Matrix
Post Intervention Child Language Profile Indicators (CELF Subtest Scores, PPVT Raw Scores, and EVT Raw Scores) Concepts & Following Directions Word Structure Recalling Sentences Formulating Sentences Word Classes Sentence
Structure PPVT EVT
Chil d Dem ogr aph ic C ovariat
es Of Intere
st Baseline Age (Mon.) .33
**
.31** .24* .28** .24* .25** .41** .38**
Sex .06 .08 .06 -.004 .08 .12 .04 .07
African Am. Race -.06 -.05 .05 -.10 .01 .001 -.10 -.07
Caucasian Race .07 .10 -.07 .07 -.02 -.06 .11 .05
Hispanic Race .03 -.13 -.01 .11 .08 .14 -.05 .04
Asian Race -.03 .01 -.15 -.04 <.01 -.08 -.03 -.01
Mixed Race -.04 .08 .14 -.05 -.08 -.02 .08 -.003
Student IQ .46** .34** .31** .34** .37** .41** .32** .32**
Grade Level .26** .26** .21* .28** .25** .22* .46** .38**
Mother Ed. (Yrs) -.14 .08 -.07 -.14 -.10 -.22* .03 .03
Moth. HH Occ. Score -.04 .07 .02 .01 .02 -.02 .06 .09
Fath. Ed. (Yrs) -.19* .02 -.09 -.18 -.14 -.28** -.10 -.11
Fath. HH Occ. Score -.11 -.01 -.13 -.06 -.12 -.23* .01 .03
Moth. Overall HH Score -.07 .08 -.01 -.03 -.01 -.07 .05 .08
Fath. Overall HH Score -.16 -.004 -.14 -.11 -.14 -.27** -.03 -.01
Fam. Overall HH Score -.13 .05 -.08 -.08 -.08 -.20* .01 .05
Note. **. Correlation is significant at the .01 level (2-tailed). *. Correlation is significant at the .05 level (2-tailed).
CELF: Clinical Evaluation of Language Fundamentals 4th edition (Semel, Wiig, & Secord, 2003). PPVT: Peabody Picture Vocabulary Test III Form A (Dunn & Dunn, 1997).
EVT: Expressive Vocabulary Test (Williams, 1997).
Table 5
Child Item Response (at Baseline) By Child Demographic Correlation Matrix
Baseline Item Response Variables
Nm 1 Nm 2 Nm 3 Ge 1 Ge 2 Ge 3 Ad 1 Ad 2 Ad 3 Sb 1 Sb 2 Sb 3 Me 1 Me 2 Me 3 TM 1 TM 2 TM 3
Chil d De mogra p hic Cov ari ate s o f Inte rest Baseline Age (Mon.)
.15 .18 .11 .11 .19 .14 .21* .21* .29** .41** .02 .18 .12 .18 .23* .19 .13 .17
Sex -.04 -.04 .06 .13 .07 .06 -.04 -.08 .05 -.01 <.01 -.05 -.06 -.12 .07 .06 .04 .22
*
African Am. Race
-.21* -.19* .09 .17 .03 .07 .06 -.04 -.03 -.07 .18 -.17 -.10 -.05 -.19* .14 -.13 -.08
Caucasian Race .14 .06 -.13 -.03 <.01 -.17 .06 -.03 .03 .01 -.12 .22
* -.02 .05 .12 -.02 .10 -.03
Hispanic Race .07 .16 .04 -.11 -.09 .07 -.23
* -.06 .03 .12 -.06 -.10 .12 -.02 .12 -.27** .03 .14
Asian Race .03 -.15 .06 -.12 <-.01 -.01 .10 .13 -.07 .04 -.03 -.04 .02 .04 -.01 -.04 .13 -.01 Mixed Race .05 .16 -.03 -.06 .05 .10 -.01 .13 .01 -.06 -.04 .08 .06 <.01 .01 .14 -.04 .04 Student IQ .05 .24
* .23* .18 .16 .30** .07 .15 .29** .37** -.03 .12 .41** .25** .18 .11 .20* .37**
Grade Level .14 .18 .23
* .05 .17 .21* .20* .20* .17 .41** .01 .14 .16 .14 .15 .09 .21* .15
Mother Ed. (Yrs)
.10 -.07 .04 -.05 .07 -.16 .10 -.10 -.07 -.15 -.11 .10 -.26** -.12 -.19 .12 .01 -.01
Moth. HH Occ. Score
.10 .08 .02 .03 .11 -.03 .13 .08 -.15 -.07 -.08 -.01 -.08 -.02 -.04 .10 .13 .07
Fath. Ed. (Yrs) .01 -.19 .06 .04 -.08 -.20
*
.23* .02 -.13 -.21* -.06 <.01 -.31** -.05 -.16 .13 -.01 -.09
Fath. HH Occ. Score
.13 -.05 .04 -.12 -.20* -.12 .08 .03 -.03 -.17 -.08 .02 -.16 -.11 -.07 <-.01 .01 -.05
Moth. Overall HH Score
.11 .04 .02 .01 .10 -.07 .14 .04 -.14 -.10 -.10 .02 -.14 -.06 -.09 .11 .10 .06
Fath. Overall HH Score
.11 -.10 .05 -.08 -.18 -.16 .14 .03 -.05 -.22* -.09 .01 -.22* -.10 -.10 .04 .01 -.06
Fam. Overall HH Score
.13 -.03 .04 -.04 -.04 -.12 .17 .04 -.11 -.19 -.11 .02 -.21* -.09 -.11 .09 .07 <.01
Note. **. Correlation is significant at the .01 level (2-tailed). *. Correlation is significant at the .05 level (2-tailed).
Table 6
Child Item Response (Post-Intervention) By Child Demographic Correlation Matrix
Post Intervention Item Response Variables
Nm 1 Nm 2 Nm 3 Ge 1 Ge 2 Ge 3 Ad 1 Ad 2 Ad 3 Sb 1 Sb 2 Sb 3 Me 1 Me 2 Me 3 TM 1 TM 2 TM 3
Chil d De mogra p hic Cov ari ate s o f Inte rest Baseline Age
(Mon.) .08 .09 .15* .17* .23** .17* .13 .23** .22** .26** .13* .17* .23** .23** .11 .10 .18* .22** Sex -.05 -.02 .05 .09 <.01 -.03 -.01 .10 -.01 -.05 .01 .01 .07 -.02 .04 .04 -.07 .06 African Am.
Race -.06 -.09 -.03 .05 -.03 -.06 -.02 -.12 -.01 -.13 <.01 -.05 .01 -.04 -.03 -.02 -.04 .02 Caucasian Race .03 .08 .02 -.01 .02 <.01 <.01 .06 -.05 .04 .06 .11 -.02 .04 .01 .03 -.01 -.03 Hispanic Race .03 -.03 .04 -.05 .03 .06 .03 .05 .05 .05 -.03 -.09 <.01 -.01 .04 -.06 .06 .04 Asian Race .01 .06 .03 -.01 .07 .07 .05 .06 .03 .08 -.03 -.03 .03 .02 .02 .02 .09 -.10 Mixed Race .01 .08 -.06 -.01 -.06 -.01 -.05 .02 <.01 .07 -.04 .07 -.01 .03 -.02 .11 -.05 .02 Student IQ .04 .27** .15* .15* .34** .26** .29** .23** .19* .28** .14* .13 .27** .24** .24** .07 .14 .15* Grade Level .08 .06 .15* .17* .21** .16* .11 .20** .24** .26** .14* .15* .24** .24** .06 .11 .21** .22** Mother Ed.
(Yrs) .02 -.11 -.04 -.02 -.09 -.07 -.07 -.04 -.10 -.10 .05 .08 -.16* -.13 -.14* .11 .01 <.01 Moth. HH Occ.
Score .06 -.12 -.06 -.13 -.05 -.08 -.10 .04 -.06 .02 -.12 .06 -.15* -.11 .01 .09 .11 <.01 Fath. Ed. (Yrs) .01 -.01 .03 -.03 -.11 -.05 -.03 .02 -.13 -.02 .05 .02 -.16 -.09 -.06 .13 -.05 -.05 Fath. HH Occ.
Score .12 -.06 .06 -.09 -.08 -.13 .01 .08 .02 -.01 -.02 .03 -.04 -.05 -.10 .12 -.03 -.11 Moth. Overall
HH Score .06 -.14* -.06 -.13 -.07 -.09 -.12 .01 -.06 -.02 -.10 .07 -.18* -.16* -.04 .09 .09 -.01 Fath. Overall
HH Score .10 -.07 .06 -.10 -.08 -.12 -.02 .06 -.02 -.02 -.01 .03 -.07 -.07 -.09 .14 -.02 -.11 Fam. Overall
HH Score .07 -.12 -.03 -.16* -.10 -.13 -.08 .02 -.04 -.02 -.05 .08 -.15* -.15* -.05 .11 .06 -.06
< .01, Measurement Item 1 at r = .41, p < .01, and Time and Money Item 3 at r = .37, p < .01.
At the post intervention time point, the correlation between student IQ and Geometry Item 2 response was the only correlation of magnitude above .33, r = .34, p < .01.
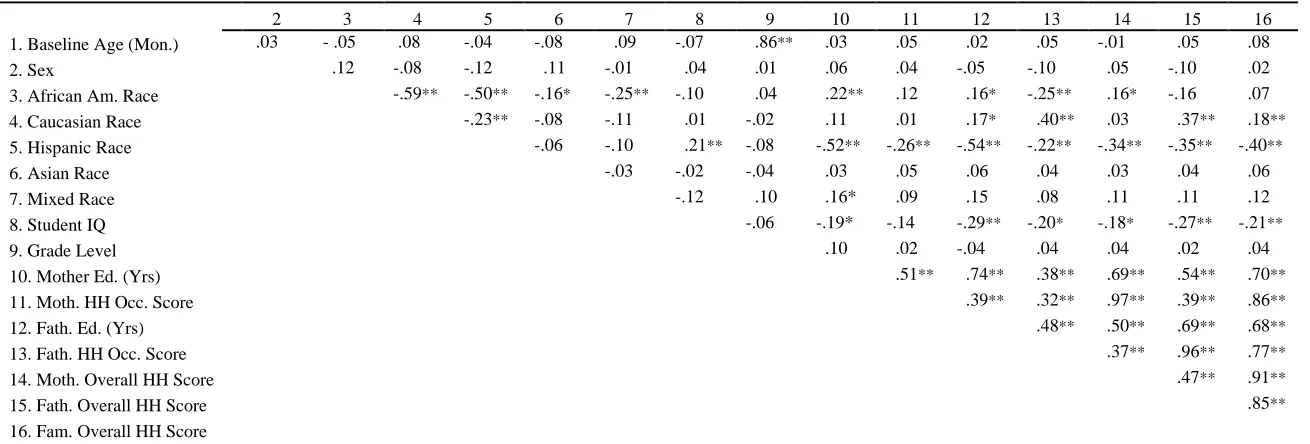
Finally, potential child-level demographic covariates were examined for redundancy in a
bivariate correlation matrix with themselves. The primary foci of this analysis were age, grade level and IQ, as these had been implicated in correlations with child-language profile variables
and the outcome variables of interest. As might be expected, the bivariate correlation between child age and grade level indicated colinerarity between these two variables, r=.86, p<.01; therefore, only child grade-level was controlled for as a covariate in subsequent multilevel
analyses.
IQ did not have any significant correlations above .30 with other child-level demographic
variables of interest. However, because (1) IQ only displayed low to moderate correlations with predictor and outcome variables in this analysis, (2) only 206 of the 244 children in the sample had IQ data, and (3) IQ information was not missing at random (schools displayed different
patterns of IQ missing data and some schools did not provide IQ data for any of their child participants in the study), it was not selected as a control variable in the final, multilevel model
analysis. The contribution of student IQ was more closely examined in factor analyses of child language profile, in which the child language profile latent factor was examined both with and without IQ as a control variable. Table 7 displays the full child-demographic variable bivariate
correlation matrix.
Item Level Correlations and Covariates.
Item linguistic complexity was operationally defined with the following indicators: mean