www.impactjournals.com/oncotarget/ Oncotarget, Vol. 6, No. 36
An mRNA expression signature for prognostication in de novo
acute myeloid leukemia patients with normal karyotype
Ming-Kai Chuang1,*, Yu-Chiao Chiu2,5,*, Wen-Chien Chou1,3, Hsin-An Hou3,
Mei-Hsuan Tseng3, Yi-Yi Kuo1,3, Yidong Chen5,6, Eric Y. Chuang2,4, Hwei-Fang Tien3
1Department of Laboratory Medicine, National Taiwan University Hospital, Taipei, Taiwan
2Graduate Institute of Biomedical Electronics and Bioinformatics, National Taiwan University, Taipei, Taiwan 3Department of Internal Medicine, National Taiwan University Hospital, Taipei, Taiwan
4Bioinformatics and Biostatistics Core, Center of Genomic Medicine, National Taiwan University, Taipei, Taiwan
5 Greehey Children’s Cancer Research Institute, University of Texas Health Science Center at San Antonio, San Antonio, Texas, United States of America
6 Department of Epidemiology and Biostatistics, University of Texas Health Science Center at San Antonio, San Antonio, Texas, United States of America
*These authors have contributed equally to this work
Correspondence to:
Wen-Chien Chou, e-mail: wchou@ntu.edu.tw Eric Y. Chuang, e-mail: chuangey@ntu.edu.tw Hwei-Fang Tien, e-mail: hftien@ntu.edu.tw
Keywords: acute myeloid leukemia, normal cytogenetics, mRNA signature, prognosis
Received: July 19, 2015 Accepted: August 30, 2015 Published: October 23, 2015
ABSTRACT
Although clinical features, cytogenetics, and mutations are widely used to predict prognosis in patients with acute myeloid leukemia (AML), further refinement of risk stratification is necessary for optimal treatment, especially in cytogenetically normal (CN) patients. We sought to generate a simple gene expression signature as a predictor of clinical outcome through analyzing the mRNA arrays of 158 de novo CN AML patients. We compared the gene expression profiles of patients with poor response to induction chemotherapy with those who responded well. Forty-six genes expressed differentially between the two groups. Among them, expression of 11 genes was significantly associated with overall survival (OS) in univariate Cox regression analysis in 104 patients who received standard intensive chemotherapy. We integrated the z-transformed expression levels of these 11 genes to generate a risk scoring system. Higher risk scores were significantly associated with shorter OS (median 17.0 months vs. not reached, P < 0.001) in ours and another 3 validation cohorts. In addition, it was an independent unfavorable prognostic factor by multivariate analysis (HR 1.116, 95% CI 1.035~1.204, P = 0.004). In conclusion, we developed a simple mRNA expression signature for prognostication in CN-AML patients. This prognostic biomarker will help refine the treatment strategies for this group of patients.
INTRODUCTION
“Precision medicine” has become a state-of-the-art principle in clinical care. As a highly heterogeneous disease, acute myeloid leukemia (AML) requires precise risk stratification to achieve optimal treatment outcomes for the patients. Although several clinical and genetic factors have been widely incorporated into clinical consideration for choosing treatment regimens, more
prognostic factors would be welcome as there are still factors not yet being sorted out completely. Cytogenetics has long been considered the most important prognostic factor for AML, however, about one-half of the patients are cytogenetically normal (CN); this group of patients need further prognostic factors for risk stratification [1]. Recently, several genetic mutations with prognostic significance, such as internal tandem duplication of FLT3
have partially compensated for the problem. However, about 24% CN-AML patients have no detectable mutations in these genes [2]. Although the expression levels of genes such as BAALC [7], MN1 [8], and ERG [9] provide further reference for prognostication in this group of patients, the significance of single gene expression remains restrictive in the context of a complicated cellular milieu.
DNA microarray technology makes it possible to evaluate the global gene expression profiling of cells. Studies have shown distinct genetic expression profiles in AML with different cytogenetics and gene mutations [10–12]. While gene expression signature-derived scoring systems bear prognostic values in AML [11, 13–20], it is rarely used in clinical practice, mainly because of the large gene numbers in those scoring systems, usually dozens to hundreds of probes. For example, Shaughnessy
et al. developed a 70-gene expression scoring system to identify patients with shorter progression-free survival (PFS) and overall survival (OS) in multiple myeloma [21]. Subsequently they simplified the system to 5 genes which carried the most discriminatory power of the 70-gene risk model with similar predictive values [22].
We realize that a considerable portion of CN-AML patients still need reliable parameters for choosing optimal treatment strategies. In this study, we developed a simple gene expression signature with prognostic significance by incorporating limited number of probes through comprehensive analysis of the gene expression profiles from our CN-AML patients. Using ours as a discovery set, we validated our results with three other independent CN-AML cohorts, which are available from public domains. Furthermore, we explored the possible molecular pathways underlying this signature.
RESULTS
Identification of genes with prognostic significance
We recruited a total of 351 adult patients (≥15 years of age) with newly diagnosed de novo AML from 1995 to 2011 at the National Taiwan University Hospital (NTUH), who had adequate cryopreserved bone marrow cells for mRNA array studies. Patients with antecedent hematological malignancies or therapy-related AML were excluded. We focused on the 158 patients (45.0%) with CN-AML. Among these patients, 104 (65.8%) received standard intensive chemotherapy. We analyzed the array data of the 158 CN-AML patients for global gene expression profiles. The expression data were processed and normalized to eliminate systematic biases and facilitate further statistical analyses. Since this study is a retrospective analysis with a group of patients spanning for almost 20 years, we aimed to eliminate biases as much as possible by using the response to induction chemotherapy as a criterion for dividing the patients into two groups,
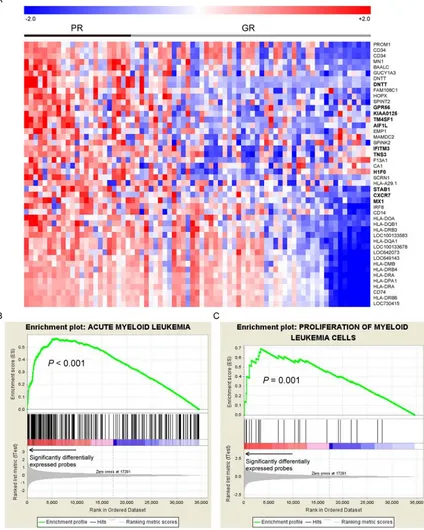
one with good response (GR group, 56 patients) who achieved continuous complete remission without relapse and the other with poor response (PR group, 19 patients) who were refractory to the induction chemotherapy. We compared gene expression profiles between the two groups and identified 46 differentially expressed probes (Student’s
t-test P value < 0.05 and > 2-fold change). These probes corresponded to 43 unique genes. Interestingly, all of the 46 probes were up-regulated in the PR group. Heatmap visualization of these probes were performed using the Genesis software (Fig. 1A) [23].
Analysis of functional annotations of 43 genes In order to dissect the biological functions underlying the 43 genes that likely affect chemosensitivity, we analyzed their functional annotations using the Ingenuity Pathway Analysis (IPA) [24] software. The genes were associated with abundant biological functions related to leukemia (data available upon request). Eight genes (BAALC, CD14, CD34, CD74, DNTT,
HLA-DRA, IRF8, and MN1) were all associated with “leukemia” (P = 1.15 × 10⁻⁴), “acute myeloid leukemia” (P = 9.37 × 10⁻³), and “proliferation of myeloid cells” (P = 0.044). We further utilized Gene Set Enrichment Analysis (GSEA) [25] to verify the results derived from IPA. GSEA is an enrichment analysis algorithm that features threshold-free input (i.e., global gene profiles). It analyzes whether genes sharing a common function exhibit a global trend toward up-regulation (or down-regulation) in a given condition, measured by enrichment scores and permutation-based empirical P-values. Notably, genes related to the three associated terms (diseases and biological functions) obtained from IPA showed significant enrichment in the PR/GR differential gene expression profiles: the empirical P-values were <0.001 for functions related to acute myeloid leukemia and leukemia, and P = 0.001 for the proliferation of myeloid cells (enrichment plots in Fig. 1B–1C and Fig. S1). These 3 functional categories related genes contributed to a major fraction of the enrichment score, namely the leading-edge components. Appearing in leading-edge components of all three functions were ABL proto-oncogene 1 non-receptor tyrosine kinase (ABL1), B-cell CLL/lymphoma 2 (BCL2), and CD33 molecule (CD33).
Construction of a risk scoring system
In order to construct a risk scoring system, we analyzed the prognostic significance of expression of the 43 genes in survival. The survival analysis was conducted from the 104 patients (out of the 158 patients) who received standard intensive chemotherapy. Among the 46 probes associated with treatment response, 11 were significantly associated with OS (univariate Cox
Figure 1: A. The heatmap of the 46 differential expressed probes between the 19 patients with poor response (PR group) to the first induction chemotherapy and the 56 achieving continuous complete remission (GR group).
[image:3.612.95.519.55.585.2](full gene list and results in Table 1; highlighted by boldface in Fig. 1A), and higher expression of each of these genes was associated with unfavorable prognosis (Kaplan Meier curves in Fig. S2). Based on the results we built a scoring system by incorporating the z-values (normalized gene expression levels, as defined in the Materials and Methods section) of the 11 genes with equal unity of weight to calculate a risk score for each patient. The risk score was significantly predictive of OS (univariate Cox P = 1.37 × 10⁻⁶ and log-rank P = 1.07 × 10⁻⁵; Fig. 2A), and disease free survival (DFS) (univariate Cox
P = 1.16 × 10⁻⁷ and log-rank P = 9.71 × 10⁻⁷, Fig. S3). We further applied random permutation to evaluate the performance of our proposed scoring system against a random baseline (detailed in the Materials and Methods section). Remarkably, the scoring system outperformed all of ten-thousand random systems iteratively constructed by random selections of 11 genes from the dataset (empirical
P-value <1.00 × 10⁻⁴, see the Materials and Methods section), suggesting the non-randomness of performance achieved by the proposed risk score.
For validation analysis we used three independent gene expression datasets from two studies, one from The Cancer Genome Atlas (TCGA) [26] and two (GSE12417-GPL96 and GSE12417-GPL570) from the study of Metzeler
et al. [17]. The prognostic significance of higher risk score for unfavorable OS was validated by these independent cohorts of CN-AML (log rank P = 0.01, 0.004, and 0.001 in TCGA (N = 97), GSE12417-GPL96 (N = 163), and GSE12417-GPL570 (N = 79), respectively) (Fig. 2B, 2C and 2D).
We compared the performance of this 11-gene to the 7-gene risk scoring system proposed from another study [20]. Although the two scoring systems do not share any genes, they had equivalent prediction performance as shown by the similar P values in the three validation cohorts (Table 2). This was further confirmed by a multivariate analysis that incorporates these two scoring systems as co-variables (data not shown).
Association of the scoring system with clinical and molecular characteristics
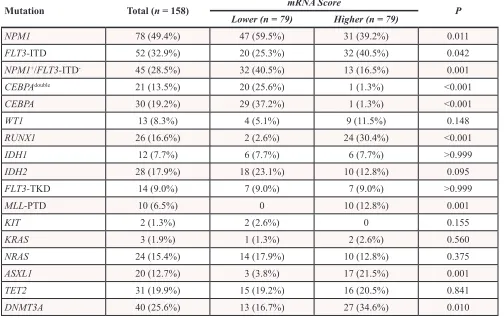
A higher risk score was positively associated with older age, lower count of white blood cells, and higher count of platelets (Table 3). FAB M1 leukemia occurred less frequently in the higher score group. The profiles of genetic mutations were significantly different between higher and lower score groups: patients with higher scores more often had FLT3-ITD, RUNX1, MLL-PTD, ASXL1, and DNMT3A mutations, but less likely had NPM1 and
CEBPA mutations (Table 4). In particular, nearly all
CEBPA-mutated patients were in the lower score group, whereas all MLL-PTD mutated patients were in the higher score group.
Survival analysis
[image:4.612.60.556.474.715.2]The univariate analysis of the clinical parameters and molecular alterations on OS in our CN-AML patients was shown in Table S1. Since higher risk scores seemed to be highly associated with other poor prognostic
Table 1: The list of 11 genes whose expression were significantly associated with overall survival
among the 46 probes differential expressed between the patients with good and poor treatment
response
Probe Gene Description Univariate Cox P Hazard ratio 95% confidence interval
1410021 AIF1L allograft inflammatory factor 1-like 2.01E-03 1.657 1.203–2.284 450424 CXCR7 atypical chemokine receptor 3 1.00E-03 1.663 1.228–2.251 6280243 DNTT DNA nucleotidylexotransferase 9.10E-03 1.471 1.101–1.966 5490768 GPR56 G protein-coupled receptor 56 6.86E-03 1.617 1.141–2.291
630278 H1F0 H1 histone family, member 0 7.03E-03 1.619 1.140–2.298
6650242 IFITM3 interferon induced transmembrane protein 3 1.96E-04 2.152 1.438–3.222
3780647 KIAA0125 KIAA0125 5.06E-03 1.558 1.143–2.125
1690066 MX1 MX dynamin-like GTPase 1 5.81E-03 1.618 1.150–2.279
6040053 STAB1 stabilin 1 7.39E-03 1.566 1.128–2.174
2680110 TM4SF1 transmembrane 4 L six family member 1 5.93E-05 1.869 1.377–2.537
Figure 2: The Kaplan Meier curves for OS according to the scores. A. In NTUH discovery set, patients with higher scores have significant shorter OS than those with lower scores (median 17.0 months vs. not reached, P < 0.001); B–D. In the three validation cohorts, the higher scores are all associated with poorer OS (median 12.2 vs 21.3 months, log rank P = 0.01 in TCGA; median 8.4 vs 24.7 months, log rank P = 0.004 in GSE12417-GPL96; median 10.1 vs 42.6 months, log rank P = 0.001 in GSE12417-GPL570).
Table 2: Comparison between ours and the published 7-gene scoring system by univariate analysis
Dataset
11-gene risk score 7-gene unweighted score (Marcucci et al. 2014)
Hazard
ratio 95% confidence interval P value* Hazard ratio 95% confidence interval P value*
NTUH (N = 104) 1.12 1.07~1.18 1.4 × 10⁻⁶ 1.29 1.06~1.56 0.012
TCGA (N = 97) 1.05 1.00~1.09 0.042 1.16 1.01~1.33 0.035
[image:5.612.58.558.589.713.2]variables, we sought to investigate whether our scoring system functioned as an independent factor. We included variables that were significantly associated with clinical outcome from univariate analysis, including age, ELN (European LeukemiaNet) genetic group, MLL, RUNX1,
TET2 mutations, and mRNA score, for multivariate analysis. We found higher scores appeared to be a strong independent risk factor (Table 5).
Biological functions associated with the scoring system
To gain biological insights into the risk scores, we further analyzed genes that were differentially expressed in patients with higher or lower risk scores. Patients with risk scores above and below the average by one standard deviation in the NTUH dataset were defined as the high-risk and low-high-risk groups, respectively. We identified 578 differentially expressed probes (Student’s t-test P < 0.05 and >2-fold change) that corresponded to 509 unique genes. In the list, we identified some homeobox genes up-regulated in high-risk patients, including HOXA3
(t-test P = 4.56 × 10⁻⁵), HOXA5 (P = 2.73 × 10⁻⁷), HOXA6 (P = 3.34 × 10⁻⁷), HOXA9 (P = 4.72 × 10⁻⁸), HOXA10 (P = 5.83 × 10⁻⁸), HOXB2 (P = 5.95 × 10⁻⁸), HOXB3 (P = 5.61 × 10⁻⁵), HOXB4 (P = 1.37 × 10⁻⁶), HOXB5 (P = 3.90 × 10⁻⁶), HOXB6 (P = 2.65 × 10⁻³), HOXB7 (P = 2.21 × 10⁻³), HOXB8 (P = 1.78 × 10⁻²), MEIS1 (P = 6.18 × 10⁻⁷), and PBX3 (P = 5.02 × 10⁻⁴). The homeobox genes are well known for their crucial functions in stemness maintenance, and adverse prognosis in AML when their expression levels are elevated [15, 27, 28]. Furthermore, IPA revealed significant associations between the 509 differentially expressed genes with abundant important biological functions in AML (data available upon request), including proliferation of blood cells (P = 2.25 × 10⁻¹⁰), cell death of leukemia cell lines (P = 2.41 × 10⁻⁹), differentiation of hematopoietic progenitor cells (P = 9.85 × 10⁻⁷), and quantity of hematopoietic progenitor cells (P = 4.06 × 10⁻⁵). All of these functions were validated with significant enrichment by GSEA (empirical P-values all < 0.001; enrichment plots in Fig. 3 and Fig. S4). Taken together, our data indicate that the 11-gene scoring system modulates the treatment
Table 3: Correlation between mRNA score and clinical and laboratory features in CN-AML
patients (n = 158)
Variant Total mRNA Score P
Low (n = 79) High (n = 79)
Age* (years) 58 (16–90) 55 (18–87) 62 (16–90) 0.027
Age, in groups
>60 76 (48.1%) 32 (40.5%) 44 (55.7%) 0.056
>50 97 (61.4%) 43 (54.4%) 54 (68.4%) 0.072
Gender
male 90 (57.0%) 44 (55.7%) 46 (58.2%) 0.748
Lab data*
WBC (×103/μL) 28.88 (0.65–423.0) 41.38 (0.98–423.0) 24.72 (0.65–341.4) 0.042 Blasts (×103/μL) 13.77 (0–342.1) 18.69 (0–342.1) 10.78 (0–310.7) 0.056 Hemoglobin, g/dL 8.1 (3.7–14.0) 8.3 (4.2–14.0) 7.9 (3.7–13.2) 0.173 Platelets (×103/μL) 53.0 (6–331) 42.0 (6–214) 60.0 (9–331) 0.006 LDH (U/L) 878.0 (274–13130) 960.0 (354–13130) 804.0 (274–7177) 0.053
FAB 0.156
M0 2 (1.3%) 0 2 (2.5%) 0.155
M1 37 (23.4%) 24 (30.4%) 13 (16.5%) 0.039
M2 53 (33.5%) 28 (35.4%) 25 (31.6%) 0.613
M4 52 (32.9%) 22 (27.8%) 30 (38.0%) 0.176
M5 12 (7.6%) 4 (5.1%) 8 (10.1%) 0.230
M6 2 (1.3%) 1 (1.3%) 1 (1.3%) >0.999
[image:6.612.61.561.67.423.2]response of CN-AML patients through regulation of several crucial cellular functions.
DISCUSSION
In this study, we grouped the patients by their responses to induction chemotherapy in order to identify genes related to drug sensitivity. By this approach, we aimed to eliminate potential biases raised from our retrospective cohort. IPA analysis showed that 43 differentially expressed genes were closely related to biological functions associated with “leukemia”, “acute myeloid leukemia”, and “proliferation of myeloid
cells”. Moreover, using GSEA, we found ABL1, BCL2, and CD33 were among leading-edge components of all three functional categories. Expression of BCL2, both at transcriptional and translational levels, is known to correlate with poor treatment responses to chemotherapy and low complete remission rates in AML [29–31]. While ABL1 has been relatively unexplored in AML, it has been implied for association with the resistance of chemotherapy in chronic myeloid leukemia [32]. Our data indicated these genes may be highly involved in crucial biological functions that determined treatment response.
[image:7.612.57.561.56.374.2]A high risk score was associated with unfavorable mutations (FLT3-ITD, MLL-PTD, ASXL1, RUNX1,
Table 4: Correlation of mRNA score with other gene alterations
Mutation Total (n = 158) mRNA Score P
Lower (n = 79) Higher (n = 79)
NPM1 78 (49.4%) 47 (59.5%) 31 (39.2%) 0.011
FLT3-ITD 52 (32.9%) 20 (25.3%) 32 (40.5%) 0.042
NPM1+/FLT3-ITD- 45 (28.5%) 32 (40.5%) 13 (16.5%) 0.001
CEBPAdouble 21 (13.5%) 20 (25.6%) 1 (1.3%) <0.001
CEBPA 30 (19.2%) 29 (37.2%) 1 (1.3%) <0.001
WT1 13 (8.3%) 4 (5.1%) 9 (11.5%) 0.148
RUNX1 26 (16.6%) 2 (2.6%) 24 (30.4%) <0.001
IDH1 12 (7.7%) 6 (7.7%) 6 (7.7%) >0.999
IDH2 28 (17.9%) 18 (23.1%) 10 (12.8%) 0.095
FLT3-TKD 14 (9.0%) 7 (9.0%) 7 (9.0%) >0.999
MLL-PTD 10 (6.5%) 0 10 (12.8%) 0.001
KIT 2 (1.3%) 2 (2.6%) 0 0.155
KRAS 3 (1.9%) 1 (1.3%) 2 (2.6%) 0.560
NRAS 24 (15.4%) 14 (17.9%) 10 (12.8%) 0.375
ASXL1 20 (12.7%) 3 (3.8%) 17 (21.5%) 0.001
TET2 31 (19.9%) 15 (19.2%) 16 (20.5%) 0.841
DNMT3A 40 (25.6%) 13 (16.7%) 27 (34.6%) 0.010
Table 5: Multivariate analysis (Cox regression) for the OS in CN-AML cohort
Variables Hazard ratio 95% confidence interval P value
Age 1.030 1.006~1.054 0.012
ELN genetic group¶ 1.191 0.472~3.004 0.711
MLL# 1.058 0.289~3.868 0.932
RUNX1# 0.653 0.261~1.635 0.363
TET2# 2.876 1.234~6.701 0.014
mRNA score 1.146 1.061~1.238 0.001
[image:7.612.57.561.407.528.2]and DNMT3A mutations) but inversely associated with favorable ones (NPM1 and CEBPA mutations). Radmacher
et al. showed a strong correlation between the prognostic classifier and the status of FLT3-ITD, but not that of
MLL-PTD, NPM1, or CEBPA mutations [16]. In addition, Metzeler et al. demonstrated that a high risk signature was associated with FLT3-ITD, WT1, RUNX1, and TET2
mutations, but inversely associated with CEBPA mutations [18]. Nevertheless, we demonstrated the independence of our signature from other important prognostic factors. These observations suggest that our scoring system bears similar biological implications to other parameters on clinical outcome yet stands alone as a new tool for prediction of treatment response.
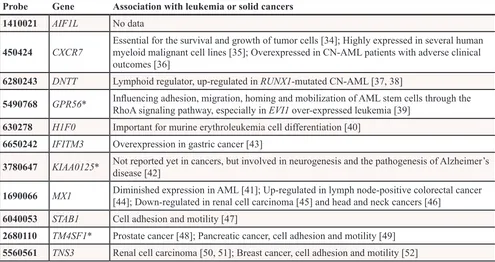
We constructed a simple mRNA signature as a prognostication tool based on the expression levels of 11 genes for CN-AML patients, a subgroup in which the requirement of prognostic parameters is yet unmet. Several study groups have developed gene expression signature for predicting prognosis in AML patients. In six studies [15– 20, 33], the results were validated by independent datasets, as in ours. The 11 gene signature of our mRNA scoring system included GPR56, KIAA0125, TM4SF1, AIF1L,
CXCR7, DNTT, H1F0, IFITM3, MX1, STAB1, and TNS3; only the first three were seen in another mRNA signature [17], reflecting the variations in study populations or treatment protocols. Although there was no overlap of the genes between our proposed scoring system and the 7-gene signature proposed from an epigenetic study [20] or the 24-gene score improving the ELN classification
[33], our system-derived scores were moderately correlated with the scores from the two studies (correlation coefficients, 0.68 and 0.45, respectively, data not shown). Such concordance implies these prognostic scores, though derived from different analysis schemes, might represent common underlying biological mechanisms. Future study may further address this in a larger AML cohort. Current knowledge about the association between the 11 genes and malignancies is summarized in Table 6. In some studies aberrant expression of CXCR7 [34–36], DNTT
[37, 38], GPR56 [39], H1F0 [40], and MX1 [41] is seen in leukemia. Little is known about the role of AIF1L and
KIAA0125 [42] in pathogenesis of cancers. IFITM3 [43],
MX1 [44–46], STAB1 [47], TM4SF1 [48, 49], and TNS3
[50–52] may have roles in various solid cancers, but they are not yet explored in AML. STAB1 [47], TM4SF1 [49], and TNS3 [52] are involved in cell adhesion and motility, which are relevant to cancer metastasis and invasion, however, their roles in interaction between leukemic stem cells and bone marrow niche deserve further investigation.
[image:8.612.73.547.52.289.2]In conclusion, we present a simple mRNA expression scoring system for prognostication of CN-AML. The scoring system was validated by three independent cohorts and has comparable performance as the system proposed by Marcucci et al. [20]. Our scoring system is composed of only 11 genes, making it highly potential in clinical use. Its positive association with multiple clinically relevant gene mutations suggests that it has incorporated the prognostic implications of multiple conventional risk factors. Our scoring system may
provide another prognostic reference other than genetic mutations currently used for CN-AML. However, a large prospective cohort in which a q-PCR-based measurement of the expression of the 11 genes is necessary for clinical application of this scoring system.
MATERIALS AND METHODS
Patients
We recruited a total of 351 adult patients (≥15 years of age) with newly diagnosed de novo AML from 1995 to 2011 at the National Taiwan University Hospital (NTUH), who had adequate cryopreserved bone marrow cells for mRNA array studies. Patients with antecedent hematological malignancies or therapy-related AML were excluded. The bone marrow specimens were harvested by bone marrow aspiration. The mononuclear cells were isolated by treating with Ficoll-Paque. This study was performed in accordance with the Declaration of Helsinki and was approved by the Research Ethics Committee of the NTUH. We focused on the 158 patients (45.0%) with CN-AML. Among these patients, 104 (65.8%) received standard intensive chemotherapy as described previously [53]. Briefly, they received induction chemotherapy (idarubicin 12 mg/m2 per day on days 1 to 3 and cytarabine 100 mg/m2 per day on days 1 to 7) and then consolidation chemotherapy with 2 to 4 courses of high-dose cytarabine (2000 mg/m2 every 12 hours; total 8 doses), with or without an anthracycline (idarubicin or mitoxantrone), after achieving complete remission (CR).
The remaining 54 patients were treated with palliative care or low-dose chemotherapy due to patients’ preference or poor performance status. All 158 patients were included for analyses of correlation between the risk score and clinical and other biological parameters, but only the 104 patients who received standard intensive chemotherapy were included for survival analysis. Forty of the 104 patients received allogeneic hematopoietic stem cell transplantation (HSCT); they were censored on the day of stem cell infusion to avoid confounding factors brought by the HSCT therapy. In the survival analysis, >90% statistical power can be achieved based on a sample of at least 93 patients (at a 0.01 significance level to detect a hazard ratio of 2; calculated by PASS software (NCSS, Kaysville, Utah)).
Cytogenetic and mutation analysis
Chromosomal abnormalities and gene mutations were analyzed as described previously [3, 53–56].
[image:9.612.59.554.65.327.2]mRNA microarray analysis and data processing We profiled whole-genome gene expression of 158 patients using Illumina HumanHT-12 v4 Expression BeadChip (Illumina, San Diego, CA), following the manufacturer’s instructions. Briefly, we verified RNA concentration and integrity with ND-1000 spectrophotometer (NanoDrop Technologies, Wilmington, DE) and 2100 Bioanalyzer (Agilent Technologies, Palo Alto, CA). 1.5 μg cRNA of each sample was hybridized
Table 6: Summary of the association between 11 genes and malignancy
Probe Gene Association with leukemia or solid cancers 1410021 AIF1L No data
450424 CXCR7 Essential for the survival and growth of tumor cells [34]; Highly expressed in several human myeloid malignant cell lines [35]; Overexpressed in CN-AML patients with adverse clinical outcomes [36]
6280243 DNTT Lymphoid regulator, up-regulated in RUNX1-mutated CN-AML [37, 38]
5490768 GPR56* Influencing adhesion, migration, homing and mobilization of AML stem cells through the RhoA signaling pathway, especially in EVI1 over-expressed leukemia [39]
630278 H1F0 Important for murine erythroleukemia cell differentiation [40]
6650242 IFITM3 Overexpression in gastric cancer [43]
3780647 KIAA0125* Not reported yet in cancers, but involved in neurogenesis and the pathogenesis of Alzheimer’s disease [42]
1690066 MX1 Diminished expression in AML [41]; Up-regulated in lymph node-positive colorectal cancer [44]; Down-regulated in renal cell carcinoma [45] and head and neck cancers [46]
6040053 STAB1 Cell adhesion and motility [47]
2680110 TM4SF1* Prostate cancer [48]; Pancreatic cancer, cell adhesion and motility [49]
to Illumina HumanHT-12 v4 Expression BeadChip. Intensities of bead fluorescence were detected with Illumina BeadArray Reader (Illumina, San Diego, CA), followed by transformation to numeric values using GenomeStudio v2010.1 software (Illumina, San Diego, CA). We performed Log-2 transformation and quantile normalization for the data to achieve normalized probe-level expression values. The microarray data have been deposited in the Gene Expression Omnibus (accession number: GSE71014).
External dataset processing
For validation analysis we included three independent gene expression datasets from two studies, one from The Cancer Genome Atlas (TCGA) [26] and two (GSE12417-GPL96 and GSE12417-GPL570) from the study of Metzeler et al. [17]. The TCGA dataset was composed of gene expression profiles from 197 AML samples (97 CN) achieved by Affymetrix Human Genome U133 Plus 2.0 Array. Level-2 data, which were probe-level pre-normalized signals processed by TCGA, were downloaded and transformed into Log-2 scale. The two datasets from the study by Metzeler et al., including 163 and 79 CN-AML patients, respectively, were profiled with Affymetrix Human Genome U133 Plus 2.0 Array. We used the authors’ pre-processed datasets deposited in the Gene Expression Omnibus (GEO, accession ID GSE12417) [57]. In the three datasets, each of the genes with multiple probes was represented by the most “informative” probe that carried the largest coefficient of variation, defined as the ratio of per-probe standard deviation to per-probe average.
Statistical analysis
Statistical significance of differential expression of genes between two groups of samples was assessed using Student’s t-test. For survival analysis, expression values of each dataset were first z-transformed (i.e., subtraction of sample mean followed by division by sample standard deviation for each probe) to approximately follow the normal distribution (zero mean and unity standard deviation). We then utilized the univariate Cox proportional hazards model to determine association between expression of individual genes and patient survival.
We employed a ten-thousand-time random permutation test to evaluate the performance and randomness of constructed risk scoring system with the process as described previously [58]. Briefly, in each of the ten thousand iterations a random system was constructed by substituting the genes in the proposed scoring system with randomly selected ones from the microarray dataset. Each random system was tested for survival significance. After all iterations, significance of the proposed system was measured by the empirical P-value, which was simply
the fraction of random risk systems that achieved higher Cox significance than the proposed system.
We adopted Kaplan-Meier estimation to plot survival curves and used log-rank tests to examine the difference between groups. The patients who received allogeneic HSCT were censored on the day of cell infusion. Hazard ratio and 95% confidence interval were estimated by Cox proportional hazards regression models to determine independent risk factors associated with survival in multivariate analyses. For analysis of differential expression, two-sided P values from Student’s t-test less than 0.05 were considered statistically significant. The whole patient population was included for analyses of correlation between the risk score and clinical characteristics and molecular alternations; however, only those receiving conventional standard chemotherapy, as mentioned above, were included in analyses of survivals.
Functional annotation analysis
In order to gain biological insights into identified groups of genes, we further incorporated two functional annotation tools, Ingenuity Pathway Analysis (IPA; Qiagen, Redwood City, CA) [24] and Gene Set Enrichment Analysis (GSEA, Java program downloadable athttp://www.broadinstitute.org/gsea/index.jsp) [25]. IPA is a knowledge-based database that features manual curation of a huge volume of published literatures. It employs Fisher’s exact test to assess the significance of association between biological functions and the set of genes of interest (e.g. differentially expressed genes). We used GSEA to further verify the results of IPA. Instead of analyzing sets of genes of interest, GSEA is designed to detect whether a biological function is enriched in the whole-genome expression pattern; i.e., significant P-value from GSEA indicates significant overall enrichment of genes sharing a common function in genes with differential expressions. Here the gene sets (biological functions) were downloaded from the IPA database. Significance of enrichment was assessed based on the two-thousand-time random permutation test among genes.
CONFLICTS OF INTEREST
The authors declare no conflict of interest.
GRANT SUPPORT
Authors’ contributions
MK Chuang, YC Chiu, WC Chou analyzed the data and wrote the paper. WC Chou and HF Tien and Eric Y. Chuang designed the study and wrote the paper. HA Hou, EY Chuang, MH Tseng, YY Kuo, and Y Chen provided important materials and help in the study.
Editorial note
This paper has been accepted based in part on peer-review conducted by another journal and the authors’ response and revisions as well as expedited peer-review in Oncotarget.
REFERENCES
1. Grimwade D, Walker H, Oliver F, Wheatley K, Harrison C, Harrison G, Rees J, Hann I, Stevens R, Burnett A, Goldstone A. The importance of diagnostic cytogenetics on outcome in AML: analysis of 1,612 patients entered into the MRC AML 10 trial. The Medical Research Council Adult and Children’s Leukaemia Working Parties. Blood. 1998; 92:2322–2333.
2. Dohner K, Schlenk RF, Habdank M, Scholl C, Rucker FG, Corbacioglu A, Bullinger L, Frohling S, Dohner H. Mutant nucleophosmin (NPM1) predicts favorable prognosis in younger adults with acute myeloid leukemia and normal cytogenetics: interaction with other gene mutations. Blood. 2005; 106:3740–3746.
3. Falini B, Mecucci C, Tiacci E, Alcalay M, Rosati R, Pasqualucci L, La Starza R, Diverio D, Colombo E, Santucci A, Bigerna B, Pacini R, Pucciarini A, et al. Cytoplasmic nucleophosmin in acute myelogenous leukemia with a normal karyotype. N Engl J Med. 2005; 352:254–266.
4. Schlenk RF, Dohner K, Krauter J, Frohling S, Corbacioglu A, Bullinger L, Habdank M, Spath D, Morgan M, Benner A, Schlegelberger B, Heil G, Ganser A, et al. Mutations and treatment outcome in cytogenetically normal acute myeloid leukemia. N Engl J Med. 2008; 358:1909–1918.
5. Frohling S, Schlenk RF, Stolze I, Bihlmayr J, Benner A, Kreitmeier S, Tobis K, Dohner H, Dohner K. CEBPA mutations in younger adults with acute myeloid leukemia and normal cytogenetics: prognostic relevance and analysis of cooperating mutations. J Clin Oncol. 2004; 22:624–633. 6. Smith ML, Cavenagh JD, Lister TA, Fitzgibbon J. Mutation
of CEBPA in familial acute myeloid leukemia. N Engl J Med. 2004; 351:2403–2407.
7. Baldus CD, Thiede C, Soucek S, Bloomfield CD, Thiel E, Ehninger G. BAALC expression and FLT3 internal tandem duplication mutations in acute myeloid leukemia patients with normal cytogenetics: prognostic implications. J Clin Oncol. 2006; 24:790–797.
8. Heuser M, Beutel G, Krauter J, Dohner K, von Neuhoff N, Schlegelberger B, Ganser A. High meningioma 1 (MN1) expression as a predictor for poor outcome in acute myeloid leukemia with normal cytogenetics. Blood. 2006; 108:3898–3905.
9. Marcucci G, Baldus CD, Ruppert AS, Radmacher MD, Mrozek K, Whitman SP, Kolitz JE, Edwards CG, Vardiman JW, Powell BL, Baer MR, Moore JO, Perrotti D, et al. Overexpression of the ETS-related gene, ERG, pre-dicts a worse outcome in acute myeloid leukemia with normal karyotype: a Cancer and Leukemia Group B study. J Clin Oncol. 2005; 23:9234–9242.
10. Valk PJ, Verhaak RG, Beijen MA, Erpelinck CA, Barjesteh van Waalwijk van Doorn-Khosrovani S, Boer JM, Beverloo HB, Moorhouse MJ, van der Spek PJ, Lowenberg B, Delwel R. Prognostically useful gene- expression profiles in acute myeloid leukemia. N Engl J Med. 2004; 350:1617–1628.
11. Vey N, Mozziconacci MJ, Groulet-Martinec A, Debono S, Finetti P, Carbuccia N, Beillard E, Devilard E, Arnoulet C, Coso D, Sainty D, Xerri L, Stoppa AM, et al. Identification of new classes among acute myelogenous leukaemias with normal karyotype using gene expression profiling. Oncogene. 2004; 23:9381–9391.
12. Wilson CS, Davidson GS, Martin SB, Andries E, Potter J, Harvey R, Ar K, Xu Y, Kopecky KJ, Ankerst DP, Gundacker H, Slovak ML, Mosquera-Caro M, et al. Gene expression profiling of adult acute myeloid leukemia iden-tifies novel biologic clusters for risk classification and out-come prediction. Blood. 2006; 108:685–696.
13. Okutsu J-i Tsunoda T, Kaneta Y, Katagiri T, Kitahara O, Zembutsu H, Yanagawa R, Miyawaki S, Kuriyama K, Kubota N, Kimura Y, Kubo K, Yagasaki F, et al. Prediction of Chemosensitivity for Patients with Acute Myeloid Leukemia, According to Expression Levels of 28 Genes Selected by Genome-wide Complementary DNA Microarray Analysis. Mol Cancer Ther. 2002; 1:1035–1042. 14. Yagi T, Morimoto A, Eguchi M, Hibi S, Sako M,
Ishii E, Mizutani S, Imashuku S, Ohki M, Ichikawa H. Identification of a gene expression signature associated with pediatric AML prognosis. Blood. 2003; 102:1849–1856. 15. Bullinger L, Dohner K, Bair E, Frohling S, Schlenk RF,
Tibshirani R, Dohner H, Pollack JR. Use of gene-expression profiling to identify prognostic subclasses in adult acute myeloid leukemia. N Engl J Med. 2004; 350:1605–1616. 16. Radmacher MD, Marcucci G, Ruppert AS, Mrozek K,
Whitman SP, Vardiman JW, Paschka P, Vukosavljevic T, Baldus CD, Kolitz JE, Caligiuri MA, Larson RA, Bloomfield CD. Independent confirmation of a prognostic gene-expression signature in adult acute myeloid leukemia with a normal karyotype: a Cancer and Leukemia Group B study. Blood. 2006; 108:1677–1683.
Marcucci G, Whitman SP, Maharry K, Paschka P, Larson RA, et al. An 86-probe-set gene-expression signature predicts survival in cytogenetically normal acute myeloid leukemia. Blood. 2008; 112:4193–4201.
18. Metzeler KH, Maharry K, Kohlschmidt J, Volinia S, Mrozek K, Becker H, Nicolet D, Whitman SP, Mendler JH, Schwind S, Eisfeld AK, Wu YZ, Powell BL, et al. A stem cell-like gene expression signature associates with inferior outcomes and a distinct microRNA expression profile in adults with primary cytogenetically normal acute myeloid leukemia. Leukemia. 2013; 27:2023–2031.
19. Gentles AJ, Plevritis SK, Majeti R, Alizadeh AA. Association of a leukemic stem cell gene expression sig-nature with clinical outcomes in acute myeloid leukemia. JAMA. 2010; 304:2706–2715.
20. Marcucci G, Yan P, Maharry K, Frankhouser D, Nicolet D, Metzeler KH, Kohlschmidt J, Mrozek K, Wu YZ, Bucci D, Curfman JP, Whitman SP, Eisfeld AK, et al. Epigenetics meets genetics in acute myeloid leukemia: clinical impact of a novel seven-gene score. J Clin Oncol. 2014; 32:548–556. 21. Shaughnessy JD Jr, Zhan F, Burington BE, Huang Y,
Colla S, Hanamura I, Stewart JP, Kordsmeier B, Randolph C, Williams DR, Xiao Y, Xu H, Epstein J, et al. A validated gene expression model of high-risk multiple myeloma is defined by deregulated expression of genes mapping to chromosome 1. Blood. 2007; 109:2276–2284. 22. Heuck CJ, Qu P, van Rhee F, Waheed S, Usmani SZ,
Epstein J, Zhang Q, Edmondson R, Hoering A, Crowley J, Barlogie B. Five gene probes carry most of the discrimina-tory power of the 70-gene risk model in multiple myeloma. Leukemia. 2014; 28:2410–2413.
23. Sturn A, Quackenbush J, Trajanoski Z. Genesis: cluster analysis of microarray data. Bioinformatics (Oxford, England). 2002; 18:207–208.
24. Kramer A, Green J, Pollard J Jr., Tugendreich S. Causal analysis approaches in Ingenuity Pathway Analysis. Bioinformatics. 2014; 30:523–530.
25. Subramanian A, Tamayo P, Mootha VK, Mukherjee S, Ebert BL, Gillette MA, Paulovich A, Pomeroy SL, Golub TR, Lander ES, Mesirov JP. Gene set enrichment analysis: A knowledge-based approach for interpreting genome-wide expression profiles. Proc Natl Acad Sci U S A. 2005; 102:15545–15550.
26. Cancer Genome Atlas Research N. Genomic and epigenomic landscapes of adult de novo acute myeloid leu-kemia. N Engl J Med. 2013; 368:2059–2074.
27. Thorsteinsdottir U, Kroon E, Jerome L, Blasi F, Sauvageau G. Defining roles for HOX and MEIS1 genes in induction of acute myeloid leukemia. Mol Cell Biol. 2001; 21:224–234.
28. Becker H, Marcucci G, Maharry K, Radmacher MD, Mrozek K, Margeson D, Whitman SP, Wu YZ, Schwind S, Paschka P, Powell BL, Carter TH, Kolitz JE, et al. Favorable prognostic impact of NPM1 mutations in older
leukemia and associated gene- and microRNA-expression signatures: a Cancer and Leukemia Group B study. J Clin Oncol. 2010; 28:596–604.
29. Campos L, Rouault JP, Sabido O, Oriol P, Roubi N, Vasselon C, Archimbaud E, Magaud JP, Guyotat D. High expression of bcl-2 protein in acute myeloid leukemia cells is associated with poor response to chemotherapy. Blood. 1993; 81:3091–3096.
30. Lauria F, Raspadori D, Rondelli D, Ventura MA, Fiacchini M, Visani G, Forconi F, Tura S. High bcl-2 expression in acute myeloid leukemia cells correlates with CD34 positivity and complete remission rate. Leukemia. 1997; 11:2075–2078.
31. Karakas T, Miething CC, Maurer U, Weidmann E, Ackermann H, Hoelzer D, Bergmann L. The coexpression of the apoptosis-related genes bcl-2 and wt1 in predicting survival in adult acute myeloid leukemia. Leukemia. 2002; 16:846–854.
32. Roche-Lestienne C, Soenen-Cornu V, Grardel-Duflos N, Lai JL, Philippe N, Facon T, Fenaux P, Preudhomme C. Several types of mutations of the Abl gene can be found in chronic myeloid leukemia patients resistant to STI571, and they can pre-exist to the onset of treatment. Blood. 2002; 100:1014–1018.
33. Li Z, Herold T, He C, Valk PJ, Chen P, Jurinovic V, Mansmann U, Radmacher MD, Maharry KS, Sun M, Yang X, Huang H, Jiang X, et al. Identification of a 24-gene prognostic signature that improves the European LeukemiaNet risk classification of acute myeloid leukemia: an international collaborative study. J Clin Oncol. 2013; 31:1172–1181.
34. Melo Rde C, Longhini AL, Bigarella CL, Baratti MO, Traina F, Favaro P, de Melo Campos P, Saad ST. CXCR7 is highly expressed in acute lymphoblastic leukemia and potentiates CXCR4 response to CXCL12. PLoS One. 2014; 9:e85926.
35. Tarnowski M, Liu R, Wysoczynski M, Ratajczak J, Kucia M, Ratajczak MZ. CXCR7: a new SDF-1-binding receptor in contrast to normal CD34(+) progenitors is func-tional and is expressed at higher level in human malignant hematopoietic cells. Eur J Haematoly. 2010; 85:472–483. 36. Whitman SP, Kohlschmidt J, Maharry K, Volinia S,
Mrozek K, Nicolet D, Schwind S, Becker H, Metzeler KH, Mendler JH, Eisfeld AK, Carroll AJ, Powell BL, et al. GAS6 expression identifies high-risk adult AML patients: potential implications for therapy. Leukemia. 2014; 28:1252–1258. 37. Greif PA, Konstandin NP, Metzeler KH, Herold T,
Pasalic Z, Ksienzyk B, Dufour A, Schneider F, Schneider S, Kakadia PM, Braess J, Sauerland MC, Berdel WE, et al. RUNX1 mutations in cytogenetically normal acute myeloid leukemia are associated with a poor prognosis and up-regulation of lymphoid genes. Haematologica. 2012; 97:1909–1915.
Khalife J, Kohlschmidt J, Nicolet D, Powell BL, Carter TH, et al. RUNX1 mutations are associated with poor outcome in younger and older patients with cytogeneti-cally normal acute myeloid leukemia and with distinct gene and MicroRNA expression signatures. J Clin Oncol. 2012; 30:3109–3118.
39. Saito Y, Kaneda K, Suekane A, Ichihara E, Nakahata S, Yamakawa N, Nagai K, Mizuno N, Kogawa K, Miura I, Itoh H, Morishita K. Maintenance of the hematopoietic stem cell pool in bone marrow niches by EVI1-regulated GPR56. Leukemia. 2013; 27:1637–1649.
40. Heo HS, Kim JH, Lee YJ, Kim SH, Cho YS and Kim CG. Microarray profiling of genes differentially expressed dur-ing erythroid differentiation of murine erythroleukemia cells. Mol Cells. 2005; 20:57–68.
41. Desmond JC, Raynaud S, Tung E, Hofmann WK, Haferlach T, Koeffler HP. Discovery of epigenetically silenced genes in acute myeloid leukemias. Leukemia. 2007; 21:1026–1034.
42. Uhrig M, Ittrich C, Wiedmann V, Knyazev Y, Weninger A, Riemenschneider M, Hartmann T. New Alzheimer Amyloid β Responsive Genes Identified in Human Neuroblastoma Cells by Hierarchical Clustering. PLoS One. 2009; 4:e6779.
43. Hu J, Wang S, Zhao Y, Guo Q, Zhang D, Chen J, Li J, Fei Q, Sun Y. Mechanism and biological significance of the overexpression of IFITM3 in gastric cancer. Oncol Rep. 2014; 32:2648–2656.
44. Croner RS, Stürzl M, Rau TT, Metodieva G, Geppert CI, Naschberger E, Lausen B, Metodiev MV. Quantitative proteome profiling of lymph node-positive vs. -negative colorectal carcinomas pinpoints MX1 as a marker for lymph node metastasis. Int J Cancer. 2014; 135:2878–2886. 45. Zhang Z, Qi H, Hou S, Jin X. TIPE2 mRNA overexpression
correlates with TNM staging in renal cell carcinoma tissues. Oncol Lett. 2013; 6:571–575.
46. Calmon MF, Rodrigues RV, Kaneto CM, Moura RP, Silva SD, Mota LD, Pinheiro DG, Torres C, de Carvalho AF, Cury PM, Nunes FD, Nishimoto IN, Soares FA, et al. Epigenetic silencing of CRABP2 and MX1 in head and neck tumors. Neoplasia. 2009; 11:1329–1339. 47. Su Y, Xiong J, Bing Z, Zeng X, Zhang Y, Fu X, Peng X.
Identification of novel human glioblastoma-specific tran-scripts by serial analysis of gene expression data mining. Cancer Biomark. 2013; 13:367–375.
48. Allioli N, Vincent S, Vlaeminck-Guillem V, Decaussin-Petrucci M, Ragage F, Ruffion A, Samarut J. TM4SF1, a novel primary androgen receptor target gene over-expressed
in human prostate cancer and involved in cell migration. Prostate. 2011; 71:1239–1250.
49. Xu L, Li Q, Xu D, Wang Q, An Y, Du Q, Zhang J, Zhu Y, Miao Y. hsa-miR-141 downregulates TM4SF1 to inhibit pancreatic cancer cell invasion and migration. Int J Oncol. 2014; 44:459–466.
50. Martuszewska D, Ljungberg B, Johansson M, Landberg G, Oslakovic C, Dahlback B, Hafizi S. Tensin3 is a negative regulator of cell migration and all four Tensin family mem-bers are downregulated in human kidney cancer. PLoS One. 2009; 4:e4350.
51. Carter JA, Gorecki DC, Mein CA, Ljungberg B, Hafizi S. CpG dinucleotide-specific hypermethylation of the TNS3 gene promoter in human renal cell carcinoma. Epigenetics. 2013; 8:739–747.
52. Yang M, Gao H, Chen P, Jia J, Wu S. Knockdown of inter-feron-induced transmembrane protein 3 expression sup-presses breast cancer cell growth and colony formation and affects the cell cycle. Oncol Rep. 2013; 30:171–178. 53. Chou WC, Chou SC, Liu CY, Chen CY, Hou HA,
Kuo YY, Lee MC, Ko BS, Tang JL, Yao M, Tsay W, Wu SJ, Huang SY, et al. TET2 mutation is an unfa-vorable prognostic factor in acute myeloid leukemia patients with intermediate-risk cytogenetics. Blood. 2011; 118:3803–3810.
54. Bacher U, Haferlach C, Kern W, Haferlach T, Schnittger S. Prognostic relevance of FLT3-TKD mutations in AML: the combination matters--an analysis of 3082 patients. Blood. 2008; 111:2527–2537.
55. Chou WC, Hou HA, Liu CY, Chen CY, Lin LI, Huang YN, Chao YC, Hsu CA, Huang CF, Tien HF. Sensitive measure-ment of quantity dynamics of FLT3 internal tandem dupli-cation at early time points provides prognostic information. Ann Oncol. 2011; 22:696–704.
56. Hou HA, Kuo YY, Liu CY, Chou WC, Lee MC, Chen CY, Lin LI, Tseng MH, Huang CF, Chiang YC, Lee FY, Liu MC, Liu CW, et al. DNMT3A mutations in acute myeloid leukemia: stability during disease evolution and clinical implications. Blood. 2012; 119:559–568. 57. Barrett T, Wilhite SE, Ledoux P, Evangelista C, Kim IF,
Tomashevsky M, Marshall KA, Phillippy KH, Sherman PM, Holko M, Yefanov A, Lee H, Zhang N, et al. NCBI GEO: archive for functional genomics data sets—update. Nucleic Acids Res. 2013; 41:D991–995.