5
III
March 2017
Technology (IJRASET)
©IJRASET: All Rights are Reserved
1136
Factors Influencing Waste Generation on
Construction Project and Waste Management by
Six Sigma Principle
Mr. Samadhan S Sakunde1, Dr. S.S.Valunjkar2
1
M.Tech Scholar, 2Professor, Department of Civil Engineering Government College of Engineering, Karad
Abstract: the construction industry plays an important role in establishing the infrastructure required for socio-economic development. It is one of the biggest environmental polluters and it also consumes large quantities of raw materials. Near about 1.3 billion tone of solid waste is generated round the world and 50 percent of it comprises of construction waste. The cost of construction project increases significantly due to the amount of waste generated. Researchers have found that the overall cost of construction rises by 15-20 percent due to waste; where material comprises 60-65 percent of the total construction cost for any project. So it is obligatory to develop a proper management system to reduce the amount of wastage. in this paper an attempt is made to understand & identify the causes of waste on construction site and waste prevention method and the wastage level in construction site. A quesstionnarie survey was made in tow different areas one is urban area and second is rural area in order to find major material and reasons for the contribution of waste. Analysis done using spss soft tool discovers the main reasons & material contributing to waste generation. For waste reduction six sigma principal is applied for the major waste calculated from abc analysis. Also in this study the waste prevention methods such as reduce, reuse, and recycle are significantly used which is also called as 3r concept.
Keywords: construction waste, construction cost, spss
1. INTRODUCTION
The cost of materials for any construction project is about 60-65 percent of the total cost of construction which is considerable one. Near about 1.3 billion tone of solid waste is generated round the world and 50 percent of it comprises of construction waste. The difference between the consumption of material i.e. difference between calculated quantity and the consumed quantity can be called as waste. As Indian construction industry is growing rapidly and as per 11th five year plan the construction industry has been reported as the second largest activity in India also the built up area is assumed to increase 5 times, from 21 billion sq ft in 2005 to 104 billion sq ft by 2030. As huge amount of waste is being generated and will increase in coming years.
According to TIFAC (Technology Information Forecasting and Assessment Council) a new construction site generates 40-60kg of C&D waste per sq m resulting in generation of 50 million tones in the year 2013. This directly affects the profitability of the construction industry and also the environment. There are four major environmental harmful impacts of construction phase, namely: construction waste, noise, dust, and air pollution. Among these items, construction waste has been reported to be one of the most harmful sources during construction execution. . So it is important to identify the factors for waste produced on construction sites from economic and environment point of view.
A. Objective
The main objective of the research is to reduce waste generated on construction sites through application of six-sigma principles:
1) Identification of waste generated and reasons for same through questionnaire survey.
2) Calculating quantities of waste generated on a selected site and selecting major waste materials through ABC analysis.
3) Analyzing 3R concept for further reducing the impact of waste materials on project cost and environment.
II. METHODOLOGY
A. First step is questionnaire survey designed to collect information related to waste management on a construction site\
Technology (IJRASET)
for waste generation.C. The quantities of waste generated on a selected site were calculated and major waste materials on the construction site were identified using ABC analysis.
D. Six sigma principal to be applied for waste reduction.
E. The last phase to be analyzed is the 3R application for reducing the impact on project cost and environment.
III. QUESTIONNAIRE SURVEY
A structured questionnaire were prepaired on the basis of identified waste variables which had common features were grouped together under the following categories: a) Design b) Material handling c) Operation d) Procurement. A scale was prepared to determine the intensities of each sub categories. A brief clarification for this is as below:
A. Design
Waste generation in this component is due to two main reasons inopportune detailing and design, alteration in design. If materials are purchased based on wrong design specification the purchased material may turn into waste if not returned or resold. On the other hand if it used then the contractor, is forced to remove the material which cause waste generation.
B. Material Handling
Material handling refers to storing and handling of materials on the site. Materials can undergo damage during packaging, transportation loading and unloading. Wastage may occur during these process, improper storing unwanted handling, restoring are some additional reasons for waste production.
C. Operation
This activity is directly related to labourers on site. Major amount of waste generated in this activity is due to poor workmanship by unskilled labours. Poor working state can also have a role in waste generation.
D. Procurement
Ordering errors like more or less leads to waste generation. Sometimes there is lack of possibility to authoritatively mandate less quantity Predicated on the above main factors accumulation of open end and close end questionnaires were prompt and these was distributed to project managers, site engineers, site supervisors etc.
E. Selection of Area for survey
The survey was carried out in two different areas to know the quantity and the various factors influencing on waste generation.Survey was carried out in urban (Pune, Maharashtra) area as well as in rural (Satara, Tal. Satara Dist. Satara, Maharashtra) areas. The type of construction selected for the survey was residential projects.
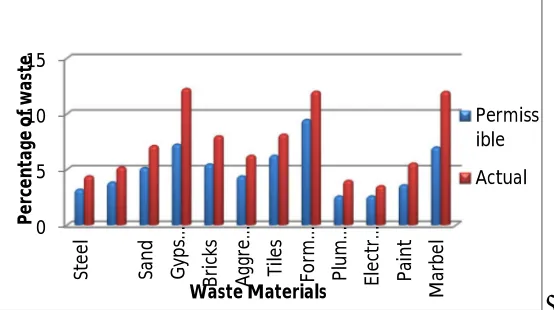
[image:3.612.123.492.550.736.2]The following are the waste materials and there actual and permissible average percentage of waste obtained from the survey carried out for 20 sites in Pune :
Table No - 1 : Actual and Permissible Average Percentage of Waste for Pune
Sr. no Materials Permissible % Actual %
1 Steel 3.21 4.4
2 Cement 3.85 5.2
3 Sand 5.15 7.13
4 Gypsum 7.25 12.25
5 Bricks 5.47 8
6 Aggregates 4.4 6.25
7 Tiles 6.25 8.15
8 Formwork 9.47 12
9 Plumbing 2.6 4
Technology (IJRASET)
©IJRASET: All Rights are Reserved
1138
11 Paint 3.6 5.55
12 Marble 7 11.99
[image:4.612.71.546.37.107.2]The following are the waste materials and there actual and permissible average percentage of waste obtained from the survey carried out for 20 sites in Satara.
Table No - 2 : Actual and Permissible Average Percentage of Waste for Satara
Sr. no Materials Permissible % Actual %
1 Steel 4 4.4
2 Cement 3.9 5
3 Sand 5.2 7.6
4 Bricks 6.2 9
5 Aggregates 5.1 7.25
6 Tiles 5.25 9.15
7 Formwork 8.23 11
8 Plumbing 2 5.2
9 Electrical 2.5 3.52
10 Paint 2.9 5.55
F. Results and Discussions of SPSS Soft Tool
The data obtained from questionnaire survey was analysed using SPSS soft tool. Data obtained was checked for reliability and the Cronbach's Alpha value for the data was 0.914 which indicates that data is reliable. And also factor analysis (extraction value) is calculated. The top materials and there reasons for waste generation obtained for Pune and Satara regions with their extraction values are given below
Table No - 3 : Extraction Value for Pune Area
Materials Factor analysis (Extraction value)
Steel 0.924
Gypsum 0.958
Bricks 0.959
Aggregates 0.974
Tiles 0.936
[image:4.612.140.476.157.344.2]Marble 0.920
Table No - 4 : Extraction Value for Satara Area
Materials Factor analysis (Extraction value)
Steel 0.950
Bricks 0.926
Aggregates 0.915
Tiles 0.910
[image:4.612.159.453.447.714.2]Technology (IJRASET)
Chart No - 1 : Comparison between permissible and accrual percentage of waste
IV. ABC ANALYSIS
ABC analysis is an inventory categorization method which consists in dividing items into three categories (A, B, C). A being the most valuable items, C being the least valuable one. This method aims to draw managers’ attention on the critical few (A-items) not on the trivial many (C-items). The ABC approach states that a company should rate items from A to C, basing its ratings on the following rule
[image:5.612.189.466.98.253.2]A-items are goods which annual consumption value is the highest; the top 70-80 percent of the annual consumption value of the company typically accounts for only 10-20 percent of total inventory items. B-items are the interclass items, with a medium consumption value those 15-25 percent of annual consumption value typically accounts for 30 percent of total inventory items. C-items are, on the contrary, C-items with the lowest consumption value; the lower 5 percent of the annual consumption value typically accounts for 50 percent of total inventory items
Table No - 4 : ABC Analysis Chart Percentage
of items
Percentage value of annual usage Class A items About 20% About 80%
Close day to day control Class B items About 30% About 15% Regular review Class C items About 50%
About 5% Infrequent review
A. Steps for Carrying Out ABC Analysis:
1) Find out the unit cost and the usage of each material over a given period
2) Multiply the unit cost by the estimated annual usage to obtain the net value.
3) List out all the items and arrange them in the descending value (Annual Value).
4) Accumulate value and add up number of items and calculate percentage on total inventory in value and in number.
5) Draw a curve of percentage items and percentage value.
Technology (IJRASET)
©IJRASET: All Rights are Reserved
1140
B. Outcome of ABC Analysis
Chart No - 2 :ABC Analysis of the waste materials on site.
V. SIX SIGMA PROCEDURES FOR WASTE REDUCTION
A. Background of Six Sigma Principle
The Six Sigma concept was initiated in the early 1980s at Motorola. It received little publicity until the late 1990s when Jack Welch CEO of General Electric and Larry Bossidy CEO of AlliedSignal successfully led their organizations through a cultural change using Six Sigma initiatives. Since then, many books and journal papers have been written on the subject between 1999 and 2002. Recently, many organizations have attempted to achieve customer satisfaction. One of the most important aspects of customer satisfaction is achieved through a high quality product, which also means a low defect product. Traditionally, defects include products containing a flaw in the manufacturing process, customer dissatisfaction in the service department, or documentation errors in an office. Lindermann 2003s stated that six sigma principle is a statistics-based methodology that relies on the scientific method to make significant reductions in customer-defined defect rates in an effort to eliminate defects from every product, process, and transaction.
B. Six Sigma
The word sigma (σ) is a Greek alphabet which in this case is used as a symbol and metric of process variation. Six sigma is the application of the scientific method to te design and operation of management systems and business processes which enables the employees to deliver the greatest value to customers and owners. Six sigma focuses on helping the organization make more money by improving customer value and efficiency. To link this objective of six sigma with quality requires a new definition of quality the value added by a productive endeavor. This quality may be expressed as potential quality actual quality. Potential quality is known maximum possible value added per unit of input. Actual quantity is the current value added per unit of input. The difference between potential and actual quality is waste. Six sigma focuses on improving the quality i.e. reducing waste by helping organizations to produce products services and improve the process. There is direct relation between quality and the Sigma levels
Fig.No - 1 : Six sigma
3 6 .6 2 34 .1 8 17 .0 4 5. 1 2 3. 1 2 0 .8 0 0 .7 2 0 .6 1 0. 3 9 0. 3 2 0. 22 0. 21 0. 17 0. 12 0. 11 0. 0 5 0. 0 4 0. 0 4 0. 0 4 0. 0 3 0. 0 2 0. 0 2 0. 0 1 36 .6 2 70 .8
0 87.
8 4 9 2. 9 6 9 6. 08 96 .8 8 9 7. 60 9 8 .2 1 9 8 .6 1 9 8. 9 3 9 9. 1 4 9 9 .3 5 9 9. 5 3 9 9. 6 4 99 .7 5 99 .8 0 99 .8 4 9 9 .8 8 9 9 .9 2 9 9 .9 5 9 9 .9 7 9 9 .9 9 10 0 .0 0 0 10 20 30 40 50 60 70 80 90 100 0 10 20 30 40 50 60 70 80 90 100
1 3 4 2 11 9 26 15 5 17 16 29 33 28 12 7 23 01 25 14 6 21 18
C u m u la ti ve ( % ) o f T o ta l R u p e e I ss u e d P er ce n ta ge ( % ) o f T o ta l R u p e e Is su e d Item No.
ABC Analysis
Percentage (%) of…
Class A Class C Class B 0 50 100
2 3 4 5 6
C
os
t
O
f
Q
u
al
it
y
Six Sigma Level
Cost Of Quality (as %
revenue)
Technology (IJRASET)
[image:7.612.127.490.94.480.2]C. Result of Six Sigma Application
Table No. 5 : Materials and there percentage on Selected site Six sigma
Chart Steel Cement Aggregate Bricks
1 3.873537199 3.799393483 3.552346372 3.873537199 2 3.851853289 3.825775705 3.653719669 3.851853289 3 3.934733969 3.865353692 3.748305919 3.934733969 4 3.968495273 3.912038313 3.821908382 3.968495273 5 3.998238861 3.945448629 3.871759576 3.998238861 6 4.155148782 3.97683819 3.905745868 4.155148782 7 4.245066021 3.992391632 3.931812061 4.338929678 6 4.155148782 3.97683819 3.905745868 4.155148782 5 3.998238861 3.945448629 3.871759576 3.998238861 4 3.968495273 3.912038313 3.821908382 3.968495273 3 3.934733969 3.865353692 3.748305919 3.934733969 2 3.851853289 3.825775705 3.653719669 3.851853289 1 3.873537199 3.799393483 3.552346372 3.873537199
Chart No - 3 :Six Sigma Results For improvement in the Waste management
VI. 3R CONCEPT FOR FURTHER REDUCTION OF THE CONSTRUCTION WASTE
The three R concept is the most effective way by which we can eliminate waste and can protect the environment. 3R is a well known method which ascribes reduce, reuse and recycle of materials. This concepts works right from the reduction of waste reusing it and recycling the waste to make it reusable. Application of 3R is for the entire lifecycle of the product.
A. The 3 R in Detail
1) Reduce: The main motive of “Reduce” is to bank resource and to reduce waste. In other terms, reducing refers to using the things with care to reduce the amount waste generated. In general reduction can be done in many ways like,
a) Resource saving.
b) Reduction of waste by controlling the factors generating it
c) Development of resource saving design.
2) Reuse: Reusing includes the repeated use of items or parts of the products which still have the ability of being used. This can be done by proper management and segregation of waste by which each material can be categorized accordingly. The following can be used for reusing of materials/products,
a) Easy separation of materials.
b) Inspection techniques. 3.4 3.9 4.4
1 2 3 4 5 6 7 6 5 4 3 2 1
S
ix
S
igm
a
L
eve
ls
Different Floor levels
Cumulative Six Sigma Level For All
Materials
Technology (IJRASET)
©IJRASET: All Rights are Reserved
1142
c) Promoting reuse of materials.
3) Recycle: The word recycle mean to use all or a part of waste or used product/materials with the help of processing techniques. Recycling is the last step in the 3 R system after which the material or product is directly disposed. In recycling phase the materials are processed up to a extend so that they can be used again.
VII. CONCLUSION AND FUTURE WORK
A. From the study it can be concluded that following factors affect waste generation and following materials contribute towards waste:
1) Delaying in passing the information to the contractor on type of product to be used.
2) Weather problem or atmospheric condition.
3) Damages during transportation.
4) Error in contract document
5) Unfriendly attitude of project team and labour.
B. From data collected on the selected site for quantity of waste generated material ABC analysis was performed which resulted in the A type material are Steel, Cement, Bricks, and Aggregate. The A type material plays an important role in managing cost effectiveness of the construction site.
C. Six sigma tools were used to minimize the waste generation on site which resulted in increase of level from 3.93 to 4.33.
D. Future scope of this study is application of 3R concept for further reducing the impact of waste materials on project cost and environment. and alsoWaste management model development for “Construction waste reduction”.
REFERENCES
[1] Ferry Firmawan, Fadil Othman, Khairulzan Yahya, ''Improving Project Performance and Waste Reduction In Construction Projects: A Case Study Of A Government Institutional Building Project'',(2012) International Journal of Technology (2012) 2: 182-192 ISSN 2086-9614
[2] Hee Sung Cha, Jeehye Kim and Ju-Yeoun Han, (2009), “Identifying and Assessing Influence Factors on Improving Waste Management Performance for Building Construction Projects”, Journal of Construction Engineering and management, volume 135.
[3] L. Y. Shen, Vivian W. Y. Tam, C. M. Tam and D. Drew, ( 2014), “Mapping Approach for Examining Waste Management on Construction Sites” ,Journal of Construction Engineering and Management, Volume 13.
[4] Mansi Jain, (2012), “Economic Aspects of Construction Waste Materials in terms of cost savings – A case of Indian construction Industry”, International Journal of Scientific and Research Publications, volume 2.
[5] Ng Lee Shan, Seow Ta Wee,(2015), ''Construction Contractors’ Perception on Effective 3R Implementation for Solid Waste Reduction'', International Journal of Conceptions on Management and Social Sciences Vol. 3, Issue. 4, October’ 2015; ISSN: 2357 - 2787
[6] Seung Heon Han, M.ASCE1; Myung Jin Chae, Ph.D., P.E.(2008) ''Six Sigma-Based Approach to Improve Performance in Construction Operations'' Journal Of
Management In Engineering © Asce
[7] Shant A. Dajadian, Dhaphene C. Koch. , (2014), “Waste Management Models and Their Applications on Construction Sites”, International Journal of Construction Engineering and Management, PP 91-98.
[8] S. Sriram 1, A. Revathi 2 (2016)''Implementation of Six Sigma Concepts in Construction Project for Ensuring Quality Improvements''ASCE Vol. 5, Issue 4 [9] Sunil V. Desale, Sharad V. Deodhar, (2014), “Identification and eliminating waste in construction by using Lean and six sigma Principles”, International