www.impactjournals.com/oncotarget/ Oncotarget, Vol. 6, No. 36
Hepatic TLR4 signaling is activated by LPS from digestive tract
during SARA, and epigenetic mechanisms contribute to enforced
TLR4 expression
Guangjun Chang1, Su Zhuang2, Hans-Martin Seyfert3, Kai Zhang1, Tianle Xu1, Di
Jin1, Junfei Guo1 and Xiangzhen Shen1
1 College of Veterinary Medicine, Nanjing Agricultural University, Nanjing, China
2 College of Animal Science and Technology, Nanjing Agricultural University, Nanjing, China 3 Leibniz Institute for Farm Animal Biology, Dummerstorf, Germany
Correspondence to: Xiangzhen Shen, email: xzshen@njau.edu.cn
Keywords: subacute ruminal acidosis, LPS translocation, liver, TLR4 signaling, epigenetic mechanisms, Immunology and Microbiol-ogy Section, Immune response, Immunity
Received: August 13, 2015 Accepted: September 30, 2015 Published: October 19, 2015
This is an open-access article distributed under the terms of the Creative Commons Attribution License, which permits unrestricted use, distribution, and reproduction in any medium, provided the original author and source are credited.
ABSTRACT
Subacute ruminal acidosis (SARA) is known to trigger a systemic inflammatory
response that is possibly caused by the translocationof lipopolysaccharides (LPS) from the gastrointestinal tract into the bloodstream. The aim of this study is to investigate this causal relationship between the increases of circulating LPS and
liver inflammation. Here we found that SARA goats exhibited significantly increased
LPS concentrations in both the rumen and portal vein. The livers of these goats
exhibited increased mRNA concentrations of pro-inflammatory genes that indicated inflammation. Meanwhile, the occurrence of liver inflammation was further validated
by the enhanced protein expression of those cytokines in the livers of SARA goats.
These increased expressions of detected pro-inflammatory genes were likely
mediated by enforced TLR4 signaling because SARA increased the concentrations of TLR4 mRNA and protein in the liver and the abundance of both the NF-kB-p65
factor and its active phosphorylated variant. We also verified that the enhanced TLR4
expression was accompanied by chromatin decompaction and demethylation of the proximal TLR4 promoter. Hence, epigenetic mechanisms are involved in the enforced
expression of immune genes during SARA, and these findings open innovative routes
for interventions via the modulation of these epigenetic mechanisms.
INTRODUCTION
Subacute ruminal acidosis (SARA) has become the primary metabolic disease in dairy industry and has thus received increasing attention over the last decade [1-3]. The persistent consumption of a high-concentrate (HC) diet by ruminants increases the production of organic acids and causes a depression of the pH in the digestive tract [2-4]. This decrease in pH may result in alterations of the type of fermentation and the composition of the microbiota in the rumen. Together, these changes can eventually lead to the accumulation of lipopolysaccharides (LPS), and may concomitantly disrupt the gastrointestinal barrier and facilitate the translocation of LPS from the
digestive tract into bloodstream [5-7]. It is well known that HC-induced SARA increases the plasma concentrations of acute phase proteins (APPs), such as serum amyloid A (SAA), haptoglobin (Hp) and LPS-binding protein (LBP),
and elevates the levels of pro-inflammatory cytokines, including interleukin (IL)-1, IL-6 and TNF-α, in the
peripheral blood [3, 8, 9]. Hence, the translocation of LPS from the digestive tract into the bloodstream often triggers
a systemic inflammatory response [10-12].
LPS-infusion studies have demonstrated that the liver is a prominent site of the synthesis of the
pro-inflammatory cytokines that orchestrate the synthesis
and are responsible for sensing invading pathogens both outside the cell and in the intracellular endosomes and lysosomes [15, 16]. TLR4 is one of 13 different, well-characterized mammalian toll-like-receptors (TLRs), and its signal transduction pathway is known to initiate
the activation of nuclear factor (NF)-κB [17]. A large number of inflammation-regulated genes feature NF-κB attachment sites in their proximal promoter regions, and this factor complex functions as a key switch that
orchestrates the whole pool of immune response genes [18]. These immune response genes include the cytokine
encoding genes whose expressions are strongly increased
in the livers of cows as a consequence of LPS-induced
mastitis [19, 20]. However, it is unknown whether
circulating LPS derived from the digestive tract can
enhance the expressions of hepatic immune response
genes via the TLR4-NF-κB signaling pathway.
Previous studies have demonstrated that the local chromatin structures of promoters and their recruitment of
transcriptional factors (TFs), such as NF-κB, are of pivotal
importance for regulating gene transcription [21, 22]. The participation of the epigenetic mechanisms of histone
modification and DNA methylation in the generation of ‘opened’ and ‘closed’ configurations of chromatin are
well documented [22]. Locally open promoter chromatin structures permit the binding of TFs to initiate the transcription of the respective target genes. Previous in vitro studies have revealed alterations in the chromatin structure of the TLR4 promoter during LPS infusion-induced LPS tolerance in murine macrophages and human monocytes [23, 24]. However, it is unknown whether LPS derived from the digestive tract during SARA is able to modify the chromatin structure of the TLR4 promoter
in vivo. Therefore, we hypothesized that the increased translocation of LPS from the digestive tract into liver via
the portal vein might result in the epigenetically modulated
expression of TLR4 and thereby activate the TLR4-NF-κB pathway and ultimately trigger the enhanced expression of
immune response genes in this organ.
RESULTS
Alterations in rumen pHs, milk yields and milk compositions of goats from control and treatment groups
The consumption of the HC diet caused a gradual decline in the average daily rumen pH in the treatment group from 6.54 in the 1st week to 5.63 in the 8th week,
whereas the pH remained stable and above 6.2 in the control group beginning in the 1st week (Figure 1). From
the 4th week onward, the treatment group experienced
SARA, as demonstrated by durations of reduced rumen
pH values below 5.6 that persisted for more than 180
min/d (Figure 1).
Eight weeks of feeding with the HC diet significantly
decreased the average daily milk yield (P < 0.01), milk fat
percentage (P = 0.04) and milk lactose percentage (P <
0.01) compared with the LC diet but did not affect the
milk protein percentage (P = 0.12; Table 2).
LPS concentrations in rumens and portal veins and the concentrations of primary pro-inflammatory cytokines in portal veins of goats in control and treatment groups
The goats fed the HC diet in treatment group
exhibited notably higher free LPS concentrations in the
rumen compared with the goats fed the low-concentrate (LC) diet in control group (P = 0.02). The peak free LPS
concentration in the rumen was observed 4 h after feeding (Table 3). The LPS concentrations measured in the portal
vein were significantly increased in the treatment group
goats compared with the control goats (P < 0.01), and on
the sampling days, the concentrations in the portal vein
exhibited a trend toward an increase with the sampling
time (P = 0.07; Table 3).
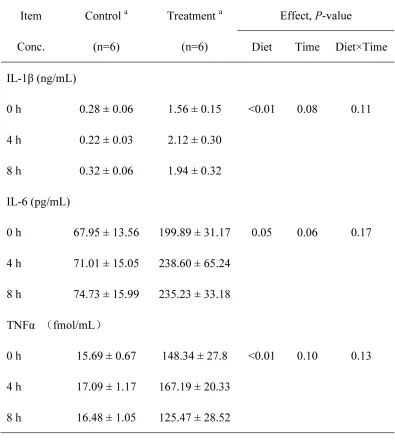
The plasma concentrations of primary
pro-inflammatory cytokines IL-1β (P < 0.01), IL-6 (P = 0.05) and TNFα (P < 0.01) in the portal vein were significantly
increased in the treatment group compared to the control group (Table 4).
Expression of detected innate immune genes in the livers of goats in control and treatment groups
The concentrations of mRNAs encoding innate immune genes (i.e., cytokines, chemokines and acute phase proteins) were increased in the treatment goats compared with the control goats (Figure 2).
SARA significantly increased the expressions of the pro-inflammatory cytokines IL-1α and TNF-α. The concentrations of IL-1β and IL-6 exhibited increases
in the livers of the treatment goats compared with the control goats, and the magnitudes of the increases in
pro-inflammatory cytokine expressions differed between the
control and treatment groups, as indicated in Figure 2. The
expression level of the anti-inflammatory cytokines IL-10
was increased by 5-fold in the treatment group compared
with the control group. The expression levels of the key chemokines IL-8, CCL5 and CCL20 were increased by
11-, 21- and 3-fold, respectively, in the treatment group.
The expression levels of the acute phase proteins Hp, SAA3 and LBP were significantly elevated by 44-, 29-,
8-fold, respectively, in treatment goats compared with
the control goats. The expression of TLR4, which is the specific receptor for LPS, was significantly enhanced by
TLR4, NF-κB p65 and primary pro-inflammatory cytokines protein expressions in livers of goats from control and treatment groups
HC diet-induced SARA increased the hepatic
concentrations of the TLR4 and NF-κB p65 proteins in
the treatment goats compared with the control goats (P < 0.05; Figure 3A and 3B). Importantly, the amount of phosphorylated NF-κB p65 was higher in the livers of
the SARA group animals than in the control animals (P <
0.05; Figure 3C).
The protein expressions of primary pro-inflammatory cytokines IL-1β (P < 0.0.1), IL-6 (P < 0.05) and TNFα (P < 0.01) were significantly enhanced in the
[image:4.612.90.482.67.240.2]livers of the SARA goats compared to those in the liver of the control goats (Figure 4).
[image:4.612.75.499.205.556.2]Table 2: Milk yields and milk components of the goats from the control and treatment groups
Table 4: The concentrations of primary pro-inflammatory cytokines in the plasma of the portal vein of the goats from
the control and treatment groups
Table 5: The average degrees of chromatin compaction and DNA methylation in the TLR4 promoter region in the
[image:5.612.100.549.578.680.2]Figure 1: Weekly averages for the rumen pHs and times spent below pH 5.6 for the lactating goats from the control
and treatment groups. White filled rhomboids, control group (n = 6, mean ± SEM); black filled rhomboids, treatment group (n = 6,
mean ± SEM). Light gray bar, less than 180 min/day with a rumen pH below 5.6; dark gray bar, more than 180 min/day with a rumen pH
below 5.6.
Figure 2: Quantifications of selected innate immune genes by RT-qPCR in the livers of the goats from the control and
treatment groups. The ordinate axis indicates the relative copy numbers (n = 6 in each group, mean ± SEM). White filled bar, control
group; black filled bar, treatment group. The fold changes and significance (*P < 0.10, **P < 0.05, ***P < 0.01) of the selected genes
[image:6.612.61.558.381.675.2]Figure 3: Measurement of the expressions of the TLR4 and NF-κB p65 proteins and the amounts of phospho-p65
protein in the livers of the goats from the control and treatment groups. The protein levels are expressed as arbitrary units
relative to β-tubulin or GADPH; fold changes in TLR4 A., NF-κB p65 B. and phospho-p65 C.. D. Western blotting results for TLR4 and β-tubulin. Control group (bands 1, 2, 5, 6, 9, 10); treatment group (bands 3, 4, 7, 8, 11, 12). E. Western blotting results for NF-κB p65, phospho-p65 and GADPH. Control group (bands 1, 2, 5, 6, 9, 10) and treatment group (bands 3, 4, 7, 8, 11, 12). The significance of the changes in protein levels are indicated (*P < 0.10, **P < 0.05 and ***P < 0.01).
Figure 4: Measurement of the protein expressions of the primary pro-inflammatory cytokines in the livers of the goats
from the control and treatment groups. The protein levels are expressed as arbitrary units relative to β-actin; fold changes in IL-1β
[image:7.612.105.496.387.675.2]Chromatin remodeling and DNA methylation in TLR4 promoter region in livers of goats in control and treatment groups
The promoter of TLR4 has not been thoroughly
examined in goats. Therefore, we identified the DNA
sequence of the TLR4 promoter via BLAST analyses
using the TLR4 mRNA sequences from the NCBI file NW_005100742.1. Next, we analyzed the potential
binding sites for the relevant transcription factors in the TLR4 promoter area in silico to verify the core promoter sequence for further analyses of chromatin remodeling and
DNA methylation (Figure 5A).
The results of the chromatin accessibility by real-time PCR assay (CHART-PCR) revealed that the average degree of chromatin compaction in the treatment group
was significantly lower than that in the control group (P <
0.01; Table 5). Plotting the individual degree of chromatin
compaction against the mRNA copy number revealed a
significant correlation between these TLR4-encoding
gene-related parameters (R2 = -0.94, P < 0.01; Figure 5B).
Additionally, the DNA methylation results revealed that
the average degree of TLR4 promoter methylation in the
treatment group goats was notably decreased compared with that in the control goats (P < 0.0.1; Table 5). Plotting
the individual degree of chromatin compaction against
the degree of DNA methylation revealed a significant
correlation (R2 = 0.75, P = 0.03; Figure 5C).
DISCUSSION
SARA is a consequence of rumen fermentation disorder, and it causes a diverse of secondary diseases and enormous economic losses [11]. Rumen pH value is
the most widely used parameter to define SARA. In the present study and consistent with the previous reports [10, 25], the average rumen pH was below 5.6 for at least 180
min/d from the 4th week onward in the treatment group,
which indicated that SARA was successfully induced. Additionally, in accordance with previous research [3,
10, 26], we observed that experimentally-induced SARA
reduced the milk yield and milk fat percentage in the goats fed the HC diet compared with the goats fed the LC diet, although the energy and protein levels were similar between the groups. The reduction in the milk production
[image:8.612.76.531.343.631.2]performance exhibited by the goats fed the HC diet might
Figure 5: Analysis of chromatin remodeling and DNA methylation in the promoter of TLR4 in the livers of the goats
from the control and treatment groups. A. Map of the positions of the binding sites for the relevant transcription factors in the
promoter of TLR4. The numbers refer to the transcriptional start sites (TSP, +1), which are indicated with filled arrows, and the 5’-position of exon 1 is indicated by the black box. The positions of the various transcription factors and restriction enzyme recognition sites are
indicated by the respective symbols. The light arrows denote the positions of the primers used for CHART-PCR and the methylation assay. B. Correlations between chromatin compaction and mRNA copy numbers. R2, coefficient of correlation; P, significance of the correlation.
resulted from the effects of alterations in the type of rumen fermentation type that were caused by the increased concentrate proportion [11].
The induction of SARA via feeding with a HC diet is well known to increase the concentration of LPS in the gastrointestinal tract [2, 27], which may disrupt the barrier function of the gastrointestinal epithelium [6, 7, 28, 29] and facilitate the translocation of LPS from the digestive tract into the circulation. The presence of LPS in the blood of lactating goats and cows fed HC diets can increase the
concentrations of primary pro-inflammatory cytokines [3,
9]. Our results revealed that the LPS concentrations in the rumen and the portal vein, as well as the concentrations
of primary pro-inflammatory cytokines in the plasma of portal vein were significantly increased in the treatment
group compared with the control group, which indicated that HC-induced SARA led to the translocation of LPS from the digestive tract into the portal vein and thereby increased the entry of LPS into the liver to enhance the
secretion of pro-inflammatory cytokines.
Our RT-qPCR-based determination of the markers of
inflammation in the liver clearly verified that the animals suffered from liver inflammation. This finding accord with previous findings from lactating goats suffering from HC-diet induced SARA [3]; these goats also displayed significantly enhancement in the expressions of several genes encoding pro-inflammatory cytokines and acute phase proteins (APPs). We identified four lines of
evidence that suggest that TLR4 signaling was crucially
involved in the induction of this inflammatory response in
the liver. First, lipoprotein A from LPS is known to be the
only ligand of and highly specific for the TLR4 receptor [16, 30], and we observed increased concentrations of
LPS in the portal veins of the treatment group animals. Second, we found that SARA increased the mRNA and protein concentrations of TLR4 in liver. Third, LPS-triggered TLR4 signaling is known to ultimately activate
the NF-κB factor complex [31, 32], and we observed that the abundances of both NF-κB (p65) and
phosphorylation-activated phosphor-p65 were increased in the livers of the treatment group goats. Fourth, the activation of the
NF-κB transcription factor complex is known to be a key
determinant of immune defense because these factors
collectively control the expression of more than 100
immune genes [18, 33], and our results clearly showed
that the expressions of pro-inflammatory cytokines mRNA and protein were significantly increased in the livers of
the SARA goats compared to the control goats. Together, these diverse lines of evidence strongly suggest that the LPS-mediated induction of TLR4 signaling caused the
inflammation of the livers of the goats suffering from
SARA.
We examined the degrees of chromatin compaction
in the relevant areas of the TLR4 promoter to determine the contribution of chromatin remodeling to the regulation
of the expression of immune genes during SARA. Our
combined observations of (i) chromatin decompaction
of the target area and (ii) decreased CpG methylation clearly verified that epigenetic mechanisms of gene expression control were triggered in the group of goats
suffering from diet-induced SARA. This results of the
current study conform well with our previous finding
that the systemic reaction that occurs during mastitis
that is experimentally induced with E. coli in dairy cows triggers chromatin decompaction at the TLR4 promoter
in the liver. This decompaction is accompanied by DNA demethylation and enhanced TLR4 expression [34]. The
common factor in both of our studies may have been the systemically increased levels of LPS circulating in the
blood. These findings suggest that systemic increases in
LPS, regardless of whether they are due to the liberation of LPS during SARA or the conceivable liberation of LPS during mastitis, have widespread detrimental effects on the proper functioning of the liver. The LPS-mediated effects trigger epigenetic mechanisms in the liver.
In conclusion, our study clearly documented that an important detrimental feature of diet-induced SARA
is to causing liver inflammation. This inflammation is
triggered by increased levels of circulating LPS that, in
turn, conceivably activate excessive TLR4 signaling, and thereby enhance the expressions of innate immune genes and increase the secretions of pro-inflammatory
cytoines in this central metabolic organ. The widespread
consequences of liver dysfunction may also influence
milk production. Our study also indicates that epigenetic
mechanisms are involved in the enfored expression of innate immune genes, and these findings open innovative
routes for feasible interventions based on the applications modulators of epigenetic mechanisms, such as histone deacetylases and demethylases and their inhibitors [35, 36].
MATERIALS AND METHODS
Animals, diets, and experimental design
The goats were housed in individual metabolic
cages in the Centre of Experimental Animals at Nanjing Agricultural University (Nanjing, China) in accordance
with the guidelines of the Animal Ethics Committee
at Nanjing Agricultural University and in compliance
with the Regulations for the Administration of Affairs
Concerning Experimental Animals (the State Science and
Technology Commission of People’s Republic of China,
at the end of the experiment. The goats were randomly
assigned to either a treatment group that was fed a HC
diet (forage:concentrate = 40: 60) to induce SARA or to a
control group that was fed a LC diet (forage:concentrate =
60:40) (Table 1). Prior to the initiation of the experiment, all of the goats were ruminally cannulated, fitted with
indwelling catheters in the portal vein, and fed an LC diet for a 4-week adaption phase to ensure the similarity of the rumen fermentation statuses. The catheters were serviced
by the infusion of sterilized heparin saline (250 IU/mL)
three times daily at 8-h intervals. After the surgery and an
adaption phase, the goats exhibited an average milk yield of 1.63 ± 0.58 kg/day and received the appropriate diet for 8 weeks. The goats were fed at 8:30 and 16:30 daily and
were provided free access to fresh water for the duration of
the experiment. Additionally, body temperatures and milk
SCCs were monitored weekly udder health parameters because mastitis can affect the LPS concentration in the
blood and other experimental parameters. Diet and dietary
ingredient samples were collected weekly and analyzed by wet chemistry as previously described [37].
Rumen pH and milk measurements
The rumen pH values were measured on the last 2
consecutive days of each week during the experiment. On these days, rumen fluid was collected at 30-min intervals for 24 h. The pH data were summarized first as the average
pHs and second as the times spent below pH 5.6 for each
week. The goats were milked twice daily at 8:30 and 16:30, and the milk yields were recorded. Milk samples (50 mL) were collected from the last three consecutive days of each experimental week. These samples were
preserved with potassium dichromate and stored at 4 °C
until analysis with a FossMatic 5000 analyzer (FOSS Electric A/S, Denmark) to determine the milk fat, protein
and lactose contents.
Rumen fluid, blood and liver tissue sampling
Rumen fluid and portal vein blood samples were collected from all goats 15 min prior to feeding (0 h) and
at 4 h and 8 h after feeding on the last 3 consecutive days of the 8th week. The protocols for the preparing rumen
fluid and blood samples for laboratory analyses have been
described previously [38].
After sampling of the rumen fluid and blood, the
goats were slaughtered, and the liver tissue was then
immediately excised. Small cubes (2 mL) were
snap-frozen and stored in liquid nitrogen.
LPS and primary pro-inflammatory cytokines measurement
The LPS concentration was measured with a
chromogenic endpoint assay (cat. CE64406, Chinese
Horseshoe Crab Reagent Manufactory Co., Xiamen,
China) with minimum detection limits of 0.05 EU/mL (rumen liquid) or 0.01 EU/mL (plasma). The procedures
were performed according to the manufacturer’s instructions as described by Chang et al. [39].
The concentrations of primary pro-inflammatory cytokines IL-1β, IL-6 and TNF-α in the plasma of
portal vein were measured by Radioimmunoassay with commercially available human radioimmunoassay kits
purchased from Beijing North Institute of Biological
Technology. The detection range of radioimmunoassay
kits for IL-1β (cat. C09DJB), IL-6 (cat. C12DJB) and TNF-α (cat. C06PJB) were 0.1-8.1 ng/mL, 50-4000 pg/mL and 9-590 fmol/mL, respectively. This method has been
described by Chang et al [39].
RNA extraction and RT-qPCR
RT-qPCR was performed using an ABI 7300 system (Applied Biosystems, Foster City, CA, USA)
to determine the relative copy numbers of the different mRNA transcripts. The liver samples were powdered in
small tubes (5 mL), and the total RNA was extracted using TRIZOL (Takara, Dalian, China) in accordance with the manufacturer’s protocol. For the cDNA synthesis, 1.5 µg
total RNA was prepared in a reverse transcription reaction
(cat. RR036A, Takara) with oligo-dT for all mRNAs. RT-qPCR was performed using gene-specific primer pairs to amplify the cDNA target segments with SYBR Premix EX Taq™ kit (cat. DRR420A, Takara). The relative copy
numbers of the individual mRNA were calculated against
the dilution series (106 to 102 copies) of the respective
cloned amplicons as external standards. The amplification
primers are listed in the Supplementary Table.
Chromatin preparation and CHART-PCR
A 100-mg tissue sample was powdered in liquid
nitrogen and suspended in 3 mL pre-chilled resuspension
buffer (RSB; 10 mM Tris [pH 8.0], 3-mM MgCl2, and
10-mM NaCl) containing 0.5% Nonidet NP 40. A freshly prepared dilution (1/200) of a proteinase inhibitor cocktail (REF: 04693132001, Roche) and phenyl-methyl-sulfonyl-fluoride (PMSF; 1 mM)) was added immediately prior to
use. After incubation for 5 min on ice, the tissue powder
°C to pellet the nuclei. The pellets were washed once
in RSB buffer containing 1 mM β-mercaptoethanol
and subsequently transferred into a pre-cooled 1.5-mL
Eppendorf vial. The nuclei were pelleted again (1,000 ×g, 5 min, 4 °C) and re-suspended in 100 µL RSB buffer containing 50 % glycerol and stored at -20 °C.
Chromatin compaction was measured using the
CHART-PCR [40] as described Vanselow et al. [41]. The restriction enzyme used to determine the amount of chromatin compaction at the TLR4 promoter was MaeI.
The quantity of undigested target DNA was measured by real-time PCR (ABI 7300) using a protocol similar
to that described above for the RT-qPCR. The primers used to amplify the target promoter sequence of the
TLR4 encoding gene (NW_005100742.1) were 5’- CATAACAGCACTTCAAGGTAC (forward) and 5’- GGAAGCTGCTATGCATTAGAT (reverse). The degree
of compaction is represented as the fraction of the copy numbers determined from the digested vs undigested control samples.
Methylation assay of the TLR4 promoter
Genomic DNA was extracted from the liver tissues and analyzed with Methyl-Profiler DNA Methylation RT-qPCR Assays with some modifications [42, 43]. This method exploits the fact that HpaII digestion is
blocked by the methylation of C nucleotides in CpG
dinucleotides, whereas its isoschizomer MspI is not
blocked. Purified genomic DNA was predigested with
EcoRI to facilitate accurate aliquoting. Three micrograms
of the digested and subsequently purified DNA were
distributed and digested with HpaII or MspI (10 U,
37 °C, 2 h). The control was similarly treated, but the
enzyme was not added. Subsequently, the DNA was re-purified and re-quantified, and 200 ng (equivalent to ~6,000 gene copies) was used to determine the remaining DNA copies for the qPCR assays. The primers used to
amplify the target sequence of the TLR4 promoter were
5’- GCTTTGTCTATGCAGTCACTT (forward) and 5’- CAGTCCCTGCTCCAGGAAGAT (reverse). The
degree of methylation was calculated based as the ratio of the copy numbers obtained following HpaII and MspI digestions, and each value is presented relative to the
value obtained for the undigested control (set as 100 % of the input DNA). These calculations have previously been
described in detail [34]
Western blotting analyses of TLR4, NF-κB (p65), NF-κB (phospho-p65), IL-1β, IL-6 and TNFα
The total proteins were extracted from finely
minced liver tissue with RIPA Lysis Buffer (cat. SN338,
Sunshine Biotechnology Co., Nanjing, China). The
protein concentrations were determined the BCA assay
(Pierce, Rockford, IL, USA). A total of 50 μg of protein extract from each sample was boiled in Laemmli sample buffer [44] and loaded onto a 7.5 %, 10 % or 15 % SDS-PAGE gel. The separated proteins were transferred onto
nitrocellulose membranes (Bio Trace, Pall Co., Port
Washington, NY, USA). After transfer, the membranes
were blocked for 2 h at room temperature in blocking buffer (skim milk powder) and subsequently incubated with the following primary antibodies in dilution buffer
overnight at 4 °C: m-anti-TLR4 (1:200; sc-293072, Santa Cruz), rb-anti-NF-κB p65 (1:500; AN365, Beyotime, China), rb-anti-NF-κB phospho-p65 (ser536; 1:500; AN371, Beyotime, China), rb-anti-IL-1β (1:200; sc-7884, Santa Cruz), anti-IL-6 (1:200; sc-1265, Santa Cruz), rb-anti-TNFα (1:200; sc-8301, Santa Cruz), m-anti-β-Tubulin (1:5,000; KC-5T01, Kang Chen Bio-tech, China), GADPH (1:5,000; AP0066, Bioworld, USA), and rb-anti-β-actin (1:500; sc-130656, Santa Cruz). After washing
6 times in Tris-buffered saline with Tween (TBST), the membranes were incubated with goat anti-rabbit or goat
anti-mouse horseradish peroxidase (HRP)-conjugated secondary antibodies (1:10,000; SunshineBio, China) in dilution buffer for 2 h at room temperature. Next, the blots
were washed as previously described and developed with
enhanced chemiluminescence (ECL) using the LumiGlo substrate (Super Signal West Pico Trial Kit, Pierce). The
ECL signals were recorded using an imaging system
(Bio-Rad, Hercules, CA, USA) and analyzed using the Quantity
One software (Bio-Rad).
Statistical analysis
The data from milk and blood samples were
analyzed as repeated measures using the MIXED
procedures of SAS (SAS version 9.2, SAS Institute Inc.). For milk yield, milk fat, milk protein and milk lactose,
the effects of diet and week were considered fixed, and
the effect of week was analyzed as a repeated measure. The effect of goat was considered a random effect. For the LPS concentrations of the rumen and portal vein, as
well as the concentrations of primary pro-inflammatory
cytokines in the plasma of the portal vein, the effects
of diet and sampling time were considered fixed, and
the effect of sampling time was analyzed as a repeated measure. The effect of goat was also considered random. Additionally, the data regarding the mRNA and protein
expressions, the degree of chromatin compaction, and
the percentage of promoter methylation were analyzed
using the ANOVA package of SAS. The correlation coefficient between the mRNA expression levels and the
degree of chromatin compaction and between the degree of chromatin compaction and the percentages of promoter methylation were analyzed using Pearson’s model in SAS.
ACKNOWLEDGMENTS
This study was supported by the National Basic
Research Program of China (2011CB100802), the National
Natural Science Foundation of China (31172371), and
the Priority Academic Program Development of Jinagsu Higher Education Institutions (PAPD).
CONFLICTS OF INTEREST
The authors have no conflicts of interest to declare.
REFERENCES
1. Gozho GN, Krause DO and Plaizier JC. Rumen lipopolysaccharide and inflammation during grain adaptation and subacute ruminal acidosis in steers. J Dairy Sci. 2006; 89:4404-4413.
2. Li S, Khafipour E, Krause DO, Kroeker A, Rodriguez-Lecompte JC, Gozho GN and Plaizier JC. Effects of
subacute ruminal acidosis challenges on fermentation and
endotoxins in the rumen and hindgut of dairy cows. J Dairy Sci. 2012; 95:294-303.
3. Dong HB, Wang SQ, Jia YY, Ni YD, Zhang YS, Zhuang S, Shen XZ and Zhao RQ. Long-term effects of subacute
ruminal acidosis (SARA) on milk quality and hepatic gene
expression in lactating goats fed a high-concentrate diet. Plos One. 2013; 8:e82850.
4. Garrett EF, Pereira MN, Nordlund KV, Armentano LE, Goodger WJ and Oetzel GR. Diagnostic methods for the detection of subacute ruminal acidosis in dairy cows. J Dairy Sci. 1999; 82:1170-1178.
5. Emmanuel DGV, Madsen KL, Churchill TA, Dunn SM and Ametaj BN. Acidosis and lipopolysaccharide from Escherichia coli B : 055 cause hyperpermeability of rumen and colon tissues. J Dairy Sci. 2007; 90:5552-5557. 6. Tao S, Duanmu Y, Dong H, Tian J, Ni Y and Zhao R. A
high-concentrate diet induced colonic epithelial barrier disruption is associated with the activating of cell apoptosis
in lactating goats. BMC veterinary research. 2014; 10:235. 7. Liu JH, Xu TT, Zhu WY and Mao SY. A high-grain diet
alters the omasal epithelial structure and expression of tight junction proteins in a goat model. Vet J. 2014; 201:95-100. 8. Jia YY, Wang SQ, Ni YD, Zhang YS, Zhuang S and Shen
XZ. High concentrate-induced subacute ruminal acidosis (SARA) increases plasma acute phase proteins (APPs) and
cortisol in goats. Animal. 2014; 8:1433-1438.
9. Zhou J, Dong GZ, Ao CJ, Zhang S, Qiu M, Wang X, Wu YX, Erdene K, Jin L, Lei CL and Zhang Z. Feeding a
high-concentrate corn straw diet increased the release of
endotoxin in the rumen and pro-inflammatory cytokines
in the mammary gland of dairy cows. BMC veterinary
research. 2014; 10:172.
10. Khafipour E, Krause DO and Plaizier JC. A grain-based
subacute ruminal acidosis challenge causes translocation of
lipopolysaccharide and triggers inflammation. J Dairy Sci. 2009; 92:1060-1070.
11. Plaizier JC, Khafipour E, Li S, Gozho GN and Krause DO. Subacute ruminal acidosis (SARA), endotoxins and health consequences. Anim Feed Sci Tech. 2012; 172:9-21. 12. Dong GZ, Liu SM, Wu YX, Lei CL, Zhou J and Zhang S.
Diet-induced bacterial immunogens in the gastrointestinal
tract of dairy cows: Impacts on immunity and metabolism.
Acta Vet Scand. 2011; 53:48.
13. Sass G, Heinlein S, Agli A, Bang R, Schumann J and Tiegs G. Cytokine expression in three mouse models of experimental hepatitis. Cytokine. 2002; 19:115-120. 14. Ji XH, Sun KY, Feng YH and Yin GQ. Changes of
inflammation-associated cytokine expressions during early phase of experimental endotoxic shock in macaques. World J Gastroentero. 2004; 10:3026-3033.
15. Akira S, Takeda K and Kaisho T. Toll-like receptors:
critical proteins linking innate and acquired immunity. Nat
Immunol. 2001; 2:675-680.
16. Beutler B and Rietschel ET. Innate immune sensing and
its roots: the story of endotoxin. Nat Rev Immunol. 2003;
3:169-176.
17. Hatada EN, Krappmann D and Scheidereit C. NF-kappa B and the innate immune response. Curr Opin Immun. 2000;
12:52-58.
18. Karin M and Lin A. NF-[kappa]B at the crossroads of life and death. Nat Immunol. 2002; 3:221-227.
19. Jiang L, Sorensen P, Rontved C, Vels L and Ingvartsen KL. Gene expression profiling of liver from dairy cows treated intra-mammary with lipopolysaccharide. BMC Genomics. 2008; 9:12.
20. Vels L, Rontved CM, Bjerring M and Ingvartsen KL. Cytokine and acute phase protein gene expression
in repeated liver biopsies of dairy cows with a
lipopolysaccharide-induced mastitis. J Dairy Sci. 2009;
92:922-934.
21. Liu SZ, Shi XM, Bauer I, Gunther J and Seyfert HM. Lingual antimicrobial peptide and IL-8 expression are
oppositely regulated by the antagonistic effects of NF-kappa B p65 and C/EBP beta in mammary epithelial cells.
Mol Immunol. 2011; 48:895-908.
22. Wiench M, Miranda TB and Hager GL. Control of nuclear receptor function by local chromatin structure. Febs J. 2011; 278:2211-2230.
23. Foster SL, Hargreaves DC and Medzhitov R. Gene-specific control of inflammation by TLR-induced chromatin modifications. Nature. 2007; 447:972-978.
24. Biswas SK and Lopez-Collazo E. Endotoxin tolerance: new mechanisms, molecules and clinical significance. Trends Immunol. 2009; 30:475-487.
an inflammatory response. J Dairy Sci. 2005; 88:1399-1403. 26. Dong GZ, Qiu M, Ao CJ, Zhou J, Khas E, Wang X, Zhang
Z and Yang Y. Feeding a high-concentrate corn straw diet
induced epigenetic alterations in the mammary tissue of
dairy cows. Plos One. 2014; 9:e107659.
27. Li S, Kroeker A, Khafipour E, Rodriguez JC, Krause DO and Plaizier JC. Effects of subacute ruminal acidosis challenges on lipopolysaccharide endotoxin (LPS) in the rumen, cecum, and feces of dairy cows. J Dairy Sci. 2010;
93:433-434.
28. Steele MA, Croom J, Kahler M, AlZahal O, Hook SE, Plaizier K and McBride BW. Bovine rumen epithelium
undergoes rapid structural adaptations during grain-induced
subacute ruminal acidosis. Am J Physiol-Regul Integr Comp Physiol. 2011; 300:R1515-R1523.
29. Liu JH, Xu TT, Zhu WY and Mao SY. High-grain
feeding alters caecal bacterial microbiota composition and
fermentation and results in caecal mucosal injury in goats. Brith J Nutr. 2014; 112:416-427.
30. Kim HM, Park BS, Kim JI, Kim SE, Lee J, Oh SC, Enkhbayar P, Matsushima N, Lee H, Yoo OJ and Lee JO. Crystal structure of the TLR4-MD-2 complex with bound endotoxin antagonist eritoran. Cell. 2007; 130:906-917. 31. Hayden MS and Ghosh S. NF-kappa B in immunobiology.
Cell Res. 2011; 21:223-244.
32. Kawai T and Akira S. TLR signaling. Cell Death Differ. 2006; 13:816-825.
33. Vallabhapurapu S and Karin M. Regulation and function
of NF-kappa B transcription factors in the immune system.
Annu Rev Immunol. 2009; 27:693-733.
34. Chang G, Petzl W, Vanselow J, Günther J, Shen X and
Seyfert H-M. Epigenetic mechanisms contribute to
enhanced expression of immune response genes in the liver of cows after experimentally induced escherichia coli mastitis. Vet J. 2015; 203:339-341.
35. Kooistra SM and Helin K. Molecular mechanisms and
potential functions of histone demethylases. Nat Rev Mol
Cell Bio. 2012; 13:297-311.
36. Pereira F, Barbachano A, Singh PK, Campbell MJ, Munoz A and Larriba MJ. Vitamin D has wide regulatory effects on histone demethylase genes. Cell Cycle. 2012; 11:1081-1089.
37. Bhandari SK, Ominski KH, Wittenberg KM and Plaizier JC. Effects of chop length of alfalfa and corn silage on milk production and rumen fermentation of dairy cows. J Dairy Sci. 2007; 90:2355-2366.
38. Khafipour E, Krause DO and Plaizier JC. Alfalfa
pellet-induced subacute ruminal acidosis in dairy cows increases
bacterial endotoxin in the rumen without causing inflammation. J Dairy Sci. 2009; 92:1712-1724.
39. Chang GJ, Zhang K, Xu TL, Jin D, Seyfert HM, Shen
XZ and Zhuang S. Feeding a high-grain diet reduces the percentage of LPS clearance and enhances immune gene
expression in goat liver. BMC Vet Res. 2015; 11:11.
40. Rao SH, Procko E and Shannon MF. Chromatin remodeling,
measured by a novel real-time polymerase chain reaction
assay, across the proximal promoter region of the IL-2 gene. J Immunol. 2001; 167:4494-4503.
41. Vanselow J, Yang W, Herrmann J, Zerbe H, Schuberth HJ, Petzl W, Tomek W and Seyfert HM. DNA-remethylation
around a STAT5-binding enhancer in the alpha S1-casein promoter is associated with abrupt shutdown of alpha
S1-casein synthesis during acute mastitis. J Mol Endocrinol. 2006; 37:463-477.
42. De Oliveira NFP, Andia DC, Planello AC, Pasetto S, Marques MR, Nociti FH, Line SRP and De Souza AP.
TLR2 and TLR4 gene promoter methylation status during
chronic periodontitis. J Clin Periodontol. 2011; 38:975-983. 43. de Faria Amormino SA, Arao TC, Saraiva AM, Gomez
RS, Dutra WO, da Costa JE, de Fatima Correia Silva J and
Moreira PR. Hypermethylation and low transcription of
TLR2 gene in chronic periodontitis. Hum Immunol. 2013;
74:1231-1236.