Technology (IJRASET)
Parameter Optimization of Gas Metal Arc Welding
Using Taguchi Method
Prashanth Kumar.S1, Manivel Muralidaran.V2, Rajavelu.S3
1
PG Scholar,2Assistant Professor,3PG Scholar
Department of Mechanical Engineering, Kumaraguru College of Technology, Coimbatore
Abstract— Gas metal arc welding (GMAW) is currently one of the most popular welding methods, especially in industrial environments. In order to meet the global competition and the survival of products in the market a new way of thinking is necessary to change and improve the existing technology and to develop products at economical price. It means not only to invest in procuring new equipments but also effectively control the process variables involved in any manufacturing process. These process variables must be measured and controlled to get the desired valuable outputs. This paper presents a methodology to find optimum input variables in GMAW process using taguchi method. The typical process for welding parameters depends upon the ability to measure and control the process variables involved in the welding process.
Keywords— GMAW, input variables, weld bead geometry, signal to noise ratio.
I. INTRODUCTION
Gas metal arc welding (GMAW), sometimes referred to by its subtypes metal inert gas (MIG) welding or metal active gas (MAG) welding, is a welding process in which an electric arc forms between a consumable wire electrode and the workpiece metal, which heats the workpiece metal, causing them to melt, and join. Along with the wire electrode, a shielding gas feeds through the welding gun, which shields the process from contaminants in the air. The process can be semi-automatic or automatic. A constant voltage, direct current power source is most commonly used with GMAW, but constant current systems, as well as alternating current, can be used. There are four primary methods of metal transfer in GMAW, called globular, short circuiting, spray, and pulsed-spray, each of which has distinct properties and corresponding advantages and limitations.
Quality is an important factor in current manufacturing world. Quality can be defined as the degree of customer satisfaction. Quality of products depends on how it perform in desired circumstances. The quality of a weld depends on mechanical properties of the weld metal which in turns depends on metallurgical characteristics and mechanical composition of the weld. In other words, quality of weld depends on in process parameters. Gas Metal Arc Welding (GMAW) is a multi objective and multifactor metal fabrication technique.
II. GAS METAL ARC WELDING
Technology (IJRASET)
III. FILLER MATERIAL
In this work were used AWS: A5.18 Grade- Class ER70S-2 - This classification covers filler metals that contain small amounts of titanium, zirconium, and aluminum, in addition to the normal deoxidizing elements of manganese and silicon. These wires are commonly referred to as “triple deoxidized wires”. They will produce sound welds in all types of carbon or mild steels. They are especially suited for welding carbon steels that are rusty or have mill scale on the surface. Weld integrity will vary with the amount of oxides on the surface of the steel. They may be used with CO2, argon-CO2, or argon-O2 shielding gas mixtures. They work well in the short-circuiting mode for out-of-position welding.
IV. EXPERIMENTAL PROCEDURE
Fig.No.1GMAW Experimental setup
A. Materials And Methodology
The following machines and consumables were used for the purpose of conducting experiment. A constant current gas metal arc welding machine
Welding manipulator, Wire feeder,
Filler material Stainless Steel wire of 1.2mm diameter (ER – 70S 2),
Gas cylinder containing a mixture of890% argon and 20% of carbon dioxide, Alloy steel plate (grade EN – 8).
Technology (IJRASET)
Table 1. Chemical Composition of Base Metal
Element
Chemical Composition
En8 wt (%)
Min Max Observed
Carbon, C 0.35 0.45% 0.38%
Manganese, Mn 0.60 1.0% 0.91%
Silicon, Si 0.5 0.35% 0.21%
Sulphur, S -.-- 0.6 0.01%
[image:4.612.117.497.100.294.2]Phosphorus, P -.-- 0.6 0.01%
Table 2. Chemical Composition of Filler Wire Element Phosphorus,
P Aluminum, Al Silicon, Si Manganese, Mn Carbon, C Sulphur, S Zirconium, Zr Content %
0.025 0.05 0.45 0.9 0.150 0.035 0.02
B. Plan Of Investigation
The research work was carried out in the following steps. Identification of factors, finding the limit of process variables, development of design matrix, conducting experiments as per design matrix, recording responses, development of taguchi method and determination S/N ratio values.
1) Identification Of Factors: Welding parameters are the variables that can be changed or modified in the process and can affect the characteristics of the electric arc and modify the shape of the weld deposited. Since measured responses depend on many parameters, in this work are taken in consideration the variables which direct action and interaction have a significant influence on the external geometry of the weld bead (with shielding gas and electrode constant). Then, welding voltage, wire feed rate and welding speed were established as input variables.
2) Finding The Limit Of Process Variables: Balance among the input parameters in gas metal arc welding (GMAW) characterizes the metal transfer modes, microstructure and influences the geometry and mechanical properties of welded joints. The appropriate selection of microstructure is an important factor to futher improve the weldability, strength and toughness behaviour, the time involved in the production is more and also the processing steps are linearly increased. Costly and time consuming experiments are required in order to determine the optimal welding process parameters due to complex nature of the welding process. Problems that do not have algorithmic solutions or algorithmic solutions are too complex to be found.
Table 3. Welding parameters and respective levels
Parameters Factor Levels
Unit Notation -1 0 1
Welding Current Amps I 155 175 210
Welding Speed mm/min S 100 150 200
Welding Voltage voltage V 30 35 40
Technology (IJRASET)
3) Development Of Design Matrix
Trial Number
Design Matrix
V S F I
1. 1 1 1 1
2. 1 2 2 2
3. 1 3 3 3
4. 2 2 3 1
5. 2 3 1 2
6. 2 1 2 3
7. 3 3 2 1
8. 3 1 3 2
9. 3 3 2 1
I- Welding current; S- Welding speed; V- Welding voltage; F- Wire feed rate
4) Recording response: Impact Testing -- To check the toughness of the weld we have done the testing in charphy method to identify the weld quality of the material. After we had finished the welding, the work piece was marked and cut the specimens of standard size 55x10x10mm placed for charphy impact test in that v-groove point where we can check the load to the area of withstand capacity in the material. Toughness is, broadly, a measure of the amount of energy required to cause an item a test piece or a bridge or a pressure vessel to fracture and fail. The more energy that is required then the tougher the material. There are two main forms of impact test, the Izod and the Charpy test. Both involve striking a standard specimen with a controlled weight pendulum travelling at a set speed. The amount of energy absorbed in fracturing the test piece is measured and this gives an indication of the notch toughness of the test material. These tests show that metals can be classified as being either 'brittle' or 'ductile'. A brittle metal will absorb a small amount of energy when impact tested, a tough ductile metal a large amount of energy. It should be emphasised that these tests are qualitative, the results can only be compared with each other or with a requirement in a specification they cannot be used to calculate the fracture toughness of a weld or parent metal, such as would be needed to perform a fitness for service assessment. The Charpy specimen Unotch are used for the testing of brittle materials such as cast iron and for the testing of plastics. The Vnotch specimen is the specimen of choice for weld testing. The current British Standard for Charpy testing is BS EN ISO 1481: 2009 and the American Standard is ASTM E23. The standards differ only in the details of the strikers used. The standard CharpyV specimen, illustrated in Fig.1. is 55mm long, 10mm square and has a 2mm deep notch with a tip radius of 0.25mm machined on one face.
Fig.No.2 standard Charpy’V ‘specimen
Technology (IJRASET)
of the amount of energy absorbed in fracturing the specimen. Conventionally three specimens are tested at any one temperature, see
Fig.3, and the results averaged.
Fig.No.3 CHARPHY Testing Machine
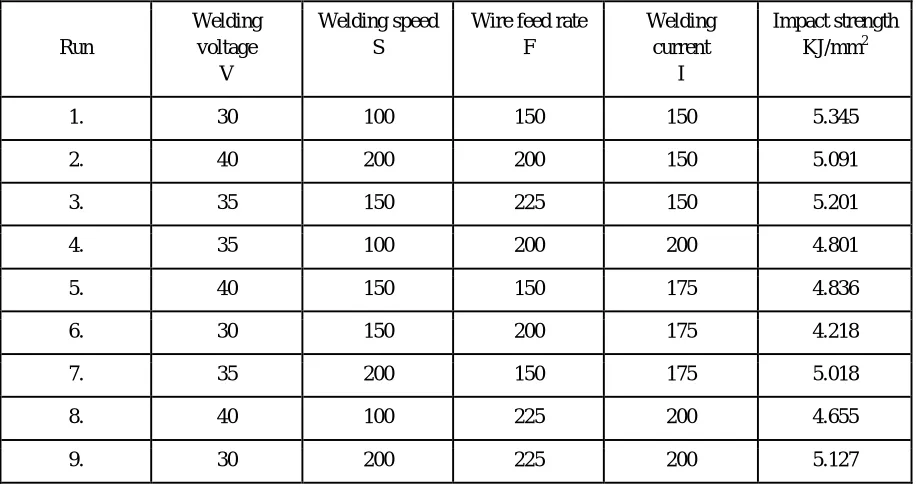
[image:6.612.116.530.119.288.2]By selecting the specimen with variables combinations of welding parameters marked points to the notch in the impact test we got the result by analyzing the nine specimens around the notch ones to minimize the error in the readings. The impact test values are shown in the table.
Table 5. Design of Experiments and Observed Values of Toughness
Run
Welding voltage
V
Welding speed S
Wire feed rate F
Welding current
I
Impact strength KJ/mm2
1. 30 100 150 150 5.345
2. 40 200 200 150 5.091
3. 35 150 225 150 5.201
4. 35 100 200 200 4.801
5. 40 150 150 175 4.836
6. 30 150 200 175 4.218
7. 35 200 150 175 5.018
8. 40 100 225 200 4.655
9. 30 200 225 200 5.127
V. RESULT AND DISCUSSION
A. Development Of Taguchi Method
Taguchi Analysis: Toughness versus V, S, F, I Linear Model Analysis: SN ratios versus V, S, F, I
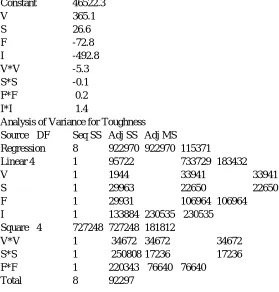
Estimated Regression Coefficients for SN ratios for Toughness Measurement as shown in the Minitab Calculation below,
[image:6.612.78.536.380.625.2]Technology (IJRASET)
Constant 46522.3
V 365.1
S 26.6
F -72.8
I -492.8
V*V -5.3
S*S -0.1
F*F 0.2
I*I 1.4
Analysis of Variance for Toughness
Source DF Seq SS Adj SS Adj MS
Regression 8 922970 922970 115371
Linear 4 1 95722 733729 183432
V 1 1944 33941 33941
S 1 29963 22650 22650
F 1 29931 106964 106964
I 1 133884 230535 230535
Square 4 727248 727248 181812
V*V 1 34672 34672 34672
S*S 1 250808 17236 17236
F*F 1 220343 76640 76640
Total 8 92297
[image:7.612.40.319.101.393.2]B. Determination S/N Ratio Values
Table 6 Response Table for Signal to Noise Ratios Larger is better
Level V S F I
1 13.75 13.85 14.09 14.34
2 13.99 13.50 13.42 13.40
3 13.73 14.11 13.96 13.73
Delta 0.26 0.61 0.66 0.94
Rank 4 3 2 1
Regression Analysis: T versus V, S, F, I
The regression equation is T = 6132 - 3.6 V + 0.88 S - 0.47 F - 6.42 I
Predictor Coef SE Coef T P
Constant 6132 1935 3.17 0.034
V -3.60 34.81 -0.10 0.023
S 0.878 3.537 0.25 0.016
F -0.473 4.832 -0.10 0.027
I -6.424 7.486 -0.86 0.039
Technology (IJRASET)
C. Conformation Test
Welding Current gives 37% on weld bead toughness is the first ranked position
Wire Feed Rate is the second ranked position on bead impact strength. It contributed 34% Welding speed parameter contributes 27% on stress load. So it is the third ranked
[image:8.612.119.494.195.339.2]Welding voltage has least contributed one. It is give 23%
Figure 4. Graph for signal to noise (S-N) ratio for toughness
VI. CONCLUSIONS
Based on the above study, it can be observed that the developed model can be used to identify the better combination of weld bead strength within the applied limits of process parameters. This method of predicting the process parameters can be used to get minimum percentage of welding dilution and maximum load withstand capacity of toughness properties. In this approach the seventh combinations is predicted as the optimized values within the constrained limits.
Toughness measurement results were analyzed by using Minitab Taguchi Signal to Noise Ratio method. This is the residual signal to noise ratio graph plotted and get the separate input parameters belongs their contribution both bead width is.
REFERENCES
[1] Azlan Mohad Zain, Habibullah Haron, Safian Sharif (2011). “Optimization of Process Parameters in Abrasive Water Jet Machining using Integrated SA-GA”,
Applied Soft Computing, 11, pp. 5350-5359.
[2] Kim, I, S., Son, K, J., Yang, Y, S., Yaragada, P.K.D.V. (2003). “Sensitivity Analysis for Process Parameters in GMA Welding Process Using Factorial Design
Method”, International Journal of Machine Tools and Manufacture, Vol. 43, pp. 763-769.
[3] Cochran, W. G., Coxz, G. M. (1987). Experimental Design, pp.370, New York, John Wiley & Sons.
[4] Serdar Karaoglu, Abdullah Secgin (2008). Sensitivity Analysis of Submerged Arc Welding Process Parameters, Journal of Material Processing Technology,
Vol-202, pp 500-507.
[5] Ghosh, P. K., Gupta, P. C., Goyal, V. K. (1998). Stainless Steel Cladding of Structural Steel Plate using the Pulsed Current GMAW Process, Welding-314.
[6] Gunaraj, V., Murugan, N. (1999). Prediction and Comparison of the Area of the Heat Effected Zone for the Bead on Plate and Bead on Joint in SAW of Pipes,
Journal of Material Processing Technology, Vol. 95, pp. 246-261.
[7] De Vedia, L. A., Svoboda, H. G., 2004. Introducción a la metalurgia de la soldadura, Universidad de Buenos Aires. ESAB, 2003. “MIG/MAG Welding,
Svetsaren the ESAB welding and cutting journal”. vol. 58, no 2.
[8] Esme U., Bayramoglu M., Kazancoglu Y., Ozgun S., 2011. Optimization of weld bead geometry in TIG welding process using grey relation analysis and
taguchi method, Materials and technology Vol. 43, p. 143-149.
[9] Gunaraj, V., Murugan, N., 1999. “Application of response surface methodology for predicting weld bead quality in submerged arc welding of pipes”, Journal
of Materials Processing Technology. Vol 88, Issues 1–3, p. 266–275.
[10] Iordachescu, D., Lucas, W., Ponomarev, V., 2006. Reviewing the “Classification of Metal Transfer”. IIW Doc., No. XII-1888-06, p 8.
[11] Vipin Kumar, Gajendra Singh & Mohd.Zaheer Khan Yusufzai, (2012) “ Effects of Process Parameters of Gas Metal Arc Welding on Dilution in Cladding of
Stainless Steel on Mild Steel”, MIITInternational Journal of Mechanical Enginering, Vol.2, No.2, pp.127-131.
[12] Mohd.Shoeb, Prof. Mohd. Parvez & Prof. Pratibha Kumari, (2013) “Effect of MIG Welding Input Process Parameters on Weld Bead Geometry on HSLA
Steel”, International Journal of Engineering Science and Technology, Vol.5, No.01, pp.200-212.
[13] Ghalib Than, Mohamad Yazman Yaakub, Sunhaji Kiyai Abas, Yupiter HP Manurung,& Bukhari Abu Jalil, (2012) “ Predicting the GMAW 3F T-Fillet
40 35 30 14. 2 14. 0 13. 8 13. 6 13. 4 200 150 100 225 200 150 14. 2 14. 0 13. 8 13. 6 13. 4 200 175 150 V M e a n o f S N r a ti o s S F I
Main Effects Plot for SN ratios
Data Means