5
XI
November 2017
Voltage Stability Analysis of Power System using
Power World Simulator
Manish Parihar1, M.K. Bhaskar2, Dharmendra Jain3, Digvijay Sarvate4, Deepak Bohra5
1,4,5
PG Scholar,3PhD Scholar, Dept. of EE, M.B.M. Engineering College, JNV University, Jodhpur, Rajasthan, India
2
Professor, Dept. of EE, M.B.M. Engineering College, JNV University, Jodhpur, Rajasthan, India
Abstract: Voltage stability analysis has become more important as a result of inadequate reactive support voltage profile dropped in transmission systems. Thus voltage stability is a significant factor, which needs to be taken into consideration during the planning and operation of electrical power systems in order to avoid voltage collapse or total blackout. PV curve analysis is used as basic tool for voltage stability. Better results were obtained on 3 bus test system for different power factor conditions.
Keywords: PV curve, voltage stability, power world simulator, voltage collapse, power factor
I. INTRODUCTION
Power system voltage stability involves generation, transmission and distribution [8]. It mainly focuses on determining the proximity of bus voltage magnitudes to predetermined and acceptable voltage magnitude. Angle stability focuses on the investigation of voltage angles. As the balance between supply and demand changes due to occurrences of a fault or disturbances in the system[1],[2]. A power system is said to have entered a state of voltage instability when a disturbance results in a progressive and uncontrollable dip in voltage. In order to increase reliability of the power system, to balance power generation-demand and supply energy to load centre at far distant interconnection of power system increasing day by day. Eventually due to its size system prone to disturbances and cascade failure which lead to total blackout (voltage collapse) of power system. Since the steady state analysis only involves the solution of algebraic equations it is computationally less extensive than dynamic analysis. Thus, lot of work is carried out to determine voltage stability on static analysis method [5],[6].
II. THEORETICALBACKGROUND
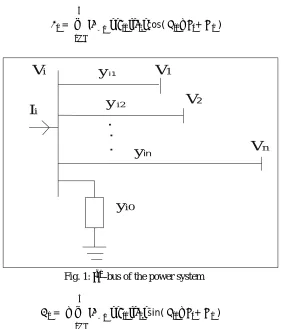
Newton Raphson iterative method is used for solving a set of various nonlinear equations with an equal number of unknowns. In this paper polar coordinate form is used [7]. As shown in figure the current entering at bus is given by equation
= − ≠
This equation can be rewritten in terms of the bus admittance matrix as
= ∑ , expressing in polar form we have
= ∠ +
Complex power at bus is − = ∗
= − ≠
This equation can be rewritten in terms of the bus admittance matrix as
= ∑ , expressing in polar form we have = ∑ ∠ +
Complex power at bus is − = ∗
Substituting the value of current in complex power equation we get
= cos( − + )
I
iV
iy
i1y
i2 [image:3.612.172.453.73.402.2].
.
.
y
iny
i0V
1V
2V
nFig. 1: bus of the power system
= − sin( − + )
Elements of Jacobian matrix is obtained by taking partial derivatives of above equations with respect to magnitude and phase angle of voltages i.e., and and computed with latest voltage estimate and computed power. The Jacobian matrix gives the
linearised relationship between small changes in magnitude and phase angle of voltages i.e., ∆ and ∆ with the small changes in real and reactive power ∆ and ∆ . Solution of equation provides better estimates of solution.
∆
∆ =
∆ ∆
The term ∆ and ∆ known as power residue or mismatch, given by
∆ = − ∆ = − ∆ ∆ = ∆ ∆
The new estimate for bus voltages are = +∆ and = +∆| |.
Above theory used in calculation of line flows, voltages at bus which is a tedious process. Thus simulation software power world simulator is used for analyzing the power system network and helps in better understanding of power system i.e. dynamic and real time monitoring of critical parameters like voltage, current, frequency, load angles, line flow etc. is possible.
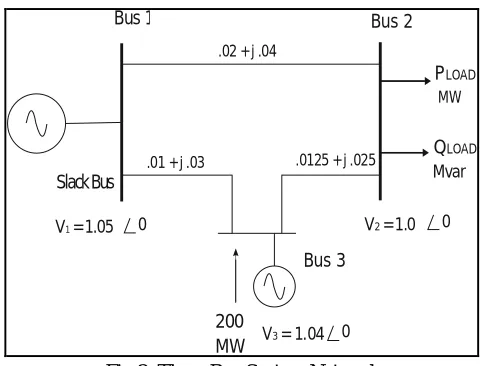
III. CASESTUDY
Bus 2
Bus 3
.02 + j .04
.01 + j .03 .0125 + j .025
Slack Bus
V1 = 1.05 0
̥
PLOAD MW QLOAD Mvar 200MW V3 = 1.04 0
̥
0
̥
V2 = 1.0
Fig 2: Three Bus System Network
Load real power ( \ ) is incremented and load reactive power is ( \ ) is given by = tan and constant generator real power = 200 .
A. Case Study I
[image:4.612.185.425.73.256.2]By varying load power and = tan and constant generator real power = 200 and power factor = 45° . And the results obtained using power world simulator is shown below Table I:
TABLE I
Complex Power And Voltages At 45 Degree Lagging
MW Mvar . MW Mvar Mvar
0 0 1.04 1.63 -196 131 -121 2.67
100 100 1.02 .76 -96 145 -36.4 1.92
300 300 .97 -1.12 115 181 149.1 .30
600 600 .89 -4.41 474 265 485.7 -2.53
900 900 .77 -8.85 933 418 961.3 -6.34
1000 1000 .71 -10.9 1140 506 1195.9 -8.16
1100 1100 .62 -14.2 1445 660 1569.3 -10.97
1130 1130 .56 -16.4 1642 777 1831.9 -12.91
1133 1133 .54 -17.2 1702 815 1916.2 -13.52
1134 1134 .53 -17.5 1729 833 1954.3 -13.79
Fig 3: 3 Bus Systemat 45 Degree Lagging power factor
= 100 and = 100
B. Study II
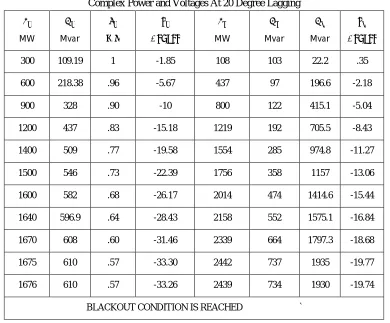
By varying load power and = tan and constant generator real power = 200 and power factor = 20° .And the results obtained using power world simulator is shown below Table II
TABLE II
Complex Power and Voltages At 20 Degree Lagging
MW Mvar . MW Mvar Mvar
300 109.19 1 -1.85 108 103 22.2 .35
600 218.38 .96 -5.67 437 97 196.6 -2.18
900 328 .90 -10 800 122 415.1 -5.04
1200 437 .83 -15.18 1219 192 705.5 -8.43
1400 509 .77 -19.58 1554 285 974.8 -11.27
1500 546 .73 -22.39 1756 358 1157 -13.06
1600 582 .68 -26.17 2014 474 1414.6 -15.44
1640 596.9 .64 -28.43 2158 552 1575.1 -16.84
1670 608 .60 -31.46 2339 664 1797.3 -18.68
1675 610 .57 -33.30 2442 737 1935 -19.77
1676 610 .57 -33.26 2439 734 1930 -19.74
[image:5.612.112.502.394.717.2]Fig 4: 3 Bus System at 20 Degree Lagging, = 300 and = 109 R
C. Case Study Iii
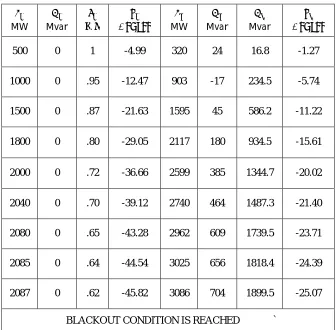
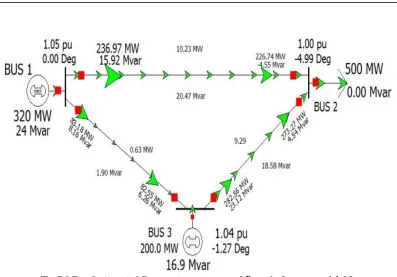
By varying load power and = tan and constant generator real power = 200 and power factor = 0° .And the results obtained using power world simulator is shown below Table III:
TABLE III
COMPLEX POWER AND VOLTAGES AT 0 DEGREE
MW Mvar . MW Mvar Mvar
500 0 1 -4.99 320 24 16.8 -1.27
1000 0 .95 -12.47 903 -17 234.5 -5.74
1500 0 .87 -21.63 1595 45 586.2 -11.22
1800 0 .80 -29.05 2117 180 934.5 -15.61
2000 0 .72 -36.66 2599 385 1344.7 -20.02
2040 0 .70 -39.12 2740 464 1487.3 -21.40
2080 0 .65 -43.28 2962 609 1739.5 -23.71
2085 0 .64 -44.54 3025 656 1818.4 -24.39
2087 0 .62 -45.82 3086 704 1899.5 -25.07
[image:6.612.138.474.373.703.2]Fig 5:3 Bus System at 0 Degree = 1500 and = 0
D. STUDY IV
By varying load power and = tan and constant generator real power = 200 and power factor = 20° . And the results obtained using power world simulator is shown below Table IV:
TABLE IV
COMPLEX POWER AND VOLTAGES AT 20 DEGREE LEAD
MW Mvar . MW Mvar Mvar
500 -182 1.03 -5.63 322 -45 -93 -1.27
1000 -364 1.01 -13.44 903 -155 8.4 -5.63
1500 -546 .97 -22.29 1571 -176 209.4 -10.70
2000 -728 .91 -33.43 2383 -50 584.4 -17.16
2300 -837 .84 -43.28 3036 189 1018.1 -22.86
2400 -873 .80 -48.49 3346 356 1281.9 -25.83
2470 -899 .73 -55.80 3731 628 1686.5 -29.91
2475 -900 .71 -58.25 3846 727 1830.9 -31.24
Figure 6:3 Bus System at 20 Degree Leading powe factor = 500 and =−182
When is increased further above voltage collapse point then simulation software generate message as shown below:
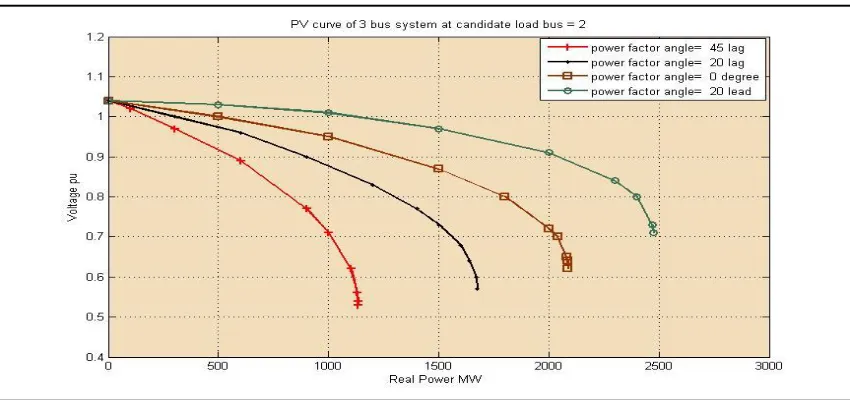
[image:8.612.94.519.511.711.2]Combining all curves for different power factor we get
From graphs and tables it is observed that as the load side power factor varies from lagging to leading condition then the loading of the power system increases and also voltage stability enhances. Thus, the monitoring of power system critical parameters such as voltages, load angle, line power flows etc. is possible and helps in study of its effect on power system operation.
IV. CONCLUSION
In this paper PV curve analysis is done for voltage stability analysis. Power flow program is developed using Matlab software and simulation in power world simulator to analyze power system network. It is observed that power factor at load side has significant effect on load ability, critical voltage point of the system. Thus reactive power compensation is necessary for stability purpose and to reduce drop in bus voltage. It is observed that deviation in generator load angles and create inadequate coupling between the generation system due to lag of synchronising power resulted in collapse of power system.
REFERENCES
[1]. Abhijit Chakrabarti, de Abhinandan, Mukhopadhyay A.K.,Kothari D.P., 2010,An Introduction to Reactive Power Control and Voltage Stability in Power Transmission Systems, PHI Learning Pvt. Ltd.
[2]. Basu, K. P., “Power Transfer Capability of Transmission Line Limited by Voltage Stability: Simple Analytical Expressions” IEEE Power Engineering Review, September 2000, pp 46-47.
[3]. Chemikala Madhava Reddy, Power System Voltage Stability Analysis, Department of Electrical Engineering June 2011
[4]. Khan, Asfar Ali, “PV Curves for Radial Transmission Lines”. Accepted for Publication in The Proceedings of National Systems Conference 2007 to be Held at Manipal Institute of Technology from 14-15 Dec.2007.
[5]. P. Kundur. Power System Stability and Control. McGraw Hill, New York, 1994
[6]. Peter W. Sauer, University of Illinois at Urbana-Champaign,Reactive Power and Voltage Control Issues in Electric Power System [7]. Hadi Sadat, 2002.Power System Analysis, 2nd ed., New York: McGraw-Hill.
[8]. M. Parihar, M.K. Bhaskar,“ Radial Transmission Line Voltage Stability Analysis”, IJRERD (ISSN: 2455-8761), VOLUME02-Issue 09, September 2017, PP. 01-07.
[9]. Mamta Tilwani,S C Choube, “Prediction of Voltage Collapse in Power System using Different Indices”, International Journal of Science and Research (IJSR) ,ISSN (Online): 2319-7064, 2013.