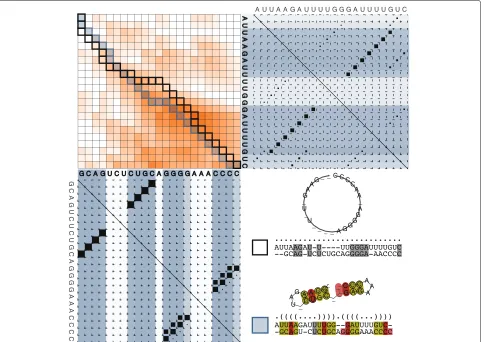
DotAligner: identification and clustering of RNA structure motifs
Full text
Figure


Related documents
In this paper, natural bond orbital (NBO) analysis, nonlinear optical and the thermodynamic properties of 10-Acetyl-10H-phenothiazine 5-oxide have been analyzed by
Ensure that TBA hours for Weekly Census classes are required each week , not as a total number of hours for the term. Ensure that TBA hours for Daily
Two milliliters of cell suspension with a cell concentration of 1×10 5 cells/mL was inoculated per well in 6-well plates for 24 h. After cooling at 4 °C for 30 min, the medium was
Using a wholesaler’s telephone sales campaign, we performed a quasi-experimental study focusing on the actual ordering behavior for a new product of more than
Here, we addressed this question in HEK 293 cells tran- siently expressing the FSH-R, by enhancing internaliza- tion with overexpressed wild-type β -arrestins or by interfering
Purpose: This study aims to analyze the relationship between single nucleotide polymorph- isms (SNPs) of COL1A1 and COL11A1 with class II skeletal malocclusion in Javanese ethnic
Among the five provinces, Tehran and Mashhad allocated the highest rates of ODD; Isfahan and Shiraz had the highest rates of ADHD; and Tabriz had the highest rates
Additional file 1: Table S1. List of Pfam families and the associated SCOP fold annotations obtained through mapping onto PDB entries. The frequency distribution of sequence
