Copyright © 2001, American Society for Microbiology. All Rights Reserved.
Comparison of Variable Number Tandem Repeat and IS
6110
-Restriction
Fragment Length Polymorphism Analyses for Discrimination of
High-and Low-Copy-Number IS
6110 Mycobacterium tuberculosis
Isolates
RACHAEL E. L. BARLOW,1DEBORAH M. GASCOYNE-BINZI,1,2* STEPHEN H. GILLESPIE,3
ANNE DICKENS,3SHABNAM QAMER,1ANDPETER M. HAWKEY1,2
The Division of Microbiology, School of Biochemistry & Molecular Biology, University of Leeds, Leeds LS2 9JT,1 Department of Microbiology, The General Infirmary, Leeds LS1 3EX,2and Department of Medical
Microbiology, Royal Free & University College Medical School, University College London, Royal Free Campus, London NW3 2PE,3United Kingdom
Received 16 October 2000/Returned for modification 24 January 2001/Accepted 29 April 2001
The present study was designed to evaluate the use of variable number tandem repeat (VNTR) and
IS6110-restriction fragment length polymorphism (RFLP) analyses in combination as a two-step strategy for
discrimination (as measured by the Hunter-Gaston Discrimination Index [HGDI]) of both high- and
low-copy-number IS6110 Mycobacterium tuberculosisisolates compared to IS6110-RFLP alone with an unselected
collection of isolates. Individually, IS6110-RFLP fingerprinting produced six clusters that accounted for 69%
of the low-copy-number IS6110isolates (five clusters) and 5% of the high-copy-number IS6110isolates (one
cluster). A total of 39% of all the isolates were clustered (HGDIⴝ0.97). VNTR analysis generated a total of
35 different VNTR allele profile sets from 93 isolates (HGDIⴝ0.938). Combining IS6110-RFLP analysis with
VNTR analysis reduced the overall percentage of clustered isolates to 29% (HGDIⴝ0.988) and discriminated
a further 27% of low-copy-number isolates that would have been clustered by IS6110-RFLP alone. The use of
VNTR analysis as an initial typing strategy facilitates further analysis by IS6110-RFLP, and more importantly,
VNTR analysis subdivides some IS6110-RFLP-defined clusters containing low- and single-copy IS6110isolates.
The genome ofMycobacterium tuberculosishas been shown to contain several polymorphic repetitive DNA elements that can be used to discriminate between isolates. Repetitive DNA elements which have been used in molecular typing studies include insertion sequences (IS), such as IS6110, the direct repeat elements (DR), the major polymorphic tandem repeat sequences (PGRS), the polymorphic GC-rich tandem repeat sequences (MPTR), (GTG)5, and exact tandem repeat (ETR)
sequences (10, 13, 15, 27, 28, 35, 38). Studies have shown that combinations of molecular typing methods utilizing different repetitive elements may improve discrimination between M. tuberculosisisolates (4, 18, 35, 37).
The method which is used most commonly for investigating the epidemiology of infection byM. tuberculosisis IS6110 re-striction fragment length polymorphism (IS6110-RFLP) anal-ysis (30). This method is based on the observation that RFLP patterns among non-epidemiologically related isolates show a high degree of variation (16, 21, 31). Patients infected by strains with identical IS6110-RFLP patterns (or one band dif-ference) are considered epidemiologically related (24, 31).M. tuberculosisisolates having identical IS6110fingerprints poten-tially represent the recent transmission of the isolate within a population and are likely to be part of a chain of transmission. Different sites within the genome of M. tuberculosis have been reported as hot spots for the integration of IS6110. These
include the DR locus, the ipllocus, the DK1 locus, and the dnaA-dnaN region (7, 9, 15, 19). This suggests that the inte-gration of IS6110is not a truly random event and the frequency of transposition is influenced by the site of insertion within the mycobacterial genome (22, 36). The identification of IS6110 in-sertion hot spots may complicate the interpretation of IS6110 -RFLP data. For strains containing low copy numbers of IS6110, integration hotspots may produce “false” clusters which must be subdivided by a second typing method independent of IS6110 (3, 6, 12, 14, 26, 29, 35, 37, 40, 41).
Despite the widespread use of IS6110-RFLP, this method is both technically demanding and time consuming. The compar-ison of large numbers of RFLP fingerprints, even with the introduction of computerized gel documentation systems, can still be problematic. The ideal system for the documentation of typing data would be a simple typing method, which produces a digital profile. Variable number tandem repeat (VNTR) analysis is one typing method which produces such data (10). VNTR analysis consists of the PCR amplification of five sep-arate ETR sequences (ETR-A to ETR-E). These loci are poly-morphic due to the addition or deletion of repeats. The size of PCR product produced at each locus corresponds to the num-ber of repeats. A five-digit numerical allele profile is generated which can be simply stored in either a database or spreadsheet format.
VNTR analysis has been shown to be reproducible both within and between laboratories (11, 18; R. Frothingham, P. L. Strickland, K. A. Davis, A. J. Cobb, D. M. Gascoyne-Binzi, C. Sola, M. A. Behr, and K. Kremer, Tuberculosis: Past, Present and Future [meeting], abstr. 170, 2000). However, studies have shown that VNTR analysis does not offer the same degree of
* Corresponding author. Mailing address: The Division of Micro-biology, Department of MicroMicro-biology, The General Infirmary, Great George Street, Leeds LS1 3EX, United Kingdom. Phone: (44)-113– 2335592. Fax: (44)-113–2335638. E-mail: [email protected] .ac.uk.
2453
on May 15, 2020 by guest
http://jcm.asm.org/
strain discrimination as methods based on IS6110 (18, 39). Since VNTR analysis detects polymorphisms in five indepen-dent genetic loci, it would be a useful method for subdividing isolates with low copy numbers of IS6110, which are poorly discriminated by IS6110-RFLP (18; Frothingham et al., Tuber-culosis: Past, Present and Future [meeting], abstr. 170).
This retrospective study was designed to compare VNTR analysis, as an initial typing step in a combined strategy to discriminate both high- and low-copy-number IS6110 M. tuber-culosisisolates, with IS6110-RFLP alone. The level of discrim-ination for each typing method was calculated using the Hunt-er-Gaston Discriminatory Index (HGDI) (17). The HGDI is a mathematical model based on the probability of two strains in a test population being characterized as unrelated by the typ-ing method in question and may be used to compare typtyp-ing methods.
MATERIALS AND METHODS
Mycobacterial genomic DNA.Genomic DNA from 93 cultures ofM. tubercu-losisisolated from an unselected population from Tanzania were obtained as previously described (12). Each DNA sample had been analyzed previously by IS6110-RFLP as described by van Soolingen (12, 33). Isolates which generated five or fewer bands were defined as low IS6100copy number, and those with nine or more bands were considered high copy number. Forty-eight isolates were identified as having a low copy number ofIS6110(of which 19 possessed a single copy of IS6110), and 42 were identified as high-copy-number IS6110isolates. IS6110-RFLP data was unavailable for three isolates due to their nonviability (12). In this study, an IS6110-RFLP cluster was defined as a collection of isolates that shared 100% fingerprint identity.
VNTR analysis.VNTR analysis was performed using the primers for the five loci ETR-A to ETR-E as described by Frothingham and Meeker-O’Connell (10) (Table 1). Each PCR was carried out in a final volume of 25l containing 25 pmol of the appropriate primer pair, 2.5l of GeneAmp PCR Buffer II (PE Applied Biosystems, Warrington, United Kingdom), 1.5 mM MgCl2, 200M
dNTP mix (Amersham), 4% (vol/vol) dimethyl sulfoxide, 0.2 U of AmpliTaq Gold (PE Applied Biosystems), and 1 ng of template DNA. Following an initial denaturation at 95°C for 12 min, 35 cycles of 94°C for 30 s, 60°C for 1 min, and 72°C for 1 min were performed. The PCR was completed by a final extension phase of 72°C for 5 min.
Amplicons were separated through a 2% Metaphor Agarose (Flowgen, Ashby de la Zouch, United Kingdom) gel in 1⫻Tris-borate-EDTA buffer, and visual-ized with ethidium bromide staining. The number of repeats for each VNTR locus was calculated from the size of the PCR amplicon (10).
Cluster analysis.For VNTR analysis, the number of repeats for each VNTR locus was recorded as a five-digit allele profile which was stored and sorted using an Access database (version 2.0; Microsoft). A VNTR profile set was defined as a collection of isolates that shared identical VNTR allele profiles. A single step transition in the number of repeats at any given VNTR locus was calculated to reduce VNTR profile similarity by 5%.
Once VNTR profile sets had been identified, IS6110fingerprints for the appropriate isolates were compared against each other using the GelCompar software (version 4.0; Applied Maths, Kortrijk, Belgium). Cluster analysis was performed by the calculation of the Dice coefficient, and similarity (as defined by the Dice coefficient) was calculated using the parameter settings at 0.8% band position tolerance (12). A combined cluster was defined as a series of isolates that had both the same VNTR allele profile and 100% IS6110fingerprint iden-tity. The isolate clustering data obtained by combining IS6110-RFLP and VNTR analyses for both high and low copy numbers of IS6110were compared to those produced by IS6110-RFLP alone.
Statistical analysis.The HGDI (17) was calculated using the following for-mula:
D⫽1⫺
冤
N共N1⫺1兲冘
j⫽1 s
nj共nj⫺1兲
冥
whereDis the numerical index of discrimination,Nis the total number of strains in the typing scheme,sis the total number of different strain types, andnjis the number of strains belonging to thejth type.
RESULTS
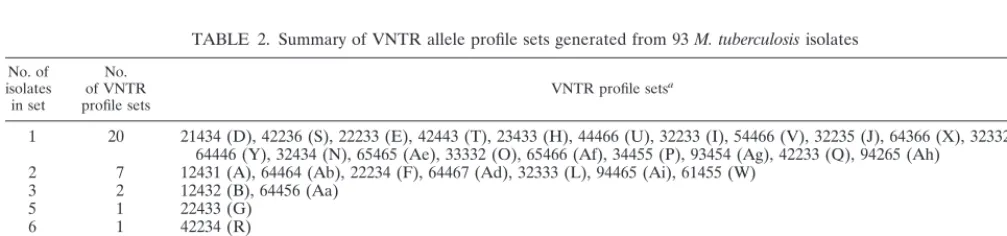
VNTR analysis.VNTR allele profiles were generated for all
93 isolates including nonviable cultures. A total of 35 different profile sets were identified which were coded alphabetically following the numerical order of the VNTR profiles. Table 2 summarizes the VNTR profiles obtained and the number of isolates represented by each profile. VNTR analysis clustered 78% (73 of 93) of the isolates investigated, with clusters rang-ing in size from 2 to 17 isolates. The remainrang-ing 22% of isolates (20 of 93) generated unique VNTR allele profiles.
IS6110-RFLP.Of the 90 samples with IS6110-RFLP
[image:2.612.54.294.90.208.2]finger-print data available (42 high-copy-number and 48 low-copy-number isolates), six clusters were identified, which contained 35 isolates (39%) in total. Of these, two clusters contained all of the single-copy IS6110isolates (Table 3, clusters 4 and 5),
TABLE 1. Summary of PCR primers used for VNTR analysis and ETR repeat sizes
Locus
designation Primer sequence (5⬘–3⬘) Repeat size inH37RV (bp)
ETR-A AAATCGGTCCCATCACCTTCTTAT 75 CGAAGCCTGGGGTGCCCGCGATTT
ETR-B GCGAACACCAGGACAGCATCATG 57 GGCATGCCGGTGATCGAGTGG
ETR-C GTGAGTCGCTGCAGAACCTGCAG 58 GGCGTCTTGACCTCCACGAGTG
ETR-D CAGGTCACAACGAGAGGAAGAGC 77 GCGGATCGGCCAGCGACTCCTC
ETR-E CTTCGGCGTCGAAGAGAGCCTC 53 CGGAACGCTGGTCACCACCTAAG
TABLE 2. Summary of VNTR allele profile sets generated from 93M. tuberculosisisolates
No. of isolates in set
No. of VNTR
profile sets VNTR profile sets
a
1 20 21434 (D), 42236 (S), 22233 (E), 42443 (T), 23433 (H), 44466 (U), 32233 (I), 54466 (V), 32235 (J), 64366 (X), 32332 (K), 64446 (Y), 32434 (N), 65465 (Ae), 33332 (O), 65466 (Af), 34455 (P), 93454 (Ag), 42233 (Q), 94265 (Ah)
2 7 12431 (A), 64464 (Ab), 22234 (F), 64467 (Ad), 32333 (L), 94465 (Ai), 61455 (W) 3 2 12432 (B), 64456 (Aa)
5 1 22433 (G) 6 1 42234 (R) 7 1 64455 (Z)
9 2 21433 (C), 32433 (M) 17 1 64466 (Ac)
aVNTR profile set codes in parentheses.
on May 15, 2020 by guest
http://jcm.asm.org/
[image:2.612.53.557.601.719.2]three clusters contained between 2 and 12 low-copy-number IS6110isolates (Table 3, clusters 1, 2, and 3), and one cluster contained two high-copy-number isolates. Sixty-nine percent (33 of 48) of the low-copy-number isolates formed five clusters, whereas only 5% (2 of 42) of the high-copy-number isolates were clustered (Table 3, cluster 6).
IS6110-RFLP and VNTR analysis combined.In total there
were 90 samples available for combined analysis by IS6110 -RFLP and VNTR. Table 3 is a summary of IS6110 -RFLP-defined clusters subdivided by VNTR analysis. Seventy percent (14 of 20) of samples that had a unique VNTR allele profile also had unique IS6110-RFLP fingerprints. Those VNTR pro-file sets which contained two or more isolates and which carried a high copy number of IS6110were not clustered by IS6110-RFLP (Fig. 1) except in one case (VNTR allele profile set A). This cluster contained only two high-copy-number IS6110isolates that had both the same VNTR allele profile and identical RFLP patterns. For the 48 low-copy-number isolates (including those that contained a single copy of IS6110), the percentage of clustered isolates fell from 69% (33
of 48) when analyzed by IS6110-RFLP alone to 50% (24 of 48) when both typing systems were used. Dendrograms construct-ed by Gelcompar for selectconstruct-ed VNTR profile sets are shown in Fig. 1 and 2; dendrograms for the remaining VNTR profile sets can be obtained upon request from S.H.G.
Statistical analysis.The HGDI was calculated for IS6110
[image:3.612.319.540.75.415.2]-RFLP, VNTR analysis, and for the two methods combined to determine the discriminatory indices for each (Table 4). When the HGDI for IS6110-RFLP analysis of low-copy-number iso-lates (0.892) was compared to the HGDI for the combined
FIG. 1. IS6110-RFLP patterns of VNTR profile set C (21433). Designations of isolates are shown at right. Numbers at the top indi-cate percent similarities of IS6110-RFLP patterns.
[image:3.612.54.300.90.278.2]FIG. 2. IS6110-RFLP analysis of VNTR set Ac (64466) and iso-lates with 90% or greater VNTR profile similarity. Designations of isolates, VNTR profile sets, and set codes are shown at right. Numbers at the top indicate percent similarities of IS6110-RFLP patterns. TABLE 3. Summary of the IS6110-RFLP clusters
subdivided by VNTR analysis
IS6110-RFLP cluster designation
No. of isolates
in cluster VNTR alleleprofile setsa
% VNTR profile similarity
within cluster
Cluster 1d 8 U (1), 44466e
Y (1), 64446e 80–90 Ac (6), 64466
Cluster 2d 4 X (1), 64366e
Ac (1), 64466e 90–95 Ad (2), 64467
Cluster 3d 2 Ac (1), 64466e 95
Af (1), 65466e Cluster 4b 12 P (1), 34455e
W (1), 61455e
Z (5), 64455 55–85 Aa (2), 64456
Ah (1), 94265e Ai (2), 94465
Cluster 5b 7 M (7), 32433 100
Cluster 6c 2 A (2), 12431 100
aNumber of isolates within VNTR profile in parentheses. bAll isolates contained only a single copy of IS6110. cIsolates had a high copy number of IS6110. dAll isolates contained five or fewer copies of IS6110.
eThese isolates were not clustered when VNTR analysis was applied before
[image:3.612.60.287.582.697.2]IS6110-RFLP.
TABLE 4. Discrimination index values (HGDI) for each typing method
Method
HGDI value for: Low-copy-number
isolatesa High-copy-numberisolates isolatesTotal
IS6110-RFLP 0.892 0.999 0.97
VNTR N/Ab N/A 0.938
IS6110-RFLP⫹VNTR 0.957 0.999 0.988
aIncludes single-copy isolates.
bN/A, not applicable (VNTR analysis does not distinguish between low and
high copy numbers of IS6110).
on May 15, 2020 by guest
http://jcm.asm.org/
[image:3.612.309.552.630.701.2]typing strategy (0.957), an increase in the level of discrimina-tion was observed.
DISCUSSION
The present study was designed to evaluate the use of VNTR analysis and IS6110-RFLP in combination as a two-step strat-egy to discriminate unselectedM. tuberculosis isolates, com-pared with IS6110-RFLP alone. The ability of the combined approach to subdivide isolates with low copy numbers of IS6110(i.e., five or fewer copies) was also examined.
Individually, IS6110-RFLP fingerprinting clustered 69% (five clusters) of the low-copy-number and 5% (one cluster) of the high-copy-number IS6110isolate. A total of 39% (35 of 90) of all the isolates were clustered (HGDI⫽0.97). A total of 35 different VNTR allele profile sets were identified from 93 isolates (HGDI⫽0.938), and these profiles shared between 15 and 95% VNTR profile similarity. This level of discrimination was greater than that found by Filliol et al., who identified only 12 VNTR profiles from 66M. tuberculosisisolates (HGDI⫽
0.863) (8). In that study, between 75 and 95% VNTR allele profile similarity was observed between isolates. This suggests that the level of discrimination of VNTR analysis is population dependent and emphasizes the requirement of a second typing method to further define VNTR profile sets.
Combining IS6110-RFLP with VNTR analysis reduced the overall percentage of clustered isolates to 29% (26 of 90; HGDI⫽0.988). For isolates with low copy numbers of IS6110, the degree of clustering decreased from 69% (33 of 48; HGDI⫽0.892) to 50% (24 of 48; HGDI⫽0.957). This value is comparable to a combination of spoligotyping and IS6110 -RFLP, which clustered 55% of similar isolates (2). Only two high-copy-number isolates had 100% identity by IS6110-RFLP typing and VNTR analysis (VNTR profile set A, 12431). These isolates may represent recent transmission within the commu-nity.
The Haarlem and Beijing families of strains ofM. tubercu-losishave specific genetic markers, which include characteristic VNTR profiles (18, 32). Strains of the Haarlem family ofM. tuberculosishave the VNTR allele profile 32333 and have been isolated in Asia, Europe, and the Americas (18). Among the isolates investigated in this study, only 2 out of 93 (2%) were identified with the Haarlem VNTR profile, compared to 36% (24 of 66) of isolates from the French Caribbean (8). This suggests that the Haarlem VNTR profile is not a predominant VNTR genotype in Tanzania.
The Beijing family of strains has been identified infrequently in Africa, although it is common in parts of the world, espe-cially Asia (25, 32). Beijing strains have the VNTR profile 42435, although variation may be shown in the number of repeats at a single locus (18). Assuming these strains share 85% or greater VNTR profile similarity, five isolates (5%; 5 of 93) from this study were identified as having a Beijing VNTR profile. Spoligotyping and IS6110-RFLP analysis of isolates from Tanzania have previously produced a similar percentage of Beijing isolates (4.5%; 4 of 88) (32).
When a single repeat difference between VNTR profiles was identified (i.e., 5% difference in VNTR similarity), the isolates within these groups generally showed a relatively high degree of similarity by IS6110-RFLP analysis. For example, profiles A
(12431) and B (12432) were found to have 78% similarity by IS6110-RFLP; profiles C (21433) and D (21434) showed 98% IS6110-RFLP pattern similarity. This may represent the rela-tively recent development of these VNTR profiles from com-mon genetic ancestors. Conversely, VNTR profiles that had a low degree of similarity also had reduced IS6110-RFLP relat-edness. For example, profile sets A (12431) and Ai (94465) showed 15% VNTR similarity and 35% IS6110relatedness.
The most common VNTR profile set identified (Ac, 64466) accounted for 18% (17 of 93) of all the isolates analyzed. Interestingly, 71% (34 of 48) of the low-copy IS6110isolates in the study either had the VNTR profile Ac or showed a 90% or greater VNTR profile similarity to Ac (Fig. 2). This may reflect the VNTR allele profile development of particular clones ofM. tuberculosis in Tanzania. A similar pattern was noted in the French Caribbean, where 73% (48 of 66) of M. tuberculosis isolates were clustered into 12 VNTR profile sets (8). Thirty-three percent (24 of 66) of all isolates examined had the Haar-lem VNTR profile (32333), and a further 27% (18 of 66) isolates showed 90% or greater VNTR profile similarity (8). This suggests that there is a predominance ofM. tuberculosis isolates with similar VNTR profiles within discrete geograph-ical areas and that evolution of these strains is being reflected by the VNTR profiles in the community. This supports the hypothesis that evolution of strains may be studied using VNTR analysis (8).
The stability of VNTR allele profiles inM. tuberculosishas not been determined to date. M. tuberculosisH37 was isolated in 1905, and the two variants H37Rv and H37Ra were identi-fied during the 1930s. These variants show different IS6110 -RFLP profiles but still share the same VNTR profile (10, 18, 20, 30). The estimated minimum time for a single step transi-tion at a VNTR locus is 65 years, slower than the predicted rate of change for an IS6110-RFLP pattern (1, 5, 23, 24, 34, 42). It has been suggested that IS6110-RFLP fingerprints in docu-mented transmission chains show a higher degree of stability than that observed for serial patient-derived isolates (24). Since VNTR allele profiles are stable over long periods of time, it is likely that the VNTR allele profiles of serial patient-derived and epidemiologically related isolates will remain con-stant over time, unlike IS6110-RFLP fingerprints, which are reported to vary by one to two bands.
In conclusion, for isolates that contained a high copy num-ber of IS6110, VNTR analysis produced large clusters that were subdivided further by IS6110-RFLP. For isolates contain-ing a scontain-ingle copy or low copy numbers of IS6110, combined VNTR and IS6110-RFLP analysis distinguished a further 27% (9 of 33) that would have been clustered by IS6110-RFLP alone. The use of VNTR analysis as an initial typing strategy produces small, manageable collections of isolates, facilitating further investigations by more discriminatory typing tech-niques, such as IS6110-RFLP. More importantly, VNTR anal-ysis may provide additional discrimination for typing of isolates that contain a single copy or a low copy number of IS6110.
ACKNOWLEDGMENTS
This work was supported by the Wellcome Trust (Wellcome grant number 054885).
We thank R. Frothingham (Durham VA Medical Center, Durham, N.C.) for helpful discussions and advice regarding VNTR analysis.
on May 15, 2020 by guest
http://jcm.asm.org/
REFERENCES
1.Alito, A., N. Morcilli, S. Scipioni, A. Dolmann, M. I. Romano, A. Cataldi, and D. van Soolingen.1999. The IS6110restriction fragment length polymor-phism in particular multidrug-resistantMycobacterium tuberculosisstrains may evolve too fast for reliable use in outbreak investigation. J. Clin. Mi-crobiol.37:788–791.
2.Bauer, J., A. B. Andersen, K. Kremer, and H. Miorner.1999. Usefulness of spoligotyping to discriminate IS6110low-copy-numberMycobacterium tuber-culosiscomplex strains cultured in Denmark. J. Clin. Microbiol.37:2602– 2606.
3.Burman, W. J., R. R. Reves, A. P. Hawkes, C. A. Rietmeijer, Z. H. Yang, H. el Hajj, J. H. Bates, and M. D. Cave.1997. DNA fingerprinting with two probes decreases clustering ofMycobacterium tuberculosis. Am. J. Respir. Crit. Care Med.155:1140–1146.
4.Chaves, F., Z. Yang, H. El Hajj, M. Alonso, W. J. Burman, K. D. Eisenach, F. Dronda, J. H. Bates, and M. D. Cave.1996. Usefulness of the secondary probe pTBN12 in DNA fingerprinting ofMycobacterium tuberculosis. J. Clin. Microbiol.34:1118–1123.
5.De Boer, A. S., M. W. Borgdorff, P. E. W. de Haas, N. J. D. Nagelkerke, J. D. A. van Embden, and D. van Soolingen.1999. Analysis of rate of change of IS6110 RFLP patterns of Mycobacterium tuberculosisbased on serial patient isolates. J. Infect. Dis.180:1238–1244.
6.De la Salmoniere, Y. O. G., H. M. Li, G. Torrea, A. Bunschoten, J. D. A. van Embden, and B. Gicquel.1997. Evaluation of spoligotyping in a study of the transmission ofMycobacterium tuberculosis. J. Clin. Microbiol.35:2210–2214. 7.Fang, Z., and K. J. Forbes.1997.Mycobacterium tuberculosisIS6110 prefer-ential locus (ipl) for insertion into the genome. J. Clin. Microbiol.35:479– 481.
8.Filliol, I., S. Ferdinand, L. Negroni, C. Sola, and N. Rastogi.2000. Molecular typing ofMycobacterium tuberculosisbased on variable number of tandem repeats used alone and in association with spoligotyping. J. Clin. Microbiol.
38:2520–2524.
9.Fomukong, N., M. Beggs, H. el Hajj, G. Templeton, K. Eisenach, and M. D. Cave.1998. Differences in the prevalence of IS6110insertion sites in Myco-bacterium tuberculosisstrains: low and high copy number of IS6110. Tuber. Lung Dis.78:109–116.
10. Frothingham, R., and W. A. Meeker-O’Connell.1998. Genetic diversity in theMycobacterium tuberculosiscomplex based on variable number tandem repeats. Microbiology144:1189–1196.
11. Gascoyne-Binzi, D. M., R. E. L. Barlow, R. Frothingham, G. Robinson, T. A. Collyns, R. Gelletlie, and P. Hawkey.2001. Rapid identification of laboratory contamination withMycobacterium tuberculosisusing variable number tan-dem repeat (VNTR) analysis. J. Clin. Microbiol.39:69–74.
12. Gillespie, S. H., A. Dickens, and T. D. McHugh.2000. False molecular clusters due to nonrandom association of IS6110withMycobacterium tuber-culosis. J. Clin. Microbiol.38:2081–2086.
13. Goyal, M., D. Young, Z. Zhang, P. A. Jenkins, and R. J. Shaw.1994. PCR amplification of variable sequences upstream ofkatGgene to subdivide strains ofMycobacterium tuberculosiscomplex. J. Clin. Microbiol.32:3070– 3071.
14. Goyal, M., N. A. Saunders, J. D. A. van Embden, D. B. Young, and R. J. Shaw.1997. Differentiation ofMycobacterium tuberculosisisolates by spoli-gotyping and IS6110restriction fragment length polymorphism. J. Clin. Mi-crobiol.35:647–651.
15. Hermans, P. W. M., D. van Soolingen, E. M. Bik, P. E. W. de Haas, J. W. Dale, and J. D. A. van Embden.1991. The insertion element IS987from
Mycobacterium bovisBCG is located in a hot spot integration region for insertion elements inMycobacterium tuberculosis complex strains. Infect. Immun.59:2695–2705.
16. Hermans, P. W. M., D. van Soolingen, J. W. Dale, A. R. J. Schuitema, R. A. McAdam, D. Catty, and J. D. A. van Embden.1990. Insertion element IS986
fromMycobacterium tuberculosis: a useful tool for the diagnosis and epide-miology of tuberculosis. J. Clin. Microbiol.28:2051–2058.
17. Hunter, P. R., and M. A. Gaston.1988. Numerical index of the discrimina-tory ability of typing systems: an application of Simpson’s index of diversity. J. Clin. Microbiol.26:2465–2466.
18. Kremer, K., D. van Soolingen, R. Frothingham, W. H. Haas, P. W. M. Hermans, C. Martin, P. Palittapongarnpim, B. B. Plikaytis, L. W. Riley, M. A. Yakrus, J. M. Musser, and J. D. A. van Embden.1999. Comparison of methods based on different molecular epidemiological markers for typing of
Mycobacterium tuberculosiscomplex strains: interlaboratory study of discrim-inatory power and reproducibility. J. Clin. Microbiol.37:2607–2618. 19. Kupepina, N. E., S. Sreevatsan, B. B. Plikaytis, P. J. Bifani, N. D. Connell,
R. J. Donnelly, D. van Soolingen, J. M. Musser, and B. N. Kreiswirth.1998. Characterization of the phylogenetic distribution and chromosomal insertion sites of five IS6110elements inMycobacterium tuberculosis: non-random integration in thednaA-dnaNregion. Tuber. Lung Dis.79:31–42. 20. Lari, N., L. Rindi, C. Lami, and C. Garzelli.1999. IS6110-based restriction
fragment length polymorphism (RFLP) analysis ofMycobacterium tubercu-losisH37Rv and H37Ra. Microb. Pathog.26:281–286.
21. Mazurek, G. H., M. D. Cave, K. D. Eisenach, R. J. Wallace, J. H. Bates, and J. T. Crawford.1991. Chromosomal DNA fingerprint patterns produced with IS6110as strain-specific markers for epidemiologic study of tuberculosis. J. Clin. Microbiol.29:2030–2033.
22. McHugh, T. D., and S. H. Gillespie.1998. Nonrandom association of IS6110
andMycobacterium tuberculosis: implications for molecular epidemiological studies. J. Clin. Microbiol.36:1410–1413.
23. Niemann, S., E. Richter, and S. Rusch Gerdes.1999. Stability of IS6110
restriction length polymorphism patterns of multidrug-resistant Mycobacte-rium tuberculosisstrains. J. Clin. Microbiol.37:3078.
24. Niemann, S., Ru¨sch-Gerdes, E. Richter, H. Thielen, H. Heykes-Uden, and R. Diel.2000. Stability of IS6110restriction fragment length polymorphism patterns ofMycobacterium tuberculosisstrains in actual chains of transmis-sion. J. Clin. Microbiol.38:2563–2567.
25. Park, Y., G. Bai, and S. Kim.2000. Restriction fragment length polymor-phism analysis ofMycobacterium tuberculosisisolated from countries in the Western Pacific region. J. Clin. Microbiol.38:191–197.
26. Portugal, I., S. Maia, and J. Moniz-Pereira.1999. Discrimination of multi-drug-resistantMycobacterium tuberculosisIS6110fingerprint subclusters by
rpoBgene mutations. J. Clin. Microbiol.37:3022–3024.
27. Ross, B. C., K. Raios, K. Jackson, and B. Dwyer.1992. Molecular cloning of a highly repetitive DNA element fromMycobacterium tuberculosisand its use as an epidemiological tool. J. Clin. Microbiol.30:942–946.
28. Thierry, D., A. Brisson-Noel, V. Vincent-Levy-Frebault, S. Nguyen, J. Gues-don, and B. Gicquel.1990. Characterization of aMycobacterium tuberculosis
insertion sequence, IS6110, and its application in diagnosis. J. Clin. Micro-biol.28:2668–2673.
29. Torrea, G., G. Levee, P. Grimont, C. Martin, S. Chanteau, and B. Gicquel.
1995. Chromosomal DNA fingerprint analysis using the insertion sequence IS6110and the repetitive element DR as strain-specific markers for epide-miological study of tuberculosis in French Polynesia. J. Clin. Microbiol.
33:1899–1904.
30. van Embden, J. D. A., M. D. Cave, J. T. Crawford, J. W. Dale, K. D. Eisenach, B. Gicquel, P. Hermans, C. Martin, R. McAdam, T. M. Shinnick, and P. M. Small.1993. Strain identification ofMycobacterium tuberculosisby DNA fingerprinting: recommendations for a standardized methodology. J. Clin. Microbiol.31:406–409.
31. van Soolingen, D., and P. W. M. Hermans.1995. Epidemiology of tubercu-losis by DNA fingerprinting. Eur. Respir. J.8:(Suppl. 20):649s–656s. 32. van Soolingen, D., L. Qian, P. E. W. de Haas, J. T. Douglas, H. Traore,
F. Portaels, H. Zi Qing, D. Enkhsaikan, P. Nymadawa, and J. D. A. van Embden.1995. Predominance of a single genotype ofMycobacterium tuber-culosisin countries of East Asia. J. Clin. Microbiol.33:3234–3238. 33. van Soolingen, D., P. E. W. de Haas, P. W. M. Hermans, and J. D. A. van
Embden.1994. DNA-fingerprinting ofMycobacterium tuberculosis. Methods Enzymol.235:196–205.
34. van Soolingen, D., P. W. M. Hermans, P. E. W. de Hass, D. R. Soll, and J. D. A. van Embden.1991. Occurrence and stability of insertion sequences inMycobacterium tuberculosiscomplex strains: evaluation of an insertion sequence-dependent DNA polymorphism as a tool in the epidemiology of tuberculosis. J. Clin. Microbiol.29:2578–2586.
35. van Soolingen, D., P. E. W. de Haas, P. W. Hermans, P. M. A. Groenen, and J. D. A. van Embden.1993. Comparison of various repetitive DNA elements as genetic markers for strain differentiation and epidemiology of Mycobac-terium tuberculosis. J. Clin. Microbiol.31:1987–1995.
36. Wall, S., K. Ghanekar, J. McFadden, and J. W. Dale.1999. Context-sensitive transposition of IS6110in mycobacteria. Microbiology145:3169–3176. 37. Warren, R., M. Richardson, S. Sampson, J. H. Hauman, N. Beyers, P. R.
Donald, and P. D. van Helden.1996. Genotyping ofMycobacterium tuber-culosiswith additional markers enhances accuracy in epidemiological stud-ies. J. Clin. Microbiol.34:2219–2224.
38. Wiid, I. J. F., C. Werely, N. Beyers, P. Donald, and P. D. van Helden.1994. Oligonucleotide (GTG)5as a marker for strain identification in Mycobacte-rium tuberculosis. J. Clin. Microbiol.32:1318–1321.
39.Yaganehdoost, A., E. A. Graviss, M. W. Ross, G. J. Adams, S. Ramaswamy, A. Wanger, R. Frothingham, H. Soini, and J. M. Musser.1999. Complex transmission dynamics of clonally related virulentMycobacterium tuberculosis
associated with barhopping by predominantly human immunodeficiency virus-positive gay men. J. Infect. Dis.180:1245–1251.
40.Yang, Z., P. F. Barnes, F. Chaves, K. D. Eisenach, S. E. Weis, J. H. Bates, and M. D. Cave.1998. Diversity of DNA fingerprints of Mycobacterium tuberculosisin the United States. J. Clin. Microbiol.36:1003–1007. 41.Yang, Z., F. Chaves, P. F. Barnes, W. J. Burman, J. Koehler, K. D. Eisenach,
J. H. Bates, and M. D. Cave.1996. Evaluation of a method for secondary DNA typing ofMycobacterium tuberculosiswith pTBN12 in the epidemio-logical study of tuberculosis. J. Clin. Microbiol.34:3044–3048.
42.Yeh, R. W., A. Ponce de Leon, C. B. Agasino, J. A. Hahn, C. L. Daley, P. C. Hopewell, and P. M. Small.1998. Stability ofMycobacterium tuberculosis
DNA genotypes. J. Infect. Dis.177:1107–1111.