Copyright © 2001, American Society for Microbiology. All Rights Reserved.
Comparison of Spectrophotometric and Visual Readings of
NCCLS Method and Evaluation of a Colorimetric Method
Based on Reduction of a Soluble Tetrazolium Salt, 2,3-Bis
{2-Methoxy-4-Nitro-5-[(Sulfenylamino)
Carbonyl]-2H-Tetrazolium-Hydroxide}, for Antifungal Susceptibility
Testing of
Aspergillus
Species
JOSEPH MELETIADIS,1JOHAN W. MOUTON,2JACQUES F. G. M. MEIS,2BIANCA A. BOUMAN,1
PETER J. DONNELLY,3PAUL E. VERWEIJ,1*ANDEUROFUNG NETWORK†
Departments of Medical Microbiology1and Hematology,3University Medical Center Nijmegen, and Department of
Medical Microbiology and Regional Public Health Laboratory, Canisius Wilhelmina Hospital,2Nijmegen,
The Netherlands
Received 20 February 2001/Returned for modification 11 April 2001/Accepted 12 September 2001
The susceptibilities of 25 clinical isolates of variousAspergillusspecies (Aspergillus fumigatus, A. flavus, A. terreus, A. ustus, andA. nidulans) to itraconazole (ITC) and amphotericin B (AMB) were determined using the standard proposed by NCCLS for antifungal susceptibility testing of filamentous fungi, a modification of this method using spectrophotometric readings, and a colorimetric method using the tetrazolium salt 2,3-bis {2-methoxy-4-nitro-5-[(sulfenylamino) carbonyl]-2H-tetrazolium-hydroxide} (XTT). Five MIC end points for ITC (MIC-0, no visible growth or<5% the growth control value [GC]; MIC-1, slight growth or 6 to 25% the
GC; MIC-2, prominent reduction in growth or 26 to 50% the GC; MIC-3, slight reduction in growth or 51 to 75% the GC; and MIC-4, no reduction in growth or 76 to 100% the GC) and one for AMB (MIC-0) were determined visually by four observers and spectrophotometrically. The intraexperimental (between the ob-servers) and interexperimental (between the experiments) levels of agreement of the NCCLS and XTT methods exceeded 95% for MIC-0 of AMB and MIC-0 and MIC-1 of ITC. The MIC-2 of ITC showed lower reproduc-ibility, although spectrophotometric reading and/or incubation for 48 h increased the interexperimental reproducibility from 85 to >93%. Between visual and spectrophotometric readings, high levels of agreement were found for AMB (⬇97%) and MIC-1 (⬇92%) and MIC-2 (⬇88%) of ITC. Poor agreement was found for MIC-0 of ITC (51% after 24 h), since the spectrophotometric readings resulted in higher MIC-0 values than the visual readings. The agreement was increased to 98% by shifting the threshold level of MIC-0 from 5 to 10% relative optical density and by establishing an optical density of greater than 0.1 for the GC as the validation criterion. No statistically significant differences were found between the NCCLS method and the XTT method, with the levels of agreement exceeding 97% for MIC-0 of AMB and 83% for MIC-0, MIC-1, and MIC-2 of ITC. The XTT method and spectrophotometric readings can increase the sensitivity and the precision, respectively, of in vitro susceptibility testing ofAspergillusspecies.
Opportunistic systemic mycoses caused by filamentous fungi occur more frequently now than before partly as a conse-quence of the larger numbers of individuals receiving more potent immunosuppressive therapy (1). The pathogens most frequently encountered belong to the genusAspergillus, with
Aspergillus fumigatusbeing responsible for over 90% of inva-sive infections in humans (10). Amphotericin B (AMB) and itraconazole (ITC) are the only licensed antifungal drugs
avail-able for treatment (4), although their efficacy is limited, per-haps partly because of drug resistance. Therefore, testing of the susceptibility of these pathogens may contribute to the management of patients. Such testing requires standardized and reproducible techniques (6, 7). Broth microdilution meth-ods have been adopted, since they are less expensive and cum-bersome than macrodilution methods and yield reproducible results (2, 5, 18). Fungal growth is assessed either visually by grading turbidity (16) or spectrophotometrically by measuring optical density (OD) (3, 12). Alternatively, biomass can be determined colorimetrically using indicator substances that are reduced to colored products by viable microorganisms. Thus, fungal biomass is estimated by the metabolic activity of the fungus (7, 9, 13).
The hyphae and nonhomogeneous growth of filamentous fungi, together with a trailing effect of fungistatic drugs, com-plicate the determination of MICs and do not allow for precise quantification of fungal growth (13). Visual assessment of fun-gal growth lacks objectivity and precision (13, 19), and the * Corresponding author. Mailing address: Department of Medical
Microbiology, University Medical Center Nijmegen, P.O. Box 9101, 6500 HB Nijmegen, The Netherlands. Phone: 31-24-3614356. Fax: 31-24-3540216. E-mail: p.verweij@mmb.azn.nl.
† The EUROFUNG Network consists of the following participants: Emmanuel Roilides and Nicos Maglaveras, Aristotle University, Thes-saloniki, Greece; Tore Abrahamsen and Peter Gaustad, Rikshospitalet National Hospital, Oslo, Norway; David W. Denning, University of Manchester, Manchester, United Kingdom; Juan L. Rodriguez-Tudela, Instituto de Salud Carlos III, Madrid, Spain; and George Petrikkos, Athens University, Athens, Greece.
4256
on May 15, 2020 by guest
http://jcm.asm.org/
accuracy of spectrophotometric readings may be hampered by clumps of mycelia (11, 15). Colorimetric methods may be an alternative, since precise quantification of hyphal growth is achieved and clear-cut end points can be generated (8). Tet-razolium salts have been used as colorimetric indicators, since fungi convert them to colored formazan derivatives, which can be quantified (18). The tetrazolium salt 3-(4,5-dimethyl-2-thia-zyl)-2,5-diphenyl-2H-tetrazolium bromide (MTT) has been used for antifungal susceptibility testing of yeasts and has re-cently been shown to be useful for determining MICs for filamentous fungi (13, 14). However, the usefulness of this assay is limited, since dissolution of the formazan derivative is achieved in organic solvents and relatively large numbers of fungi are required (11, 15).
2,3-Bis {2-methoxy-4-nitro-5-[(sulfenylamino) carbonyl]-2H-tetrazolium-hydroxide} (XTT) is a new yellow tetrazolium salt which is converted by mitochondrial dehydrogenases of viable fungi to an orange formazan product (8, 18, 24). Unlike MTT-derived formazan, the product of XTT conversion is a water-soluble formazan, which obviates the need for solubili-zation steps (15, 21, 22). The XTT assay has been used for testing of the susceptibility of yeasts to antifungal agents and has yielded a high level of agreement with the NCCLS method for variousCandidaspecies andCryptococcus neoformans(8). The same assay has been used to determine MICs for a small collection of filamentous fungi and has resulted in reproduc-ible and comparable results relative to those obtained with the NCCLS method (23). A recently developed XTT assay for
Aspergillus species resulted in well-defined dose-response curves for antifungal drugs (13a).
In this study, 25 clinical isolates of five Aspergillusspecies were tested three times against AMB and ITC using the method proposed by NCCLS (M38-P), and five MIC end points were determined visually by four observers. Given the problems encountered with the visual observation and spec-trophotometric assessment of the hyphal growth of filamentous fungi, the results of M38-P were compared with a modification of this method using spectrophotometric readings at 405 nm. Furthermore, in order to facilitate the determination of MICs for filamentous fungi, the activities of antifungal drugs were determined by a colorimetric method that uses the dye XTT as described previously (13a). The intraexperimental (between the observers) and interexperimental (between the experi-ments) agreements of the methods as well as the agreements between the NCCLS and colorimetric methods and between visual and spectrophotometric readings were calculated.
MATERIALS AND METHODS
Test isolates. Twenty-five clinical isolates ofAspergillusspecies (from our private collection) were selected for testing and included 5 isolates each of the following species:A. fumigatus(AZN5161, AZN5241, AZG7, AZN8248, and AZN8244),A. flavus(AZN137, AZN510, AZN2865, AZN4094, and AZN4132), A. nidulans(AZN2867, AZN8033, AZN8236, AZN8933, and AZN4606), A. terreus(AZN286, AZN515, AZN2868, AZN7320, and AZN9152), andA. ustus (AZN677, AZN2725, AZN6989, AZN9420, and AZN7843).Candida parapsilosis (ATCC 22019) andC. krusei(ATCC 6258) were used for quality control.
Isolates were cultured twice on Sabouraud glucose agar at 30°C for 5 to 7 days. All isolates were tested on three different days. Conidia of the isolates were obtained from fresh cultures each time.
Medium.RPMI 1640 medium (withL-glutamine but without bicarbonate) (GIBCO BRL, Life Technologies, Woerden, The Netherlands) buffered to pH
7.0 with 0.165 M 3-N-morpholinopropanesulfonic acid (MOPS) (Sigma-Aldrich Chemie GmbH, Steinheim, Germany) was used as the assay medium.
Inoculum.Conidia were collected with a cotton swab and suspended in sterile saline containing 0.05% Tween 20. After heavy particles were allowed to settle, the turbidity of the supernatants was measured spectrophotometrically (Spec-tronic 20D; Milton Roy, Rochester, N.Y.) at 530 nm, and the transmission was adjusted to 80 to 82% to yield an initial inoculum of 1⫻106to 5⫻106CFU/ml.
Each suspension was diluted 1:50 in medium to obtain twice the desired inocu-lum. The inoculum size was confirmed by plating of serial dilutions on Sabouraud glucose agar plates, with final inocula ranging from 1⫻104to 5⫻104CFU/ml.
Antifungal susceptibility testing.The broth microdilution method of the NC-CLS (M38-P) (16) was performed using 96-well flat-bottom microtitration trays. ITC (Janssen-Cilag, Beerse, Belgium) and AMB (Bristol-Myers Squibb, Woer-den, The Netherlands) were dissolved in dimethyl sulfoxide and diluted serially in medium to yield final concentrations of 0.015 to 16 mg of AMB/liter and 0.03 to 32 mg of ITC/liter in a final volume of 200l after the inoculation. A drug-free growth control that contained 0.5% dimethyl sulfoxide in medium was included. Trays were kept at⫺70°C until the day of testing.
Incubation and MIC determination.After the microtitration trays were de-frosted, they were inoculated with 100l of inoculum. The trays were agitated for 10 s and incubated at 37°C for 48 h. The MICs of the antifungal drugs were determined after 24 and 48 h of incubation by two methods (the NCCLS and XTT methods) and by two modes of reading (visual and spectrophotometric) as described below.
(i) NCCLS method. (a) Visual reading (NCCLSvis).Fungal growth was
as-sessed visually by four different observers with the aid of a concave mirror and graded according to NCCLS guidelines as follows: 4, no reduction in growth; 3, slight reduction in growth; 2, prominent reduction in growth; 1, slight growth; and 0, absence of visual growth compared with the growth in the drug-free well. Only score 0 was recorded for AMB. Four MIC end points (MIC-0, MIC-1, MIC-2, and MIC-3) were determined as the lowest drug concentrations showing growth scaled to the corresponding score (0, 1, 2, and 3, respectively). MIC-4 was determined as the highest drug concentration showing growth scaled to score 4.
(b) Spectrophotometric reading (NCCLSsp).After the MICs were determined
visually, the OD of each well was measured at 405 nm with a spectrophotometer (Rosys Anthos ht3; Anthos Labtec Instruments GmbH, Salzburg, Austria). After subtraction of the ODs of the blank, which consisted of noninoculated wells that had been incubated together with the inoculated wells, from the ODs of the inoculated wells, the percentage of growth for each well was correlated with the relative OD estimated by the following equation: (OD405of wells that contained
the drug/OD405of the drug-free well)⫻100. Relative ODs after rounding were
grouped in five levels: 4, 76 to 100% relative OD; 3, 51 to 75% relative OD; 2, 26 to 50% relative OD; 1, 6 to 25% relative OD; and 0, equal to or less than 5% relative OD. Five MIC end points were determined for ITC based on the levels of relative ODs. MIC-0, MIC-1, MIC-2, and MIC-3 were determined as the lowest drug concentrations with relative ODs of levels 0, 1, 2, and 3, respectively. MIC-4 was determined as the highest drug concentration with a relative OD of level 4. Only MIC-0 was determined for AMB.
Once these determinations were completed, the trays were returned to the incubator for another 24 h and read again visually and spectrophotometrically.
(ii) XTT method.The MICs were also determined colorimetrically using XTT (Sigma-Aldrich Chemie). Microtitration trays were prepared and incubated for 24 and 48 h at 37°C according to NCCLS guidelines as described above. Then, 50 l of saline containing 1 mg of XTT/ml and 20.2g of menadione (Sigma-Aldrich Chemie)/ml was added to each well in order to obtain final concentra-tions of 200g of XTT/ml and 4.3g of MEN/ml (25M). MEN was first dissolved in acetone at a concentration of 430.5g/ml and then diluted 1/10 in saline. Incubation was continued at 37°C for 2 h in the dark to allow conversion of XTT to its formazan derivative. The OD was measured at 450 nm, after shaking, with a microtitration tray spectrophotometer reader. The color was assessed first visually by the same four observers and graded according to NCCLS guidelines (XTTvis) and then spectrophotometerically based on relative
ODs at 450 nm and grouped in five levels as described above (XTTsp). Five MIC
end points were determined for ITC as described above. For AMB, only MIC-0 was determined.
Study design.A multifactorial panel of data was generated based on five parameters studied, i.e., modes of reading, MIC end points, drugs, species, and incubation periods, in order to test the reproducibility of and the agreement between the NCCLS and XTT methods. Data from five readings (four observers and spectrophotometer), five MIC end points, two drugs, five species, five strains, two incubation periods, and three independent experiments were obtained for both methods. Four comparisons were done in order to find the levels of absolute and relative agreements within the observers and the experiments (intra- and
on May 15, 2020 by guest
http://jcm.asm.org/
interexperimental agreements, respectively), between the visual and the spectro-photometric readings for each method, and between the NCCLS and the XTT methods.
Analysis of results.The levels of agreement within the four observers and the three experiments as well as between the two methods and between the two modes of reading were calculated for each species-drug-MIC end point-incuba-tion period combinapoint-incuba-tion. In order to approximate a normal distribupoint-incuba-tion for statistical analysis, the drug concentrations were transformed by logarithmic transformation to log2and the percentages of agreement were transformed by
angular transformation (with the transformed value being the arcsine of the square root of the percentage). After the transformation, MIC end points were analyzed by two-way analysis of variance (ANOVA), which was applied to each drug-MIC end point-incubation period combination.Pvalues of less than 0.05 were considered significant. Any systematic differences between the methods and the species were controlled by the interaction factor of two-way ANOVA. AP value of less than 0.05 indicated that the differences between the two methods are not the same for each species and therefore that the differences between the methods are species dependent. Discrepancies were analyzed by Fisher’s exact test. The transformed percentages of agreement were used in order to estimate variations between the experiments, the species, and the strains and to analyze differences in intra- and interexperimental agreements between all MIC end points after 24 and 48 h by repeated-measures ANOVA. The 95% confidence intervals (95% CI) of the percentages of agreement were calculated using the Wald equation for proportions (Prism software; GraphPad: Software, Inc., San Diego, Calif.). The high and low off-scale MICs were included in the analysis by conversion to the next higher and lower drug concentrations, respectively.
(i) Intraexperimental agreement.For the visual readings (NCCLSvisand
XTTvis), the percentage of absolute or relative agreement between the four
observers for each strain was defined as the proportion of the MIC end points which were identical or which belonged to the largest subset of four observations with a range of which not more than 3 dilutions, respectively. The levels of agreement between the four visual readings were calculated for each species and experiment, and the total percentage of agreement for all species and experi-ments was reported for each drug and MIC end point for the NCCLSvisand
XTTvismethods after 24 and 48 h of incubation.
(ii) Interexperimental agreement.For each method and mode of reading, the percentage of absolute and relative agreements between the three experiments was defined as the proportion of the MIC end points determined by the four observers or the spectrophotometer which were identical or within 1 dilution of the median, respectively. The levels of agreement between the three experiments were calculated for each species, and the total percentage of agreement for all
species was reported for each drug and MIC end point for the NCCLSvis,
NCCLSsp, XTTvis, and XTTspmethods after 24 and 48 h of incubation.
(iii) Agreement between visual and spectrophotometric readings.For each method, the percentage of agreement between the visual and spectrophotometric readings was calculated as the proportion of the MIC end points determined visually by the four observers which fell within 1 dilution of the corresponding MIC end points determined spectrophotometrically. The total percentage of agreement for the three experiments and all species between NCCLSvisand
NCCLSspas well as between XTTvisand XTTspwas reported for each drug and
MIC end point after 24 and 48 h of incubation, and the approximate 95% CI of percentages of agreement were calculated as described above.
(iv) Agreement between NCCLS and XTT methods. For each strain, the percentage of agreement between the NCCLS and XTT methods based on visual and spectrophotometric readings of each MIC end point was calculated as the proportion of the MIC end points determined by the NCCLS method, visually or spectrophotometrically, which fell within 1 dilution of the corresponding MIC end points of the XTT method, determined visually or spectrophotometrically, respectively. The total percentage of agreement between NCCLSvisand XTTvis
and between NCCLSspand XTTspfor the three experiments was reported for
each drug and MIC end point after 24 and 48 h of incubation, and the approx-imate 95% CI of percentages of agreement were calculated as described above.
RESULTS
MICs.TheAspergillusstrains tested in this study had various susceptibilities to AMB and ITC, with MICs ranging between 0.125 and 4 mg/liter for AMB and 0.015 to⬎32 mg/liter for ITC. Most of the MICs of ITC were less than 1 mg/liter, except for those for two strains ofA. fumigatus(Table 1). ForA. ustus
strains, despite the fact that the MIC-2 values were less than 1 mg/liter, the MIC-0 values were higher than 2 mg/liter and up to⬎32 mg/liter (data not shown). The geometric means of the MICs of AMB and for ITC obtained by all methods after 24 and 48 h of incubation were similar, as shown in Table 1. Differences were observed with A. fumigatus and ITC, for which the geometric mean of the MICs obtained by NCCLSvis
[image:3.587.46.541.94.336.2]after 24 h was slightly higher than the corresponding value TABLE 1. Susceptibilities of five strains of fiveAspergillusspp. to AMB and ITC based on MIC-0 and MIC-2, respectively, after 24 and 48 h
of incubation
Drug Time (h) Species Geometric mean (range) MIC, in mg/liter, determined by the following method: NCCLSvis NCCLSsp XTTvis XTTsp
AMB 24 A. fumigatus 0.68 (0.125–4) 0.63 (0.5–2) 0.63 (0.25–2) 0.63 (0.5–2)
A. flavus 1.19 (0.5–4) 1.20 (0.5–2) 1.11 (0.5–2) 1.15 (0.5–2)
A. nidulans 0.74 (0.25–4) 0.72 (0.25–2) 0.68 (0.25–2) 0.66 (0.25–1)
A. terreus 1.11 (0.5–4) 0.95 (0.5–4) 1.07 (0.5–2) 1.10 (0.5–2)
A. ustus 1.11 (0.5–2) 0.88 (0.5–2) 0.92 (0.5–4) 1.12 (0.5–2)
48 A. fumigatus 1.50 (1–4) 1.26 (1–4) 1.14 (0.5–4) 1.15 (0.5–4)
A. flavus 1.64 (1–4) 1.38 (1–2) 1.57 (1–4) 1.45 (1–2)
A. nidulans 1.10 (0.25–4) 0.87 (0.25–4) 0.97 (0.25–4) 0.95 (0.25–4)
A. terreus 2.89 (2–4) 2.09 (2–4) 2.64 (2–4) 2.52 (2–4)
A. ustus 1.91 (1–4) 1.36 (1–2) 1.53 (1–4) 1.47 (1–2)
ITC 24 A. fumigatus 2.39 (0.015–⬎32) 1.15 (0.125–⬎32) 1.36 (0.125–⬎32) 1.38 (0.125–⬎32)
A. flavus 0.14 (0.063–0.25) 0.10 (0.063–0.125) 0.14 (0.0125–0.5) 0.14 (0.063–0.25)
A. nidulans 0.13 (0.031–0.5) 0.13 (0.063–0.25) 0.13 (0.062–0.5) 0.10 (0.062–0.5)
A. terreus 0.09 (0.031–0.25) 0.09 (0.063–0.125) 0.12 (0.062–0.5) 0.11 (0.063–0.125)
A. ustus 0.40 (0.062–1) 0.35 (0.063–1) 0.54 (0.062–1) 0.46 (0.063–1)
48 A. fumigatus 2.89 (0.125–⬎32) 2.41 (0.125–⬎32) 2.96 (0.125–⬎32) 2.10 (0.063–⬎32)
A. flavus 0.19 (0.125–0.5) 0.12 (0.063–0.25) 0.26 (0.125–1) 0.24 (0.125–0.5)
A. nidulans 0.16 (0.062–0.25) 0.20 (0.063–2) 0.17 (0.031–0.5) 0.15 (0.031–0.5)
A. terreus 0.15 (0.062–0.5) 0.14 (0.063–0.25) 0.29 (0.062–0.5) 0.23 (0.125–0.5)
A. ustus 1.48 (0.125–⬎32) 0.89 (0.5–1) 3.21 (0.125–⬎32) 2.72 (0.25–⬎32)
on May 15, 2020 by guest
http://jcm.asm.org/
obtained by the other methods (2.4 and 1.4 mg/liter, respec-tively), and with A. ustusand ITC, for which the geometric means of the MICs obtained by NCCLSvisand NCCLSspafter
48 h were lower than the values obtained by the corresponding XTT methods (1.5 and 0.9 mg/liter for NCCLSvis and
NCCLSsp and 3.2 and 2.7 mg/liter for XTTvis and XTTsp,
respectively).
(i) Intraexperimental agreement. For AMB, the absolute agreement between the four observers was higher with the XTTvismethod (96%) than with the NCCLSvismethod (91%)
after 24 and 48 h (Table 2). The lowest level of agreement was found for A. ustus with the NCCLSvis method (75%); the
agreement was higher with the XTTvismethod (⬎88%). For
ITC, the absolute agreement was higher for MIC-0 and MIC-1 with both methods (⬎76%) than for the other MIC end points. Based on MIC-0 and MIC-1,A. ustus(67%) andA. fumigatus
(98%) showed the lowest and the highest levels of absolute agreement, respectively, among the tested species. The coeffi-cient of variation of intraexperimental absolute agreement was always less than 10% among the experiments as well as among the species for both the NCCLSvisand the XTTvismethods. No
statistically significant differences were found between the per-centages of agreement of the NCCLSvisand XTTvismethods
after 24 and 48 h of incubation.
(ii) Interexperimental agreement. For AMB, the absolute agreement between the experiments was slightly higher for the XTTvismethod than for the NCCLSvismethod and was lower
after 48 h of incubation than after 24 h for both methods (Table 2). When spectrophotometric readings were used, the interexperimental agreement for the XTTsp and NCCLSsp
methods was higher after 48 h of incubation than after 24 h. For ITC, the reproducibility of the NCCLSvis and XTTvis
methods was high (⬎70%) with MIC-0 and MIC-1 and was always higher after 48 h. For these MIC end points, the lowest and highest levels of absolute agreement among the different species were found with A. ustus (64%) and A. fumigatus
(93%), respectively. For the NCCLSspand XTTspmethods, the
highest reproducibility was found for MIC-1 (71–85%) with both methods after 24 and 48 h, with the exception of the XTTspmethod after 48 h, for which the MIC-0 showed the
highest reproducibility (87%). The reproducibility of MIC-0 with the NCCLSspmethod was very low after 24 h (55%) but
improved after 48 h (75%) and with the XTTspmethod (87%).
The coefficient of variation of interexperimental absolute agreement among the species was always less than 13% for visual readings, with an average coefficient of variation of 10%; for the spectrophotometric readings, the coefficient of varia-tion was always less than 19%, with an average coefficient of variation of 13% for both methods. Unlike that of the spec-trophotometric readings, the relative agreement of the visual readings increased statistically significantly after 48 h for both methods (P⬍0.05).
(iii) Agreement between visual and spectrophotometric read-ings.For AMB, the relative agreements between the NCCLSvis
and NCCLSsp methods as well as between the XTTvis and
XTTspmethods were high after 24 and 48 h (⬎96 and⬎99%,
respectively) (Table 3). For ITC, the levels of agreement be-tween the XTTvisand XTTspmethods for MIC-0, MIC-1, and
MIC-2 ranged from 83 to 95% after 24 and 48 h of incubation. Between the NCCLSvis and NCCLSsp methods, the
agree-TABLE 2. Overall absolute and relative (within 0 and 1 dilutions, respectively) agreements within the four observers and the three experiments for all testedAspergillusisolates
Agreement Groupa Drug Growth levelb
Overall absolute (relative) % agreement for the indicated method after the following h of incubation:
24 48
NCCLS XTT NCCLS XTT
Intraexperimental 1 ITC 0 82.9 (99.1) 90.3 (97.7) 89.7 (99.4) 92.5 (99.5)
1 83.2 (98.6) 77.6 (99.1) 76.1 (99.5) 82.0 (98.8) 2 69.0 (88.8) 66.9 (87.6) 69.8 (95.3) 72.0 (94.9) 3 62.4 (80.2) 59.1 (73.6) 65.5 (78.2) 65.0 (86.7) 4 60.8 (71.7) 63.2 (71.8) 64.1 (77.0) 63.5 (70.3)
AMB 0 91.0 (99.8) 96.1 (99.9) 90.6 (100) 95.8 (100)
Interexperimental 2 ITC 0 78.3 (97.6) 75.3 (95.6) 83.7 (99.4) 85.6 (99.3)
1 69.6 (95.5) 74.5 (96.6) 78.3 (98.9) 77.0 (98.6) 2 65.8 (85.7) 64.6 (85.3) 71.5 (94.3) 68.8 (93.3) 3 62.8 (82.2) 57.7 (75.9) 67.7 (82.5) 69.1 (87.8) 4 61.9 (73.8) 58.5 (68.4) 66.0 (79.3) 66.8 (77.2)
AMB 0 81.7 (99.0) 87.9 (99.7) 78.1 (99.7) 83.1 (99.7)
3 ITC 0 54.7 (76.2) 64.4 (90.9) 75.4 (91.6) 87.3 (99.4)
1 71.2 (99.7) 74.8 (95.7) 84.7 (97.6) 81.0 (97.2) 2 65.6 (96.2) 63.4 (93.1) 72.3 (99.7) 67.0 (89.6) 3 58.8 (71.4) 56.0 (80.2) 62.9 (89.6) 49.3 (88.9) 4 61.7 (64.3) 61.7 (67.0) 59.5 (64.8) 56.1 (78.2)
AMB 0 78.9 (99.7) 88.2 (100) 92.4 (100) 89.6 (100)
aGroups 1 and 2, NCCLS
visand XTTvis, 95% CI limits of absolute agreement ranged from⫾3.6 to⫾5.6%; group 3, NCCLSspand XTTsp, 95% CI limits of absolute
agreement ranged from⫾2.6 to⫾11.3%.
bGrowth levels: 0, no visible growth (ⱕ5% that of growth control); 1 slight growth (6 to 25% that of growth control); 2, prominent reduction of growth (26 to 50%
that of growth control); 3, slight reduction of growth (51 to 75% that of growth control); 4, no reduction of growth (76 to 100% of growth control).
on May 15, 2020 by guest
http://jcm.asm.org/
[image:4.587.42.541.93.340.2]ments were higher for MIC-1 and MIC-2 after 24 h (93 and 88%, respectively) and 48 h (92 and 87%, respectively). Very low agreement was found for MIC-0 after 24 h (51%;P ⬍
0.01), but it increased after 48 h (82%). Statistically significant differences were found for MIC-3 (P⬍0.01) and MIC-4 (P⬍
0.05) of ITC after 24 h with the NCCLS methods and for MIC-3 after 24 h (P⬍0.05) and MIC-4 after 48 h (P⬍0.01) of ITC with the XTT methods. No statistically significant sys-tematic differences between the two methods and the species for both drugs after 24 and 48 h of incubation for all MIC end points were found (P⬎0.15). For MIC-0 of ITC after 24 h of incubation, in 42 (56%) out of 75 comparisons (three experi-ments, five species, and five strains), the MIC-0 values of the NCCLSsp method were higher than those of the NCCLSvis
method, and only six comparisons (8%) were the opposite. Furthermore, out of 35 comparisons in which differences of higher than 1 dilution were observed, the MIC-0 values of the spectrophotometric method were higher than those of the NCCLS method in 33 and vice versa in 2.
In order to study further the low levels of agreement be-tween the NCCLSvisand NCCLSspmethods for MIC-0 of ITC
after 24 h, the relative ODs of the NCCLSspmethod which
corresponded to the MIC-0 values of the NCCLSvis method
were associated with the ODs of their growth controls for all 75 comparisons in a cross-sectional study. Various contingency tables were constructed based on different cutoff values for relative ODs of MIC-0 (5 and 10%) and ODs of the growth control as validation criteria (0, 0.05, and 0.1). The strongest association was found when a relative OD of 10% as a cutoff for MIC-0 was combined with an OD of 0.1 for the growth control as a validation criterion (P⬍0.0005). The Spearman correlation coefficient between these two parameters was
⫺0.35 (P⫽0.029). Using the 10% relative OD as a cutoff for MIC-0 instead of 5% and an OD of 0.1 for the growth control as an evaluation criterion, the discrepancy between the NCCLSvis
and NCCLSsp methods was reduced 10 times (from 28 to
2.7%) and the levels of agreement reached 98%. However, 27% of MIC-0 values of the NCCLSspmethod will be in
agree-ment with those of the NCCLSvismethod, although the ODs of
their growth controls could be less than 0.1. The levels of agreement between the XTTvisand XTTspmethods, especially
for MIC-0, were higher after 24 and 48 h (91 and 95, respec-tively).
(iv) Agreement between NCCLS and XTT methods. For AMB, the levels of agreement between the NCCLSvis and
XTTvismethods as well as between the NCCLSspand XTTsp
methods were higher than 97% (Table 3). For ITC, the agree-ment between the NCCLSvisand XTTvismethods was higher
than 83% for MIC-0, MIC-1, and MIC-2, with MIC-1 showing the highest agreement after 24 h (93%) and MIC-0 doing so after 48 h (94%). Among the species, A. ustus showed the lowest level of agreement (82%). The levels of agreement between the NCCLSsp and XTTspmethods were lower with
MIC-1 after 24 h and higher with MIC-0 after 48 h (95 and 84%, respectively). Statistically significant differences were found for MIC-3 of ITC after 24 h between the NCCLSvisand
XTTvismethods as well as between the NCCLSspand XTTsp
methods (P⬍0.05). The statistically significant differences for MIC-0 of ITC after 24 h between the NCCLSsp and XTTsp
methods (P⬍ 0.05) were due to the erroneous higher MICs obtained by the NCCLSsp method. The discrepancies were
reduced when the above-mentioned validation criteria were applied for the determination of MIC-0 by the NCCLSsp
method. No statistically significant systematic differences be-tween the two methods and the species were obtained for both drugs after 24 and 48 h of incubation for all MIC end points (P⬎0.25).
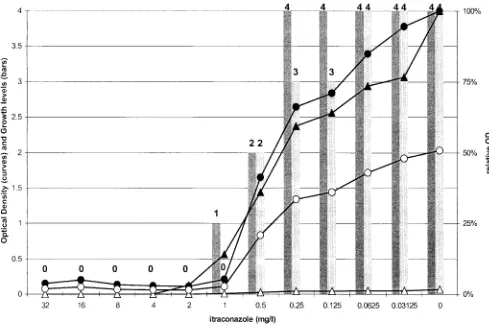
A representative graph is shown in Fig. 1, with the results of NCCLSvis, NCCLSsp, XTTvis, and XTTspfor anA. ustusstrain
and ITC. Growth at an OD at 405 nm of 0.047 with the NCCLSspmethod corresponded to formazan production of 2.0
[image:5.587.44.543.94.261.2]OD units at 450 nm with the XTTspmethod.
TABLE 3. Overall relative (within 1 dilution) agreements and 95% CI limits between the visual and spectrophotometric readings and between the NCCLS and XTT methods
Time (h) Drug Growth levela
% Agreement⫾95% CI for the following comparisons:
Visual vs spectrophotometric readings NCCLS vs XTT methods
NCCLSvisvs NCCLSspb XTTvisvs XTTspb NCCLSvisvs XTTvisb NCCLSspvs XTTspc
24 ITC 0 51.4⫾5.7d 90.8⫾3.3 88.0⫾3.7 60.0⫾11.1e
1 92.8⫾3.0 91.1⫾3.3 92.7⫾3.0 94.7⫾5.1
2 87.7⫾3.8 86.0⫾4.0 86.8⫾3.9 82.7⫾8.6
3 67.8⫾5.4e 75.4⫾4.9e 79.8⫾4.6e 73.3⫾10.0e
4 68.1⫾22.6d 67.9⫾5.3 68.3⫾5.4 73.3⫾10.0
AMB 0 96.7⫾2.0 99.3⫾0.9 96.7⫾2.0 98.7⫾2.5
48 ITC 0 81.5⫾4.4 95.3⫾2.4 94.0⫾2.7 84.0⫾8.3
1 91.6⫾3.1 90.9⫾3.3 85.1⫾4.1 77.3⫾9.5
2 87.2⫾3.8 83.2⫾4.2 82.8⫾4.3 73.3⫾10.0
3 72.5⫾5.1 69.5⫾5.2 78.0⫾4.7 54.7⫾11.3
4 58.1⫾5.6 67.5⫾5.5d 69.6⫾5.2 48.0⫾11.3
AMB 0 98.7⫾1.3 100.0⫾0.0 97.0⫾1.9 98.7⫾2.6
aSee Table 2, footnoteb. bA total of 300 comparisons. cA total of 75 comparisons.
dThePvalue (obtained by a two-way ANOVA of log
2MIC end points derived by the two methods) was⬍0.01. eThePvalue was⬍0.05.
on May 15, 2020 by guest
http://jcm.asm.org/
DISCUSSION
The selection of an endpoint for MIC determination of antifungal drugs is an important factor of antifungal suscepti-bility testing of filamentous fungi which may increase the vari-ability of these tests (5). This parameter is crucial especially for fungistatic drugs like ITC since partial inhibition of the growth due to the delayed action of the drug (trailing phenomenon) may result in limited growth over a range of drug concentra-tions which may elevate the MIC-0. Therefore, MIC-2 (prom-inent reduction of growth) was chosen for this drug (20). How-ever, in previous studies MIC-1 (slight growth or 75% reduction of growth) showed higher interlaboratory agreement and similar interexperimental agreement relative to MIC-2 (6, 12). In the present study, high levels of intra- and interexperi-mental agreement were found for MIC-0 and MIC-1 (⬎95%) as was found in our previous study (13). For MIC-2, the levels of intra- and interexperimental agreement were lower after 24 h (89 and 86%, respectively) although they increased after 48 h of incubation (95 and 94%, respectively). The interexperi-mental agreement for MIC-2 was improved when the spectro-photometric reading was used (96% after 24 h and 99% after 48 h). Similar results were obtained when XTT was used.
For fungicidal drugs such as AMB, growth ceases abruptly after exposure to the drug which results in clear-cut end points (20). Therefore, the MIC-0 was chosen as the end point. In this study, in agreement with previous studies, high levels of inter-and intraexperimental agreement (⬎98%) were found after 24 and 48 h of incubation. Using the dye XTT, the absolute inter-and intraagreements of visual determination were further in-creased.
[image:6.587.47.536.76.403.2]It is assumed that spectrophotometric estimation of the growth of filamentous fungi is inaccurate because of nonho-mogeneity (4, 5). However, in previous studies, high levels of agreement were found between visual and spectrophotometric readings at 405 and 570 nm for MIC-1 and MIC-2 for ITC and MIC-0 for AMB (3, 12). The same results were obtained in this study, since the levels of agreement for MIC-1 and MIC-2 were 92 and 87%, respectively, for ITC and 97% for AMB with MIC-0. However, the levels of agreement between visual and spectrophotometric readings at 405 nm for MIC-0 of ITC were very low, especially after 24 h (51%;P⬍0.01). In most cases, the MIC-0 values based on spectrophotometric readings were higher than those of visual readings. Further analysis of the discrepancies showed that this disagreement depended on the FIG. 1. Results of susceptibility testing of anA. ustusstrain against ITC in the NCCLS and XTT methods, with data determined visually and spectophotometrically, after 24 h of incubation. The bars represent the growth levels obtained in the NCCLSvis(dark bars) and XTTvis(light bars)
methods for each concentration on a scale of 0 (absence of growth or color) to 4 (no reduction of growth or color compared with the data for the drug-free control). The curves with the circles represent the OD at 450 nm (open symbols) and the relative OD (percentage) (closed symbols) obtained by the XTTspmethod. The curves with the triangles represent the OD at 405 nm (open symbols) and the relative OD (percentage) (closed
symbols) obtained by the NCCLSspmethod.
on May 15, 2020 by guest
http://jcm.asm.org/
cutoff of relative OD as well as the OD of the growth control (P⬍0.0005). In a previous study, an OD of 0.15 for the growth control was chosen as validation criterion for spectrophoto-metric readings of susceptibility testing ofAspergillusspecies although no evidence for the choice of threshold level was provided (17). Using a threshold level of 10% relative OD for MIC-0 and as a validation criterion an OD of the growth control of greater than 0.1, the discrepancies were reduced 10-fold and the agreement between visual and spectrophoto-metric readings was increased to 98%.
Spectrophotometric readings are in general more precise and reproducible than visual reading. Since the hyphal growth ofAspergillus species does not seem to present an obstacle, spectrophotometry can be used to determine the susceptibility of these fungi to antifungal drugs resulting in more precise quantification of hyphal growth than is attained by a visual reading. However, further optimization is required. The pres-ence of phenol red in RPMI 1640 medium may pose problems as it might lower the sensitivity of spectrophotometric read-ings. The absorbance of this medium is very high at 405 nm (OD, 0.15 to 0.2), a wavelength at which hyphae have the highest absorbance. At lower wavelengths, the background ab-sorbance is decreased (OD at 630 nm, 0.06), but the absor-bance of hyphae is also decreased (unpublished observations). Thus, due to high background absorbance, limited fungal growth is not detectable by spectrophotometer. Studies using RPMI 1640 medium without phenol red for in vitro suscepti-bility testing show identical results compared with the standard medium (23). Since phenol red was originally used to allow contamination of the medium to be detected, in antifungal susceptibility testing it serves no useful purpose; therefore, phenol red should be omitted.
Although spectrophotometric reading resulted in higher ac-curacy and reproducibility, lack in sensitivity was observed since growth higher than 0.1 OD is required for precise hyphal quantification. The sensitivity of spectrophotometric readings was increased with the colorimetric method, since ODs of up to 2.0 were achieved compared with 0.047 using the noncolo-rimetric method. In a previous study, a colononcolo-rimetric method based on the dye XTT was applied for antifungal susceptibility testing of various yeasts against different azoles and flucy-tosine, resulting in high levels of agreement with the standard NCCLS method (8). XTT was applied for the first time for filamentous fungi by Sugar and Liu (23), who found lower MICs compared with the NCCLS method. These discrepancies between the two methods may be due to the different MIC end points that were chosen, namely, the MIC-0 defined as the first well showing no growth for the NCCLS method and a decrease in OD of greater than 50% for the XTT method (23). Varia-tion in the colorimetric method may be caused by the absence of a step that stops the conversion, since extraction steps are not necessary. Since high levels of agreements were found between the spectrophotometric and the visual readings of the XTT method, the colorimetric method can be automated by using spectrophotometric readings. However, wells containing hyphae may interfere with OD measurements, since at 450 nm, where the formazan derivative is absorbed, hyphae also show high absorbance. These problems could be overcome by re-moving the formazan derivative from the wells where the fungi
are growing, although it will increase the time required to generate results.
Strains for which MICs of antifungal agents are high were detectable with the colorimetric method, in some cases 24 h earlier than it was possible with visual reading. Furthermore, it was possible to distinguish between metabolically active hy-phae and dead hyhy-phae, which would both produce turbidity, which would be seen as growth when examined visually, pos-sibly resulting in a trailing effect. Besides helping to alleviate this problem, the colorimetric method should allow detection of small amounts of growth, more precise quantification, and earlier MIC determination than is possible with the noncolo-rimetric method.
In conclusion, for AMB high levels of agreement were al-ways obtained. For ITC with both the NCCLS and the XTT methods, MIC-0 and MIC-1 showed the highest levels of intra-and interexperimental agreement. For MIC-2, similar levels of agreement were achieved either by prolonging the incubation period to 48 h or by using spectrophotometric reading after 24h. The spectrophotometric readings can be used for antifun-gal susceptibility testing ofAspergillusspecies, since high levels of agreement with the visual readings were achieved for MIC-0, MIC-1, and MIC-2. The low agreement was found between the visual readings and the spectrophotometric read-ings of the NCCLS method for MIC-0 of ICZ was improved by shifting the threshold level to 10% relative OD and establish-ing an OD of 0.1 for the growth control as a validation criterion for the spectrophotometric readings. The XTT method based on both visual and spectrophotometric readings used in this study showed high levels of agreement with the NCCLS method, and higher levels of sensitivity and precision were achieved. Therefore, the colorimetric method could be used as an alternative method for antifungal susceptibility testing of
Aspergillusspecies, although further work is required to study the robustness of this colorimetric method.
ACKNOWLEDGMENTS
This work was supported by the European Commission Training and Mobility of Researchers grant FMRX-CT970145 to Joseph Meletiadis and by the Mycology Research Center of Nijmegen.
REFERENCES
1.Anaissie, E.1992. Opportunistic mycoses in the immunocompromised host: experience at a cancer center and review. Clin. Infect. Dis.14(Suppl. 1):S43– S53.
2.Cormican, M. G., and M. A. Pfaller.1996. Standardization of antifungal susceptibility testing. J. Antimicrob. Chemother.38:561–578.
3.Dannaoui, E., F. Persat, M. F. Monier, E. Borel, M. A. Piens, and S. Picot.
1999. Use of spectrophotometric reading for in vitro antifungal susceptibility testing ofAspergillusspp. Can. J. Microbiol.45:871–874.
4.Denning, D. W., S. A. Radford, K. L. Oakley, L. Hall, E. M. Johnson, and D. W. Warnock.1997. Correlation between in vitro susceptibility testing to itraconazole and in vivo outcome ofAspergillus fumigatusinfection. J. Anti-microb. Chemother.40:401–441.
5.Espinel-Ingroff, A., F. Barchiesi, K. C. Hazen, J. V. Martinez-Suarez, and G. Scalise.1998. Standardization of antifungal susceptibility testing and clinical relevance. Med. Mycol.36(Suppl. 1):68–78.
6.Espinel-Ingroff, A., M. Bartlett, R. Bowden, N. X. Chin, C. Cooper, Jr., A. Fothergill, M. R. McGinnis, P. Menezes, S. A. Messer, P. W. Nelson, F. C. Odds, L. Pasarell, J. Peter, M. A. Pfaller, J. H. Rex, M. G. Rinaldi, G. S. Shankland, T. J. Walsh, and I. Weitzman.1997. Multicenter evaluation of proposed standardized procedure for antifungal susceptibility testing of fil-amentous fungi. J. Clin. Microbiol.35:139–143.
7.Espinel-Ingroff, A., K. Dawson, M. Pfaller, E. Anaissie, B. Breslin, D. Dixon, A. Fothergill, V. Paetznick, J. Peter, M. G. Rinaldi, and T. J. Walsh.1995. Comparative and collaborative evaluation of standardization of antifungal susceptibility testing for filamentous fungi. Antimicrob. Agents Chemother.
39:314–319.
on May 15, 2020 by guest
http://jcm.asm.org/
8.Hawser, S. P., H. Norris, C. J. Jessup, and M. A. Ghannoum.1998. Com-parison of a 2,3-bis(2-methoxy-4-nitro-5-sulfophenyl)-5-[(phenylamino)car-bonyl]-2H-tetrazolium hydroxide (XTT) colorimetric method with the stan-dardized National Committee for Clinical Laboratory Standards method of testing clinical yeast isolates for susceptibility to antifungal agents. J. Clin. Microbiol.36:1450–1452.
9.Jahn, B., E. Martin, A. Stueben, and S. Bhakdi.1995. Susceptibility testing ofCandida albicansandAspergillusspecies by a simple microtiter menadi-one-augmented 3-(4,5-dimethyl-2-thiazolyl)-2,5-diphenyl-2H-tetrazolium bromide assay. J. Clin. Microbiol.33:661–667.
10.Latge, J. P.1999.Aspergillus fumigatusand aspergillosis. Clin. Microbiol. Rev.12:310–350.
11.Levitz, S. M., and R. D. Diamond.1985. A rapid colorimetric assay of fungal viability with the tetrazolium salt MTT. J. Infect. Dis.152:938–945. 12.Llop, C., I. Pujol, C. Aguilar, J. Sala, D. Riba, and J. Guarro.2000.
Com-parison of three methods of determining MICs for filamentous fungi using different end-point criteria and incubation periods. Antimicrob. Agents Che-mother.44:239–242.
13.Meletiadis, J., J. F. G. M. Meis, J. W. Mouton, J. P. Donnelly, and P. E. Verweij. 2000. Comparison of NCCLS and 3-(4,5-dimethyl-2-thiazyl)-2,5-diphenyl-2H-tetrazolium bromide (MTT) methods of in vitro susceptibility testing of filamentous fungi and development of a new simplified method. J. Clin. Microbiol.38:2949–2954.
13a.Melatiadis, J., J. W. Mouton, J. F. G. M. Meis, B. A. Bouman, J. P. Donnelly, P. E. Verweij, and Eurofung Network.2001. Colorimetric assay for antifungal susceptibility testing ofAspergillusspecies. J. Clin. Microbiol.39:3402–3408. 14.Meletiadis, J., J. W. Mouton, J. L. Rodriguez-Tudela, J. F. G. M. Meis, and P. E. Verweij. 2000. In vitro interaction of terbinafine with itraconazole against clinical isolates ofScedosporium prolificans. Antimicrob. Agents Che-mother.44:470–472.
15.Meshulam, T., S. M. Levitz, L. Christin, and R. D. Diamond. 1995. A simplified new assay for assessment of fungal cell damage with the
tetrazo-lium dye, (2,3)-bis-(2-methoxy-4-nitro-5-sulphenyl)-(2H)-tetrazotetrazo-lium-5-car- (2,3)-bis-(2-methoxy-4-nitro-5-sulphenyl)-(2H)-tetrazolium-5-car-boxanilide (XTT). J. Infect. Dis.172:1153–1156.
16.National Committee for Clinical Laboratory Standards.1998. Reference method for broth dilution antifungal susceptibility testing of conidium form-ing filamentous fungi. Proposed standard M38-P. National Committee for Clinical Laboratory Standards, Wayne, Pa.
17.Odds, F. C., and H. Van den Bossche.2000. Antifungal activity of itracon-azole compared with hydroxy-itraconitracon-azole in vitro. J. Antimicrob. Che-mother.45:371–373.
18.Paull, D. K., H. Shoemaker, and M. R. Boyd.1998. The synthesis of XTT: a new tetrazolium reagent that is bioreducible to a water-soluble formazan. J. Heterocycl. Chem.25:911–914.
19.Pfaller, M. A., and M. G. Rinaldi.1993. Antifungal susceptibility testing. Current state of technology, limitations, and standardization. Infect. Dis. Clin. North Am.7:435–444.
20.Rex, J. H., M. A. Pfaller, M. G. Rinaldi, A. Polak, and J. N. Galgiani.1993. Antifungal susceptibility testing. Clin. Microbiol. Rev.6:367–381. 21.Roehm, N. W., G. H. Rodgers, S. M. Hatfield, and A. L. Glasebrook.1991.
An improved colorimetric assay for cell proliferation and viability utilizing the tetrazolium salt XTT. J. Immunol. Methods142:257–265.
22.Seudiero, D. A., R. H. Shoemaker, K. D. Paull, A. Monks, S. Tierney, T. H. Nofziger, M. J. Currens, D. Seniff, and M. R. Boyd.1988. Evaluation of a soluble tetrazolium/formazan assay for cell growth and drug sensitivity in culture using human and other tumor cell lines. Cancer Res.48:4827–4833. 23.Sugar, A. M., and X. Liu.1995. Comparison of three methods of antifungal susceptibility testing with the proposed NCCLS standard broth macrodilu-tion assay: lack of effect of phenol red. Diagn. Microbiol. Infect. Dis.21:
129–133.
24.Tellier, R., M. Krajden, G. A. Grigoriew, and I. Campbell.1992. Innovative end-point determination system for antifungal susceptibility testing of yeasts. Antimicrob. Agents Chemother.36:1619–1625.