www.impactjournals.com/oncotarget/ Oncotarget, 2016, Vol. 7, (No. 49), pp: 80140-80163
Association of breast cancer risk with genetic variants showing
differential allelic expression: Identification of a novel breast
cancer susceptibility locus at 4q21
Yosr Hamdi1,*, Penny Soucy1,*, Véronique Adoue2,3,4, Kyriaki Michailidou5,6, Sander Canisius7, Audrey Lemaçon8, Arnaud Droit8, Irene L Andrulis9,10, Hoda Anton-Culver11, Volker Arndt12, Caroline Baynes13, Carl Blomqvist14, Natalia V. Bogdanova15,16, Stig E. Bojesen17,18,19, Manjeet K. Bolla5, Bernardo Bonanni20, Anne-Lise Borresen-Dale21, Judith S. Brand22, Hiltrud Brauch23,24,25, Hermann Brenner12,25,26, Annegien Broeks7, Barbara Burwinkel27,28, Jenny Chang-Claude29,30, NBCS Collaborators21,31,32,33,34,35,36,37,38,39,40,41, Fergus J. Couch42, Angela Cox43, Simon S. Cross44, Kamila Czene22, Hatef Darabi22, Joe Dennis5, Peter Devilee45,46, Thilo Dörk16, Isabel Dos-Santos-Silva47, Mikael Eriksson22, Peter A. Fasching48,49, Jonine Figueroa50,51, Henrik Flyger52, Montserrat García-Closas51, Graham G. Giles53,54, Mark S. Goldberg55,56, Anna González-Neira57, Grethe Grenaker-Alnæs21, Pascal Guénel58, Lothar Haeberle48, Christopher A. Haiman59, Ute Hamann60, Emily Hallberg61, Maartje J. Hooning62, John L. Hopper54, Anna Jakubowska63, Michael Jones64, Maria Kabisch60, Vesa Kataja65,66, Diether Lambrechts67,68, Loic Le Marchand69, Annika Lindblom70, Jan Lubinski63, Arto Mannermaa65,71,72, Mel Maranian13, Sara Margolin73, Frederik Marme27,74, Roger L. Milne53,54, Susan L. Neuhausen75, Heli Nevanlinna76, Patrick Neven77, Curtis Olswold61, Julian Peto47, Dijana Plaseska-Karanfilska78, Katri Pylkäs79,80, Paolo Radice81, Anja Rudolph29, Elinor J. Sawyer82, Marjanka K. Schmidt7, Xiao-Ou Shu83, Melissa C. Southey84, Anthony Swerdlow85, Rob A.E.M. Tollenaar86, Ian Tomlinson87, Diana Torres60,88, Thérèse Truong58, Celine Vachon61, Ans M. W. Van Den Ouweland989, Qin Wang5, Robert Winqvist79,80, kConFab/AOCS Investigators90, Wei Zheng83, Javier Benitez57,91, Georgia Chenevix-Trench92, Alison M. Dunning13, Paul D. P. Pharoah5,13, Vessela Kristensen21,93, Per Hall22, Douglas F. Easton5,13, Tomi Pastinen94,95, Silje Nord21 and Jacques Simard1
1 Genomics Center, Centre Hospitalier Universitaire de Québec Research Center, Laval University, Quebec, Canada 2 Institut National de la Santé et de la Recherche Médicale U1043, Toulouse, France
3 Centre National de la Recherche Scientifique, Toulouse, France
4 Université de Toulouse, Université Paul Sabatier, Centre de Physiopathologie de Toulouse Purpan, Toulouse, France
5 Centre for Cancer Genetic Epidemiology, Department of Public Health and Primary Care, University of Cambridge,
Cambridge, UK
6 Department of Electron Microscopy/Molecular Pathology, The Cyprus Institute of Neurology and Genetics, Nicosia, Cyprus 7 Netherlands Cancer Institute, Antoni van Leeuwenhoek hospital, Amsterdam, The Netherlands
8 Centre de Recherche du CHU de Québec – Université Laval, Faculté de Médecine, Département de Médecine Moléculaire,
Université Laval, Quebec, Canada
9 Lunenfeld-Tanenbaum Research Institute of Mount Sinai Hospital, Toronto, Canada 10 Department of Molecular Genetics, University of Toronto, Toronto, Canada 11 Department of Epidemiology, University of California Irvine, Irvine, CA, USA
12 Division of Clinical Epidemiology and Aging Research, German Cancer Research Center, Heidelberg, Germany 13 Centre for Cancer Genetic Epidemiology, Department of Oncology, University of Cambridge, Cambridge, UK 14 Department of Oncology, Helsinki University Hospital, University of Helsinki, Helsinki, Finland
15 Department of Radiation Oncology, Hannover Medical School, Hannover, Germany 16 Gynaecology Research Unit, Hannover Medical School, Hannover, Germany
17 Copenhagen General Population Study, Herlevand Gentofte Hospital, Copenhagen University Hospital, Herlev, Denmark
18 Department of Clinical Biochemistry, Herlev and Gentofte Hospital, Copenhagen University Hospital, Herlev, Denmark 19 Faculty of Health and Medical Sciences, University of Copenhagen, Copenhagen, Denmark
20 Division of Cancer Prevention and Genetics, Istituto Europeo di Oncologia, Milan, Italy
21 Department of Cancer Genetics, Institute for Cancer Research, Oslo University Hospital Radiumhospitalet, Oslo, Norway 22 Department of Medical Epidemiology and Biostatistics, Karolinska Institutet, Stockholm, Sweden
23 Dr. Margarete Fischer-Bosch-Institute of Clinical Pharmacology, Stuttgart, Germany 24 University of Tübingen, Tübingen, Germany
25 German Cancer Consortium, German Cancer Research Center, Heidelberg, Germany
26 Division of Preventive Oncology, German Cancer Research Center and National Center for Tumor Diseases, Heidelberg,
Germany
27 Department of Obstetrics and Gynecology, University of Heidelberg, Heidelberg, Germany 28 Molecular Epidemiology Group, German Cancer Research Center, Heidelberg, Germany 29 Division of Cancer Epidemiology, German Cancer Research Center, Heidelberg, Germany
30 University Cancer Center Hamburg, University Medical Center Hamburg-Eppendorf, Hamburg, Germany 31 Department of Oncology, Haukeland University Hospital, Bergen, Norway
32 Section of Oncology, Institute of Medicine, University of Bergen, Bergen, Norway 33 Department of Pathology, Akershus University Hospital, Lørenskog, Norway
34 Department of Breast-Endocrine Surgery, Akershus University Hospital, Lørenskog, Norway 35 Department of Breast and Endocrine Surgery, Oslo University Hospital, Ullevål, Oslo, Norway 36 Department of Research, Vestre Viken, Drammen, Norway
37 Institute of Clinical Medicine, Faculty of Medicine, University of Oslo, Oslo, Norway
38 National Advisory Unit on Late Effects after Cancer Treatment, Oslo University Hospital Radiumhospitalet, Oslo, Norway 39 Department of Oncology, Oslo University Hospital Radiumhospitalet, Oslo, Norway
40 Department of Radiology and Nuclear Medicine, Oslo University Hospital Radiumhospitalet, Oslo, Norway 41 Oslo University Hospital, Oslo, Norway
42 Department of Laboratory Medicine and Pathology, Mayo Clinic, Rochester, MN, USA
43 Sheffield Cancer Research, Department of Oncology and Metabolism, University of Sheffield, Sheffield, UK 44 Academic Unit of Pathology, Department of Neuroscience, University of Sheffield, Sheffield, UK
45 Department of Pathology, Leiden University Medical Center, Leiden, The Netherlands 46 Department of Human Genetics, Leiden University Medical Center, Leiden, The Netherlands
47 Department of Non-Communicable Disease Epidemiology, London School of Hygiene and Tropical Medicine, London, UK 48 Department of Gynaecology and Obstetrics, University Hospital Erlangen, Friedrich-Alexander University
Erlangen-Nuremberg, Comprehensive Cancer Center Erlangen-EMN, Erlangen, Germany
49 David Geffen School of Medicine, Department of Medicine Division of Hematology and Oncology, University of California
at Los Angeles, Los Angeles, CA, USA
50 Usher Institute of Population Health Sciences and Informatics, The University of Edinburgh Medical School, Edinburgh, UK 51 Division of Cancer Epidemiology and Genetics, National Cancer Institute, Rockville, MD, USA
52 Department of Breast Surgery, Herlev and Gentofte Hospital, Copenhagen University Hospital, Herlev, Denmark 53 Cancer Epidemiology Centre, Cancer Council Victoria, Melbourne, Australia
54 Centre for Epidemiology and Biostatistics, Melbourne School of Population and Global Health, The University of Melbourne,
Melbourne, Australia
55 Department of Medicine, McGill University, Montreal, Canada
56 Division of Clinical Epidemiology, Royal Victoria Hospital, McGill University, Montreal, Canada 57 Human Cancer Genetics Program, Spanish National Cancer Research Centre, Madrid, Spain
58 Cancer & Environment Group, Center for Research in Epidemiology and Population Health (CESP), INSERM, University
Paris-Sud, University Paris-Saclay, VilleJuif, France
61 Department of Health Sciences Research, Mayo Clinic, Rochester, MN, USA
62 Department of Medical Oncology, Family Cancer Clinic, Erasmus MC Cancer Institute, Rotterdam, The Netherlands 63 Department of Genetics and Pathology, Pomeranian Medical University, Szczecin, Poland
64 Division of Genetics and Epidemiology, the Institute of Cancer Research, London, UK 65 Cancer Center of Eastern Finland, University of Eastern Finland, Kuopio, Finland 66 Central Finland Hospital District, Jyväskylä Central Hospital, Jyväskylä, Finland 67 Vesalius Research Center, Leuven, Belgium
68 Laboratory for Translational Genetics, Department of Oncology, University of Leuven, Leuven, Belgium 69 University of Hawaii Cancer Center, Honolulu, HI, USA
70 Department of Molecular Medicine and Surgery, Karolinska Institutet, Stockholm, Sweden
71 Institute of Clinical Medicine, Pathology and Forensic Medicine, University of Eastern Finland, Kuopio, Finland 72 Imaging Center, Department of Clinical Pathology, Kuopio University Hospital, Kuopio, Finland
73 Department of Oncology - Pathology, Karolinska Institutet, Stockholm, Sweden 74 National Center for Tumor Diseases, University of Heidelberg, Heidelberg, Germany
75 Department of Population Sciences, Beckman Research Institute of City of Hope, Duarte, CA, USA
76 Department of Obstetrics and Gynecology, Helsinki University Hospital, University of Helsinki, Helsinki, Finland 77 Multidisciplinary Breast Center, Department of Oncology, University Hospitals Leuven, Leuven, Belgium
78 Research Center for Genetic Engineering and Biotechnology “Georgi D. Efremov”, Macedonian Academy of Sciences and
Arts, Skopje, Republic of Macedonia
79 Laboratory of Cancer Genetics and Tumor Biology, Cancer and Translational Medicine Research Unit, Biocenter Oulu,
University of Oulu, Oulu, Finland
80 Laboratory of Cancer Genetics and Tumor Biology, Northern Finland Laboratory Centre Oulu, Oulu, Finland
81 Unit of Molecular Bases of Genetic Risk and Genetic Testing, Department of Preventive and Predictive Medicine, Fondazione Istituto Di Ricovero e Cura a Carattere, Scientifico, Istituto Nazionale Tumori, Milan, Italy
82 Research Oncology, Guy’s Hospital, King’s College London, London, UK
83 Division of Epidemiology, Department of Medicine, Vanderbilt-Ingram Cancer Center, Vanderbilt University School of
Medicine, Nashville, TN, USA
84 Department of Pathology, The University of Melbourne, Melbourne, Australia
85 Division of Genetics and Epidemiology & Division of Breast Cancer Research, The Institute of Cancer Research, London, UK 86 Department of Surgery, Leiden University Medical Center, Leiden, The Netherlands
87 Wellcome Trust Centre for Human Genetics and Oxford NIHR Biomedical Research Centre, University of Oxford, Oxford, UK 88 Institute of Human Genetics, Pontificia Universidad Javeriana, Bogota, Colombia
89 Department of Clinical Genetics, Erasmus University Medical Center, Rotterdam, The Netherlands 90 Peter MacCallum Cancer Center, the University of Melbourne, Melbourne, Australia
91 Centro de Investigación en Red de Enfermedades Raras, Valencia, Spain
92 Department of Genetics, QIMR Berghofer Medical Research Institute, Brisbane, Australia
93 Department of Clinical Molecular Biology, Oslo University Hospital, University of Oslo, Oslo, Norway 94 Department of Human Genetics, McGill University, Montreal, Quebec, Canada
95 McGill University and Genome Quebec Innovation Centre, Montreal, Quebec, Canada * These authors have contributed equally to this work
Correspondence to: Jacques Simard, email: Jacques.Simard@crchudequebec.ulaval.ca
Keywords: breast cancer, genetic susceptibility, association studies, differential allelic expression, cis-regulatory variants Received: April 13, 2016 Accepted: October 13, 2016 Published: October 22, 2016
ABSTRACT
There are significant inter-individual differences in the levels of gene expression.
Through modulation of gene expression, cis-acting variants represent an important
source of phenotypic variation. Consequently, cis-regulatory SNPs associated with
INTRODUCTION
Breast cancer is a complex disease with a strong heritable component. Great efforts have been made during the last decades to elucidate the underlying etiology of this disease. Three classes of breast cancer susceptibility alleles with different levels of risk and prevalence in the population are now recognized. High-risk alleles such as BRCA1 [1, 2], BRCA2 [3, 4] and TP53 [5] explain approximately 20% of the inherited susceptibility, intermediate-risk alleles in DNA-repair genes increase this proportion by ~5% [6-18], and common lower-risk alleles, of which approximately 100 have been identified to date through genome-wide association studies (GWAS), replication and custom genotyping efforts, explain approximately 16% of the risk [19-41]. Recent evidence suggests that a substantial fraction of the residual aggregation could be explicable by other common variants not yet identified[35, 40].
Global analysis of genome-wide association study (GWAS) data has shown that the large majority of common variants associated with susceptibility to cancer lie in non-coding regions, and are presumed to mediate risk through regulation of gene expression [42, 43]. Indeed, variations in gene expression occur commonly in the human genome, playing a key role in human phenotypic variability [44-46]. Studies of allelic imbalances in expression indicate that allele-specific differences among transcripts within an individual can affect up to 30% of loci and, at the population level, ~30% of expressed genes show evidence of cis-regulation by common polymorphic alleles [47]. Recent evidence has also suggested that differences in gene expression play a critical role in the underlying phenotypic variation associated with many complex genetic diseases [48]. A recent report performed expression quantitative trait loci (cis-eQTL) analyses for mRNA expression in five tumor types (breast, colon,
kidney, lung and prostate) and tested 149 known cancer risk loci for eQTL effects [49]. They observed that 42 of these risk loci were significantly associated with eQTLs in at least one gene within 500 kb, eight of which were breast cancer risk loci [49]. Furthermore, a recent study has shown that close to half of the known risk alleles for estrogen receptor (ER)-positive breast cancer are eQTLs acting upon major determinants of gene expression in tumors [50]. These results suggest that additional cancer susceptibility loci may be identified through studying genetic variants affecting regulation of gene expression.
In the current study, we performed a breast cancer association study of 313 genetic variants showing evidence of association with differential allelic expression (DAE) selected from 175 genes involved in cancer etiology. These included genes involved in DNA repair (homologous recombination (HR) and DNA interstrand crosslink (ICL) repair), interacting and/or modulating BRCA1 and BRCA2 cellular functions, cell cycle control, centrosome amplification and AURKA interactions, apoptosis, ubiquitination, known tumor suppressors and mitotic and other kinases, as well as sex steroid action and mammographic density. We used genotype data derived from the iCOGS (Collaborative Oncological Gene-environment Study) custom array [35] to investigate the role of these variants on breast cancer risk.
RESULTS
Overall and subtype-specific breast cancer risk association analyses
For the one hundred seventy-five selected genes involved in cancer-related pathways, we identified a set of 355 genetic variants showing evidence of association with
disease-causing variants. To investigate whether common variants associated with differential allelic expression were involved in breast cancer susceptibility, a list of genes was established on the basis of their involvement in cancer related pathways and/or mechanisms. Thereafter, using data from a genome-wide map of allelic expression associated SNPs, 313 genetic variants were selected and their association with breast cancer risk was then evaluated in 46,451 breast cancer cases and 42,599 controls of European ancestry ascertained from 41 studies participating in the Breast Cancer Association Consortium. The associations were evaluated with overall breast cancer risk and with estrogen receptor negative and positive disease. One novel breast
cancer susceptibility locus on 4q21 (rs11099601) was identified (OR = 1.05, P =
5.6x10⁻⁶). rs11099601 lies in a 135 kb linkage disequilibrium block containing several
genes, including, HELQ, encoding the protein HEL308 a DNA dependant ATPase and
DNA Helicase involved in DNA repair, MRPS18C encoding the Mitochondrial Ribosomal
Protein S18C and FAM175A (ABRAXAS), encoding a BRCA1 BRCT domain-interacting
protein involved in DNA damage response and double-strand break (DSB) repair. Expression QTL analysis in breast cancer tissue showed rs11099601 to be associated
with HELQ (P = 8.28x10⁻¹⁴), MRPS18C (P = 1.94x10⁻²⁷) and FAM175A (P = 3.83x10⁻³),
explaining about 20%, 14% and 1%, respectively of the variance inexpression of
DAE (see S1 Table for complete list of genes and SNPs). Of the 355 SNPs originally selected, 313 (representing 227 independent SNPs with pairwise r2 < 0.1) were
successfully genotyped. Thirty-two variants were excluded because of low Illumina design scores, and eleven SNPs were excluded because of low call-rates and/or evidence of deviation from Hardy Weinberg Equilibrium (P-value < 10-7), respectively. Eighty-two SNPs were originally
submitted to be included on the iCOGS array but were replaced with surrogates in the final design of the array. Association results with breast cancer risk for all 313 SNPs are presented in S2 Table.
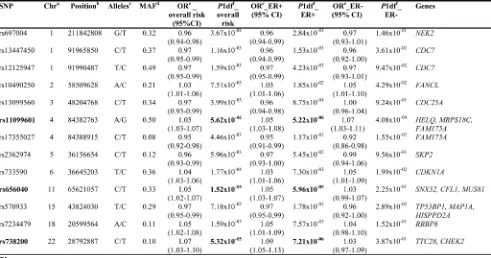
Thirteen SNPs from ten different loci were associated with overall breast cancer risk (P < 10-2) (Table
1). Of these, three SNPs, namely rs11099601, rs656040 and rs738200, had associations with an increased overall risk of breast cancer that reached P < 10-4 (approximate
significance cut-off after Bonferroni correction, given 313 tests). No significant evidence of heterogeneity was observed among odds ratios (ORs) for these SNPs among studies (I2 and P-values are given in S1 Figure).
The minor alleles of rs11099601 at 4q21 (OR = 1.05, P = 5.6x10⁻⁶), rs656040 at 11q13 (OR = 1.05, P = 1.52 x10 -5), and rs738200 at 22q12.1 (OR = 1.09, P = 5.32x10⁻⁵)
were associated with increased overall risk of the disease. rs11099601 was associated with both ER-positive (P = 5.22x10⁻⁶) and ER-negative (P = 4.08x10⁻⁴) breast cancer
risk (P for difference 0.93) while rs656040 and rs738200 appeared primarily associated with ER-positive disease (P = 5.96x10⁻⁵ and P = 7.21x10⁻⁶, respectively), although the
difference between ER-positive and ER-negative disease was not statistically significant for these two latter SNPs (P for difference 0.096 and 0.242, respectively). Of these three SNPs, only variant rs110099601 represents a novel low penetrance breast cancer susceptibility locus. The two other variants, (rs656040 at 11q13 and rs738200 at 22q12.1) which were not known to be associated with breast cancer risk at the time the current study was designed, were identified through the main analyses of the iCOGS array. rs656040 is located on 11q13 in the 3’-UTR region of the SNX32 gene, approximately 6.8Kb upstream of MUS81, and is associated with differential allelic expression of this latter gene (S2 Figure). rs656040 is partially correlated with rs3903072 (r2 = 0.38), which was
previously identified as associated with breast cancer risk at P < 10-8 in the combined GWAS and iCOGS analysis
[image:5.612.64.555.73.331.2]reported in Michailidou et al. [35]. Similarly, variant rs738200, located on locus 22q12 in the tetratricopeptide Table 1: Associations with breast cancer risk for SNPs showing evidence of differential allelic expression (overall p <0.01)
a Chromosome b Build 37 position
c Major/minor allele, based on the forward strand and minor allele frequency in Europeans d Mean minor allele frequency over all European controls in iCOGS
e Per-allele OR for the minor allele relative to the major allele f One-degree-of-freedom P-value
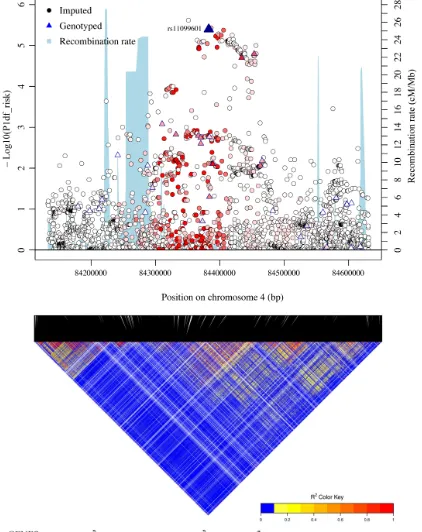
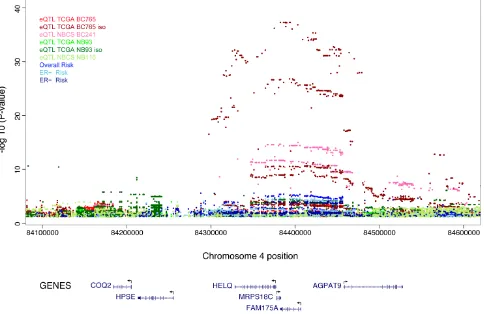
Figure 1: Regional plots of breast cancer risk association at 4q21. Regional plot of association result, recombination hotspots and LD for the 4q21: 84,132,874-84,631,193 loci. The index SNP rs11099601 is plotted as a blue triangle. Directly genotyped SNPs are represented as triangles and imputed SNPs (r2 > 0.3, MAF > 0.02) are represented as circles. The LD (r2) for the index SNP with each SNP
was computed based on European ancestry subjects included in the 1000 Genome Mar 2012 EUR. Pairwise r2 values are plotted using a
red scale, where white and red signify r2 = 0 and 1, respectively. P-values were from the single-marker analysis based on logistic regression
models after adjusted for age, study sites and the first six principal components plus one additional principal component for the LMBC in
analyses of data from European descendants. SNPs are plotted according to their chromosomal position: physical locations are based on
repeat domain 28 gene (TTC28), falls within a 610 kb interval (Build 37 coordinates chr22: 28,314,612-28,928,858) on chromosome 22 recently shown to be associated with breast cancer risk (smallest P = 8.2×10⁻²²,
for rs62237573). This interval lies approximately 100 kb centromeric to CHEK2, and further analysis showed that the associated SNPs were correlated with the deleterious CHEK2 variant c.1100delC and adjustment for this variant suggested the signal is driven by CHEK2 c.1100delC [40]. rs738200 was genotyped as a surrogate to our originally selected SNP for this locus (rs9620797), and therefore no allelic expression data were available for this SNP.
All variants associated with overall breast cancer risk with P < 10-2 included in Table 1 were also evaluated
for association with breast cancer risk in BRCA1 and BRCA2 mutation carriers within the Consortium of Investigators of Modifiers of BRCA1 and BRCA2 (CIMBA) in a total of 15 252 BRCA1 and 8 211 BRCA2 carriers. However, none of the SNPs showed associations with breast cancer risk, including rs11099601, which had a P-value of 0.89 and 0.78 in BRCA1 and BRCA2 carriers respectively.
rs11099601 lies on 4q21 in a region containing numerous genes including FAM175A (ABRAXAS), HELQ and MRPS18C. It was selected on the basis of its association with differential allelic expression in FAM175A (see S2 Figure). In order to further map the novel association at this locus, we imputed genotype data for 2,456 common variants across a 500 kb region centered on rs11099601 (chr4: 84,132,874-84,631,193 from GRCh37/hg19) using the March 2012 release of the 1000 Genomes Project as a reference panel. Subsequent association analysis for overall breast cancer risk revealed that rs11099601 was located in a region of approximately 135 kb exhibiting strong LD (Figure 1). SNP rs11099601 remained one of the most strongly associated SNPs, along with three other perfectly correlated imputed SNPs (r2 =
1.0), namely rs4235062 (P = 2.40x10⁻⁶), rs6838225 (P
= 3.70x10⁻⁶) and rs13142756 (P = 4x10⁻⁶) (Figure1) (S3
Table). 88 SNPs were strongly correlated with rs11099601 (r2 > 0.8; S4 Table) and hence not distinguishable as
potential causal variants on the basis of association data alone.
Functional annotation of locus 4q21
In order to identify potential candidate causal variants at the 4q21 locus, we overlaid the associated variants with publicly available functional annotations. The analysis was performed on the subset of 88 variants strongly correlated with the lead SNP, rs11099601 (r2 >
0.8). We first performed analyses using RegulomeDB (http://www.regulomedb.org) in order to obtain a predicted score of functionality for the set of variants. Interestingly, variant rs11099601 was one of three variants with the highest scores, along with rs1494961 and rs6535481. The
corresponding RegulomeDB score (1f) (S4 Table) suggests that these variants are likely to affect transcription factor binding and to be linked to expression of a target gene. The scores for the other three strongest associated SNPs, namely rs4235062, rs6838225 and rs13142756, were not suggestive of functionality (S4 Table - for a description of the RegulomeDB scoring scheme and referenced datatypes refer to http://www.regulomedb.org). Five other highly correlated SNPs (rs10008742, rs6844460, rs7691492, rs526064, rs813298), however, also had high scores (2b), albeit lower than that of the lead SNP rs11099601, indicative of likely affecting transcription factor binding.
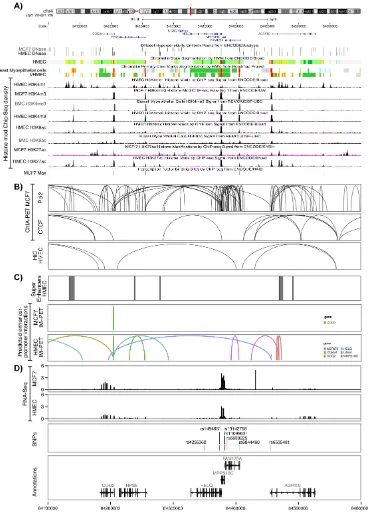
We then analysed ENCODE chromatin biofeatures, namely DNase I hypersensitivity, chromatin state segmentation by HMM (chromHMM) and histone modifications of epigenetic markers H3K4, H3K9 and H3K27 in all breast cell lines available in ENCODE, including breast myoepithelial cells, HMEC mammary cell line, and breast cancer cell line MCF-7. Analysis of these biofeatures revealed an overlap between H3K9Ac, a histone mark associated with active promoters, and our candidate variant, rs11099601 in breast myoepithelial cells. Further analysis of other genotyped and imputed variants correlated with rs11099601, revealed that only rs6844460 (P = 4.2x10⁻⁶, r2 = 0.967) overlapped
with several chromatin biofeatures in mammary cells. rs6844460, which is located within intron 1 of FAM175A, overlapped with a DNase hypersensitivity site in MCF-7 cells, with H3K4me3 histone marks (associated with active promoters) in breast myoepithelial cells, HMEC and MCF-7 cell lines, with H3K9Ac histone marks in both breast myoepithelial cells and HMEC cells, and with H3K27Ac histone marks in HMEC. ChromHMM data also predicts that this variant lies within an active promoter region in breast cell lines (Figure 2A). Moreover, rs6844460 overlapped with a binding site for transcription factor Max (MYC Associated Factor X) in MCF7 cells.
In order to identify potential target genes, we analysed enhancer-promoter interactions using ChiA-PET data for CCCTC-binding factor (CTCF) and DNA polymerase II (PolII) in MCF-7 breast tumour derived cells. Multiple, dense, chromosomal interactions were observed in ChiA-PET data for PolII across most of the entire locus, especially in the region encompassing rs11099601, in the vicinity of the promoter regions of HELQ, MRPS18C and FAM175A genes. ChiA-PET data for CTCF in MCF-7 cells showed fewer interactions, none of which encompassed variant rs11099601. Similarly Hi-C data revealed few interactions in HMEC cells, none of which included our top candidate SNP (Figure 2B).
Figure 2: Functional annotation of the 4q21 locus. A. Functional annotations using data from the ENCODE and NIH Roadmap Epigenomics projects. From top to bottom, epigenetic signals evaluated included DNase clusters in MCF7 and HMEC cells, chromatin state segmentation by Hidden Markov Model (ChromHMM) in HMEC, breast myoepithelial cells (BMC) and Variant human mammary epithelial cells (vHMEC), where red represents an active promoter region, orange a strong enhancer and yellow a poised enhancer
respectively (the detailed color scheme of chromatin states is described in the UCSC browser), histone modifications in MCF7, HMEC and BMC cell lines ; and overlap between candidate variants and Max binding site in MCF7 cells. All tracks were generated by the UCSC
genome browser (hg 19). B. Long-range chromatin interactions. From top to bottom, ChIA-Pet interactions for PolII and CTCF in MCF7
cells and Hi-C interactions in HMEC cells. The ChIA-PET raw data available on GEO under the following accession (GSE63525.K56,
GSE33664, GSE39495) were processed with the GenomicRanges package. C. Maps of mammary cell super-enhancer locations as defined in Hnisz et al. are shown in HMEC cells. Predicted enhancer-promoter determined interactions in MCF7 and HMEC cells, as defined by the
integrated method for predicting enhancer targets (IM-PET) are shown. D. RNA-Seq data from MCF7 and HMEC cell lines. The value of the RNA-Seq analysis corresponds to the mean RPM value for FAM175A, MRPS18C, HELQ, AGPAT9, HSPE and COQ2 from four HMEC
and 19 MCF7 datasets, respectively. The annotation was obtained through the Bioconductor annotation package TxDb.Hsapiens.UCSC.
interactions with MRPS18C overlapped with our top putative candidate functional variants (rs11099601 and rs6844460) (Figure 2C).
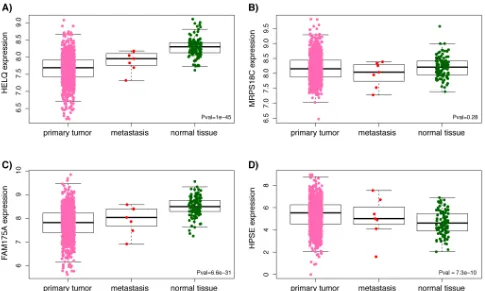
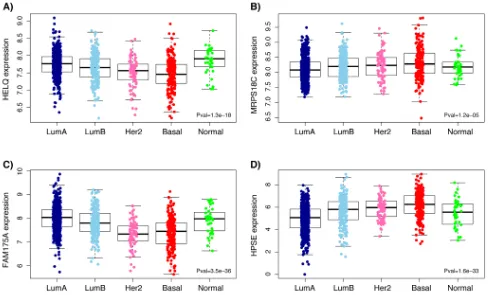
Analysis of RNASeq data from ENCODE showed high levels of expression for MRPS18C in both HMEC and MCF-7 while HELQ and FAM175A are expressed at very low levels in these cell lines (Figure 2D). However, as illustrated in Figure 3, analysis of TCGA breast cancer RNAseq data in primary tumor (n = 765), adjacent normal (n = 93) and metastasis (n = 6) showed that HELQ, FAM175A and HPSE, but not MRPS18C, were all found to be differentially expressed between normal breast and tumor tissue (P = 1x10-45, P = 6.6x10⁻³¹, P = 7.3x10⁻¹⁰,
and P = 0.28, respectively, as determined by a Kruskal-Wallis rank sum test). Further analysis comparing the tumor expression levels of these genes between the 5 molecular subtypes of breast cancer, namely: Luminal A, Luminal B, Her2-enriched, Basal-like and Normal-like, showed that while HELQ and FAM175A expression levels are decreased in Basal-like tumors (P = 1.3x10⁻¹⁸ and P
= 3.5x10-36, respectively (Kruskal-Wallis test), MRPS18C
and HPSE expression were found to be up regulated in Basal-like carcinomas (P = 1.2x10⁻⁵, P = 1.6x10⁻³³) (Figure
4).
Expression quantitative trait locus analysis (eQTL) in breast tissue
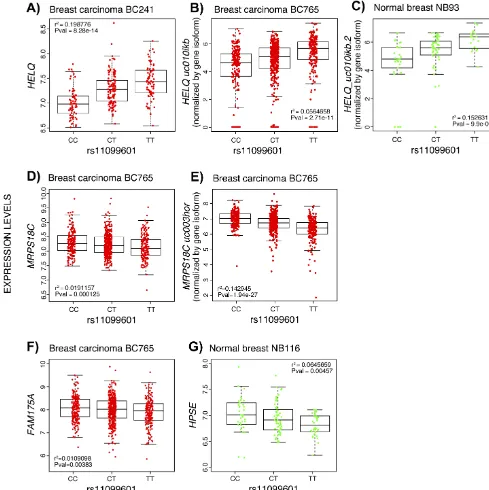
In order to identify associations between candidate variants and expression levels of genes within the 4q21 region, we analyzed all genotyped and imputed SNPs within a 1Mb region centered around the most significant SNP (rs11099601), in normal and breast cancer tissue. Significant eQTL associations were observed for numerous SNPs in the region in both normal breast and tumors (Figure 5). In the breast cancer tissue dataset BC241, the most strongly expression-associated SNP at this locus was our top risk SNP rs11099601, which was associated with expression levels of HELQ, (with P = 8.28x10⁻¹⁴
and r2 = 0.20, where the r2 value indicates the percentage
of variance in HELQ expression levels explained by rs11099601) (Figure 6A). A decrease in HELQ expression levels was observed with increasing copy number of the rs11099601 (C) allele (Figure 6A). Multiple SNPs within the 1 Mb region were also associated with expression of HELQ, all of which were correlated with rs11099601 (r2 > 0.3). No significant eQTLs were observed between
rs11099601 and other genes in this region, namely COQ2, HPSE, MRPS18C, FAM175A, or AGPAT9, using data from the BC241 sample set.
[image:9.612.70.555.390.681.2]In theTCGA BC765 breast cancer dataset, HELQ
Figure 3: Boxplots representing differential expression of HELQ (A), MRPS18C (B), FAM175A (C) and HPSE (D) in breast tissues. Differential expression between normal breast and tumor tissue was determined by a Kruskal-Wallis rank sum test using
expression levels were not associated with rs11099601 (P = 0.34 and r2 = 0.00099) or with any other SNPs in this
region. Weak associations were only observed between rs11099601 and expression levels for MRPS18C (P = 1.25x10⁻⁴ and r2 = 0.02) (Figure 6D) and FAM175A (P =
3.83x10⁻³ and r2 = 0.011) (Figure6F).
Further isoform-specific analysis was performed in the TCGA BC765 breast cancer dataset. In contrast to the expression data generated from the Norwegian sample sets, which were obtained using expression arrays, expression data from the TCGA datasets used in the current study were obtained by RNA-Sequencing, thus allowing further analysis of different gene isoforms. Thus, in the BC765 dataset, these analyses resulted in the identification of significant eQTLs for an isoform of HELQ (uc101ikb) (P = 2.71x10⁻¹¹ and r2 = 0.056) (Figure
6B), corresponding to a long isoform of the gene with one exon lacking. These analyses also further revealed highly significant associations for the MRPS18C isoform uc003hor (P = 1.94x10⁻²⁷ and r2 = 0.143) (Figure 6E).
Similar to what is observed in the TCGA BC765 breast cancer dataset, gene-normalized analysis in the TCGA normal breast tissue dataset NB93 did not reveal associations between HELQ expression levels and rs11099601 while isoform-normalized analysis showed
associations with HELQ isoform uc101ikb (P = 9.90x10 -05 and r2 = 0.153) (Figure 6C).
In normal breast tissue from the NBCS (NB116), the strongest eQTLs were observed for HPSE, where rs11099601 was associated with a decrease in HPSE expression levels (P = 4.57x10⁻³, r2 = 0.0645) (Figure 6G).
rs11099601 was not associated with the expression levels of any other genes in this region.
[image:10.612.69.557.367.662.2]Although associations were detected between several genes and our top risk SNP in the different sample sets, a lack of consistency in eQTL associations between the two breast cancer sample sets was observed. It should be noted that expression data were obtained trough different approaches as previously mentioned, i.e expression array (44K Agilent array) for BC241 and RNA-Sequencing for BC765 (Illumina RNAseq). Moreover, there are differences in the overall PAM50 subtype distributions between these two sample sets. As depicted in S3 Figure, differences are noted mainly in the distribution of Luminal A (28.22% in BC241 compared to 49.33% for BC765), Her2 (15.35% in BC241 compared to 8.16% for BC765) and Normal-like (14.52% in BC241 compared to 2.41% for BC765) subtypes. Expression levels of HELQ, and other candidate genes, were shown to vary significantly between these molecular subtypes
Figure 4: Boxplots representing expression levels of HELQ (A), MRPS18C (B), FAM175A (C) and HPSE (D) in the 5 molecular subtypes (PAM50 classifier) of breast primary tumors. Differential expression between normal breast and tumor tissue
was determined by a Kruskal-Wallis rank sum test. Analysis was performed using TCGA breast cancer RNAseq data from five molecular
(Figure 4) and thus a different distribution of these subtypes between the two sample sets could explain the underlying lack of replication in the eQTL analyses.
DISCUSSION
It is well recognized that genetic variants located in genomic regions that regulate gene expression are major causes of human diversity and may also be important susceptibility factors for complex diseases and traits. Indeed, it has been shown that approximately 30% of expressed genes show evidence of cis-regulation by common polymorphic alleles [47]. Moreover, in recent years, GWAS have identified thousands of variants associated with various diseases/traits, ~90% of which localize outside of known protein-coding regions [42, 43], implicating a regulatory role for these variants.
In the present study, we have assessed the association with breast cancer risk of 313 regulatory SNPs in genes involved in the etiology of cancer (see S1 Table for complete list of SNPs and genes), in 46,451 breast cancer cases and 42,599 controls of European ancestry. Using this approach, we identified rs11099601 (OR = 1.05,
P = 5.6x10⁻⁶), a novel breast cancer susceptibility locus
on chromosome 4q21. Analysis of imputed SNPs across a 500Kb region surrounding rs11099601 revealed that this variant remained one of the strongest risk signals, tagging a set of 76 strongly correlated SNPs across a 135Kb LD block containing several genes, including COQ2, HPSE, HELQ, MRPS18C, FAM175A (ABRAXAS) and AGPAT9.
Functional annotation of the 4q21 locus with ENCODE biofeatures in mammary cell lines pointed toward rs11099601 as one of the most likely functional variants in this region. eQTL analysis showed significant eQTLs in normal and breast cancer tissue for several variants in the 4q21 region, including rs11099601. The strongest associations for rs11099601 and expression were observed in breast carcinomas for MRPS18C and HELQ and explain approximately 14% and 20% of their expression variance, respectively (Figure 6). Other genes whose expression correlated with this eQTL included HPSE and FAM175A.
[image:11.612.66.550.351.665.2]These genes represent interesting candidates for further analyses related to breast cancer susceptibility. Indeed, analysis of TCGA breast cancer RNAseq data showed that HELQ, FAM175A and HPSE were found to be differentially expressed between normal breast and
tumor tissue and further analysis showed that HELQ and FAM175A expression levels are significantly decreased in basal-like tumors.
HELQ is a single-stranded DNA-dependent ATPase and DNA helicase involved in DNA repair and signaling in response to ICL. Genetic disruption of HELQ in human cells enhances cellular sensitivity and
[image:12.612.56.545.143.633.2]chromosome radial formation by the ICL-inducing agent mitomycin C (MMC). After treatment with MMC, reduced phosphorylation of CHK1 occurs in knockout cells and accumulation of G2/M cells is reduced [51]. Furthermore, it was recently shown that Helq helicase-deficient mice exhibit subfertility, germ cell attrition, ICL sensitivity, and tumor predisposition [52]. A meta-analysis of 22 GWAS,
Figure 6: Boxplots representing the most significant eQTL results for variant rs11099601 in normal breast tissue and breast tumor datasets. Box plots represent the expression levels of the indicated transcripts with respect to the rs11099601 genotypes. Expression levels are shown for A.HELQ in breast carcinoma BC241 dataset, B.HELQ in breast carcinoma BC765 dataset normalized per isoform,C.HELQ in normal breast NB93 dataset normalized by gene isoform, D.MRPS18C in breast carcinoma BC765 dataset, E.
MRPS18C in breast carcinoma BC765 dataset normalized per isoform, F.FAM175A in breast carcinoma BC765 dataset and G.HSPE in normal breast NB116 dataset. Horizontal bars indicate mean expression level per genotype. r2 values indicate the percentage of variance in
as well as a recent GWAS involving ~70,000 women performed in the BCAC, have both identified rs4693089, located in an intron of HELQ and perfectly correlated with rs11099601, as associated with age at natural menopause (p = 2.4x10⁻¹⁹ andp = 9.2x10⁻²³, respectively)
[53, 54]. Moreover, a GWAS of upper aero-digestive tract cancers conducted by the International Head and Neck Cancer Epidemiology Consortium identified rs1494961, a missense mutation V306I in the second exon of HELQ gene perfectly correlated with rs11099601 (r2 = 1), to be
associated with increased risk of upper aero-digestive tract cancers in their combined analysis (P = 1x10⁻⁸) [55].
Another study by the same group analyzed the role of DNA repair pathways in upper aero-digestive tract cancers [56]. This study showed that the polymerase pathway, to which the HELQ gene belongs, is the only pathway significant for all upper aero-digestive tract cancer sites combined and that this association is entirely explained by the association with rs1494961 (P = 2.65×10⁻⁴) [56].
Finally, a recent study reported the mutation screening of HELQ in 185 Finnish breast or ovarian cancer families [57]. This study did not provide evidence for a role of HELQ in breast cancer susceptibility in the Finnish population, but analyses in other populations and larger datasets are needed to further assess its role in breast cancer predisposition [57], especially with regard to the involvement of rare variants. In the current study, we have shown HELQ to be differentially expressed between normal breast and tumor tissue and to be significantly down regulated in basal-like breast tumors compared to ER positive tumors, suggesting that altered gene expression levels, potentially mediated through the effect of regulatory variants, could be one of the mechanisms contributing to breast cancer susceptibility. Previous studies have provided some evidence, in known breast cancer susceptibility genes BRCA1 [58] and BRCA2 [59], of genetic variants associated with allelic expression differences which could affect the risk of breast cancer in mutation carriers through altering expression levels of the wild-type allele. Also, a recent study showed suggestive associations between DAE associated variants located in breast cancer susceptibility chromosomal regions, and prognosis (ZNF331 and CHRAC1) [60].
Another gene in this locus, FAM175A, is involved in DNA damage response and double-strand break (DSB) repair. It is a component of the BRCA1-A complex, acting as a central scaffold protein that assembles the various components of the complex and mediates the recruitment of BRCA1 [61-63]. Further evidence rendering FAM175A/ ABRAXAS an interesting candidate gene is a recent report showing that both homozygous and heterozygous Abraxas knockout mice exhibited decreased survival and increased tumor incidence [64]. This study also showed that somatic deletion of the ABRAXAS locus on chromosome 4q21 is found in human ovarian and breast cancers (especially basal subtype), and this loss is well correlated with reduced
ABRAXAS expression in these cancers [64]. Moreover, Solyom et al. reported a novel germline ABRAXAS mutation (p.Arg361Gln) in Northern Finnish breast cancer families which affects the nuclear localization of the protein and consequently reduces the formation of BRCA1 and Rap80 foci at DNA damage sites, leading to ionizing radiation hypersensitivity of cells and partially impairing the G2/M checkpoint [65]. Our group has also, in parallel to the present study, conducted a population-based case-control mutation screening study of the coding exons and exon/intron boundaries of ABRAXAS in 1250 breast cancer cases and 1250 controls from the Breast Cancer Family Registry, including individuals from different ethnic groups such as Caucasian, Latino, East Asian and African-American ancestry. Although this study did not reveal evidence of association of the identified variants with breast cancer risk, two variants were identified and were shown to diminish the phosphorylation of γ-H2AX, an important biomarker of DNA double-strand breaks [66].
Lastly, MRPS18C encodes a protein that belongs to the ribosomal protein S18P family, which includes three proteins (MRPS18A, MRPS18B, MRPS18C) having significant sequence similarity to bacterial S18 proteins. MRPS18Cis part of the small subunit (28S) of the mitochondrial ribosome involved in oxidative phosphorylation and thus the role of this protein in breast cancer susceptibility is unclear. It was reported that MRPS18B (MRPS18-2) binds to RB [67] and prevents the formation of the E2F1-RB complex that leads to elevated levels of free E2F1 protein in the nucleus and the subsequent promotion of S phase entry [68]. Overexpression of human MRPS18B caused transformation of terminally differentiated rat skin fibroblasts and transformed cells became tumorigenic in SCID (severe combined immunodeficiency) mice [69]. These transformed cells showed anchorage-independent growth and loss of contact inhibition; they expressed epithelial markers, showed increased telomerase activity, disturbance of the cell cycle, and chromosomal instability, leading the authors to suggest that MRPS18B is a newly identified oncoprotein [69]. Although these results suggest that MRPS18B may be involved in carcinogenesis, there is currently no evidence showing that MRPS18C is involved in processes other than oxidative phosphorylation.
CONCLUSION
analyses have confirmed significant eQTLs for this locus in both normal and breast cancer tissue.
At the time of study design, data on differential allelic expression was not available in breast tissue, leading us to perform the selection of candidate variants in other cell types such as lymphoblastoid cell lines, fibroblasts and monocytes. This constitutes a limitation of our study which may explain why some of the associations observed between the selected variants and DAE in these cells types were not replicated in the eQTL analyses performed in normal breast and/or breast cancer cells. Indeed, SNPs associated with variation in gene expression have now been mapped for a variety of tissues, highlighting their tissue dependent properties and the need for expression profiling of a diverse panel of cell types.
Hence, further functional characterization of the 4q21 locus, and replication in a larger dataset, would be relevant to provide more robust evidence of the involvement of this region in breast cancer susceptibility as well as identify the gene(s) and biological mechanism(s) underlying this susceptibility.
MATERIALS AND METHODS
Sample selection
A total of 46,451 breast cancer cases and 42,599 controls of European ancestry were included from 41 studies participating in the Breast Cancer Association Consortium (BCAC). Studies were population-based or hospital-based case-control studies, including nested case-control studies within cohorts. Some studies selected cases by age, or oversampled cases with a family history (S5 Table). Studies provided ~2% of samples in duplicate for quality control purposes (see below). Study subjects were recruited on protocols approved by the Institutional Review Boards at each participating institution, and all subjects provided written informed consent.
SNP selection
SNP selection was performed by first identifying a list of genes of interest, which was determined by the involvement of these genes in cancer related pathways and/or mechanisms. The list of genes was established by researching published results and/or by using available public databases such as the Kyoto Encyclopedia of Genes and Genomes (KEGG) (http://www.genome.jp/
kegg/). Thereafter, DEA SNPs falling within these gene
regions were identified using previously reported data on allelic expression cis-associations, derived using: 1) the llumina Human1M-duo BeadChip for lymphoblastoid cell lines from Caucasians (CEU population) (n = 53) [47], the Illumina Human 1M Omni-quad for primary skin
fibroblasts derived from Caucasian donors (n = 62) [49, 70], and the Illumina Infinium II assay with Human 1.2 M Duo custom BeadChips v1 for human primary monocytes (n = 188) [71]. Briefly, 1000 Genomes project data was used as a reference set (release 1000G Phase I v3) for the imputation of genotypes from HapMap individuals. Untyped markers were inferred using algorithms implemented in IMPUTE2. The unrelated fibroblast panel consisted of 31 parent-offspring trios, where the genotypes of offspring were used to allow for accurate phasing. Mapping of each allelic expression trait was carried out by first normalizing allelic expression ratios at each SNP using a polynomial method [72] and then calculating averaged phased allelic expression scores across annotated transcripts, followed by correlation of these scores to local (transcript +/-500 kb) SNP genotypes in fibroblasts as described earlier [70].
Three hundred fifty-five genetic variants were selected on the basis of evidence of association with DAE in 175 genes involved in cancer-related pathways as described above (see S1 Table for complete list of SNPs and genes). Following selection, SNPs were submitted for design and inclusion on a custom Illumina Infinium array (iCOGS), as part of a BCAC genotyping initiative (see Genotyping and Quality Control section below). After undergoing design and post-genotyping quality control, 313 SNPs remained for analysis.
Genotyping and quality control
Genotyping was carried out as part of a collaboration between BCAC and three other consortia (the Collaborative Oncological Gene-environment Study, COGS). Full details of SNP selection, array design, genotyping and post-genotyping quality control (QC) have been published [35]. Briefly, three categories of SNPs were chosen for inclusion on the array: (i) SNPs selected on the basis of pooled GWAS data, (ii) SNPs selected for the fine-mapping of published risk loci and (iii) candidate SNPs selected on the basis of previous analyses or specific hypotheses. The 313 SNPs described in the current study were candidate SNPs selected on the basis of the hypothesis that regulatory variants are involved in breast cancer susceptibility. In general, only SNPs with an Illumina design score of 0.8 or greater were considered. SNPs were preferentially accepted if they had a design score of 1.1 (i.e. had previously been genotyped on an Illumina platform). If not, we sought SNPs with r2 = 1 with the selected SNP, and selected the SNP with
the best design score. If no such SNP was available, we selected SNPs with r2 > 0.8 with the chosen SNP, and
quality control measures were applied across all SNPs and all samples genotyped as part of the COGS project [35]. After quality control, genotype data were available for 48 155 breast cancer cases and 43 612 controls, and call rates for all SNPs were > 95%.
Statistical analysis
Per-allele log-odds ratios (ORs) were estimated using logistic regression, adjusted for principal components and study, as described previously [35]. P-values were estimated using Wald test.For imputation, genotype data from 48,155 breast cancer cases and 43,612 controls were used to estimate genotypes for other common variants across a 500 kb region on chromosome 4 (chr4: 84,132,763-84,632,763 - NCBI build 37 assembly), with IMPUTE v.2.2 and the March 2012 release of the 1,000 Genomes Project as reference panel. In all analyses, only SNPs with imputation information/accuracy r2 > 0.30 were considered [40].
Linkage disequilibrium
LD values were computed using 118 independent individuals from the CEU population of the 1,000 Genome dataset (v3, release 20110521, downloaded from 1000genomes.ebi.ac.uk on April 2013) [73]. The relevant subset was extracted from the raw data using VCFtools (v0.1.7) [74] and the paired r2 statistics were obtained for
all target loci using PLINK! (v1.07) [75]. The linkage heatmaps and the association plots were produced on the R platform (v3.0) using the package LDheatmap [76].
Breast cancer association analyses performed in
BRCA1 and BRCA2 mutation carriers
Associations with breast cancer risk were evaluated within a retrospective cohort framework, by modelling the retrospective likelihood of the observed genotypes conditional on the disease phenotype. These analyses are described in detail elsewhere [77, 78].
Functional annotation
Two publicly available tools, RegulomeDB [79] and HaploReg V4 [80], were also used to evaluate candidate variants. For a full description of the RegulomeDB scoring scheme refer to (http://www.regulomedb.org).
Publicly available genomic data was also used to annotate each SNP most strongly associated with breast cancer risk at locus 4q21 (for data sources refer to S6 Table). The following regulatory features were obtained for breast cell types from ENCODE and NIH Roadmap Epigenomics data through the UCSC Genome Browser:
DNase I hypersensitivity sites, Chromatin Hidden Markov Modelling (ChromHMM) states, histone modifications of epigenetic markers more specifically commonly used marks associated with enhancers (H3K4Me1 and H3K27Ac) and promoters (H3K4Me3 and H3K9Ac), and transcription factor ChiP-seq data.
To identify putative target genes, we examined potential functional chromatin interactions between distal and proximal regulatory transcription-factor binding sites and the promoters at the risk loci, using the Chromatin Interaction Analysis by Paired End Tag (ChiA-PET) and Genome conformation capture (Hi-C, 3C and 5C) datasets downloaded from GEO (for data sources refer to S6 Table).
Maps of active mammary super-enhancer regions in HMEC cells were obtained from Hnisz et al. [81]. Predicted enhancer-promoter determined interactions were obtained from the integrated method for predicting enhancer targets (IM-PET) described in He et al. [82].
RNA-Seq data from ENCODE was used to evaluate the expression of exons across the 4q21 locus in HMEC and MCF7 cell lines. For HMEC and MCF7, alignment files from 4 and 19 expression datasets respectively were downloaded from ENCODE using a rest API wrapper (ENCODExplorer R package) [83] in the bam format and processed using metagene R packages [84] to normalize in Reads per Millions aligned, and to convert in coverages.
eQTL analyses
and per isoform, as obtained from the TCGA consortium [87]. The data was log2 transformed, and unexpressed genes were excluded prior to eQTL analysis. Breast carcinomas: BC241, is a Caucasian sample set recruited from Oslo, n = 241. The sample set includes all stages of breast cancer, and genotypes were obtained with the iCOGS SNP array, and mRNA expression data was from the Agilent 44K array [86, 89]. BC765 comprises samples from the TCGA breast cancer sample set of Caucasian origin [87], n = 765 for the data normalized per gene, and n = 766 for the data normalized per isoform. Genotyping platform was Affy6, and gene expression was measured using RNA sequencing. See NB93 for a more detailed description. For all sample sets, the genotyping data was processed as follows: SNPs with call rates < 0.95 or minor allele frequencies < 0.05 were excluded, as were SNPs out of Hardy Weinberg equilibrium with P < 10-13.
All samples with a call rate below 80% were excluded. Identity by state was computed using the R GenABEL package [90], and closely related samples with IBS > 0.95 were removed. The SNP and sample filtration criteria were applied iteratively until all samples and SNPs met the stated thresholds.
ACKNOWLEDGMENTS
BCAC thanks all the individuals who took part in these studies and all the researchers, clinicians, technicians and administrative staff who have enabled this work to be carried out. This study would not have been possible without the contributions of the following: Per Hall (COGS); Douglas F. Easton, Paul Pharoah, Kyriaki Michailidou, Manjeet K. Bolla, Qin Wang (BCAC), Andrew Berchuck (OCAC), Rosalind A. Eeles, Douglas F. Easton, Ali Amin Al Olama, Zsofia Kote-Jarai, Sara Benlloch (PRACTICAL), Georgia Chenevix-Trench, Antonis Antoniou, Lesley McGuffog, Fergus Couch and Ken Offit (CIMBA), Joe Dennis, Alison M. Dunning, Andrew Lee, and Ed Dicks, Craig Luccarini and the staff of the Centre for Genetic Epidemiology Laboratory, Javier Benitez, Anna Gonzalez-Neira and the staff of the CNIO genotyping unit, Jacques Simard and Daniel C. Tessier, Francois Bacot, Daniel Vincent, Sylvie LaBoissière and Frederic Robidoux and the staff of the McGill University and Génome Québec Innovation Centre, Stig E. Bojesen, Sune F. Nielsen, Borge G. Nordestgaard, and the staff of the Copenhagen DNA laboratory, and Julie M. Cunningham, Sharon A. Windebank, Christopher A. Hilker, Jeffrey Meyer and the staff of Mayo Clinic Genotyping Core Facility. ABCFS thanks Maggie Angelakos, Judi Maskiell, and Gillian Dite. ABCS thanks Sten Cornelissen, Richard van Hien, Linde Braaf, Frans Hogervorst, Senno Verhoef, Laura van’t Veer, Emiel Rutgers, C Ellen van der Schoot, Femke Atsma. BBCS Acknowledges Eileen Williams, Elaine Ryder-Mills, and Kara Sargus. BIGGS Acknowledges Niall McInerney,
thanks Paolo Peterlongo of IFOM, the FIRC Institute of Molecular Oncology; Siranoush Manoukian, Bernard Peissel, Daniela Zaffaroni and Jacopo Azzollini of the Fondazione IRCCS Istituto Nazionale dei Tumori (INT); Monica Barile and Irene Feroce of the Istituto Europeo di Oncologia (IEO), and the personnel of the Cogentech Cancer Genetic Test Laboratory. MTLGEBCS would like to thank Martine Tranchant (CHU de Québec Research Center), Marie-France Valois, Annie Turgeon and Lea Heguy (McGill University Health Center, Royal Victoria Hospital; McGill University) for DNA extraction, sample management and skillful technical assistance. J.S. is Chairholder of the Canada Research Chair in Oncogenetics. The following are NBCS Collaborators that we would like to thank: Dr. Kristine K.Sahlberg, PhD (Department of Research, Vestre Viken Hospital, Drammen, Norway and Department of Cancer Genetics, Institute for Cancer Research, Oslo University Hospital-Radiumhospitalet, Oslo, Norway), Dr. Lars Ottestad, MD (Department of Cancer Genetics, Institute for Cancer Research, Oslo University Hospital-Radiumhospitalet, Oslo, Norway), Prof. Em. Rolf Kåresen, MD (Institute of Clinical Medicine, University of Oslo, Oslo, Norway and Department of Breast- and Endocrine Surgery, Division of Surgery, Cancer and Transplantation, Oslo University Hospital, Oslo, Norway), Dr. Anita Langerød, PhD (Department of Cancer Genetics, Institute for Cancer Research, Oslo University Hospital-Radiumhospitalet, Oslo, Norway), Dr. Ellen Schlichting, MD (Section for Breast- and Endocrine Surgery, Department of Cancer, Division of Surgery, Cancer and Transplantation Medicine, Oslo University Hospital, Oslo, Norway), Dr. Marit Muri Holmen, MD (Department of Radiology and Nuclear Medicine, Oslo University Hospital, Oslo, Norway), Prof. Toril Sauer, MD (Department of Pathology at Akershus University hospital, Lørenskog, Norway and Institute of Clinical Medicine, Faculty of Medicine, University of Oslo, Oslo, Norway), Dr. Vilde Haakensen, MD (Department of Cancer Genetics, Institute for Cancer Research, Oslo University Hospital-Radiumhospitalet, Oslo, Norway), Dr. Olav Engebråten, MD (Department of Tumor Biology, Institute for Cancer Research, Oslo University Hospital, Oslo, Norway, Department of Oncology, Division of Surgery and Cancer and Transplantation Medicine, Oslo University Hospital, Oslo, Norway and Institute for Clinical Medicine, Faculty of Medicine, University of Oslo, Oslo, Norway), Prof. Bjørn Naume, MD (Department of Oncology, Division of Surgery and Cancer and Transplantation Medicine, Oslo University Hospital-Radiumhospitalet, Oslo, Norway and K.G. Jebsen Centre for Breast Cancer, Institute for Clinical Medicine, University of Oslo, Oslo, Norway.), Dr. Cecile E. Kiserud, MD (National Advisory Unit on Late Effects after Cancer Treatment, Department of Oncology, Oslo University Hospital, Oslo, Norway and Department of Oncology, Oslo University Hospital, Oslo, Norway), Dr.
Kristin V. Reinertsen, MD (National Advisory Unit on Late Effects after Cancer Treatment, Department of Oncology, Oslo University Hospital, Oslo, Norway and Department of Oncology, Oslo University Hospital, Oslo, Norway), Assoc. Prof. Åslaug Helland, MD (Department of Genetics, Institute for Cancer Research and Department of Oncology, Oslo University Hospital Radiumhospitalet, Oslo, Norway), Dr. Margit Riis, MD (Dept of Breast- and Endocrine Surgery, Oslo University Hospital, Ullevål, Oslo, Norway), Prof. Jürgen Geisler, MD (Department of Breast-Endocrine Surgery, Akershus University Hospital, Oslo, Norway and Institute of Clinical Medicine, Faculty of Medicine, University of Oslo, Oslo, Norway), Prof. Per Eystein Lønning, MD (Section of Oncology, Institute of Medicine, University of Bergen and Department of Oncology, Haukeland University Hospital, Bergen, Norway), OSBREAC (Oslo Breast Cancer Research Consortium). NBHS thanks study participants and research staff for their contributions and commitment to this study. OBCS thanks Arja Jukkola-Vuorinen, Mervi Grip, Saila Kauppila, Meeri Otsukka and Kari Mononen for their contributions to this study. OFBCR thanks Teresa Selander, Nayana Weerasooriya. ORIGO thanks E. Krol-Warmerdam, and J. Blom for patient accrual, administering questionnaires, and managing clinical information. The LUMC survival data were retrieved from the Leiden hospital-based cancer registry system (ONCDOC) with the help of Dr. J. Molenaar. PBCS thanks Louise Brinton, Mark Sherman, Neonila Szeszenia-Dabrowska, Beata Peplonska, Witold Zatonski, Pei Chao and Michael Stagner. pKARMA acknowledges the Swedish Medical Research Counsel. RBCS thanks Petra Bos, Jannet Blom, Ellen Crepin, Elisabeth Huijskens, Annette Heemskerk, and the Erasmus MC Family Cancer Clinic. SASBAC thanks The Swedish Medical Research Counsel. SBCS thanks Sue Higham, Helen Cramp, Ian Brock, Sabapathy Balasubramanian, Malcolm W.R. Reed and Dan Connley. SEARCH thanks The SEARCH and EPIC teams. SGBCC would like to thank the participants and research coordinator Kimberley Chua. SKKDKFZS acknowledges all study participants, clinicians, family doctors, researchers and technicians for their contributions and commitment to this study. UKBGS wants to thank Breast Cancer Now and the Institute of Cancer Research for support and funding of the Breakthrough Generations Study, and the study participants, study staff, and the doctors, nurses and other health care providers and health information sources who have contributed to the study. We acknowledge NHS funding to the Royal Marsden/ICR NIHR Biomedical Research Centre.
CONFLICTS OF INTEREST
The authors declare they have no conflict of interest.
FUNDING
This work was supported by the Canadian Institutes of Health Research for the “CIHR Team in Familial Risks of Breast Cancer” program - grant # CRN-87521, the Ministry of Economy Innovation and Exportations- grant # PSR-SIIRI-701 and by the Government of Canada through Genome Canada and the Canadian Institutes of Health Research, and the Ministère de l’Économie, de la Science et de l’Innovation du Québec through Genome Québec and The Quebec Breast Cancer Foundation for the PERSPECTIVE project. Jacques Simard is Chairholder of the Canada Research Chair in Oncogenetics. Silje Nord is financed by a carrier grant from the Norwegian Regional Health authorities (Grant number 2014061).
BCAC is funded by Cancer Research UK [C1287/ A10118, C1287/A12014] and by the European Community´s Seventh Framework Programme under grant agreement number 223175 (grant number HEALTH-F2-2009-223175) (COGS). Funding for the iCOGS infrastructure came from: the European Community’s Seventh Framework Programme under grant agreement n° 223175 (HEALTH-F2-2009-223175) (COGS), Cancer Research UK (C1287/A10118, C1287/A 10710, C12292/A11174, C1281/A12014, C5047/A8384, C5047/A15007, C5047/A10692, C8197/A16565), the National Institutes of Health (CA128978) and Post-Cancer GWAS initiative (1U19 CA148537, 1U19 CA148065 and 1U19 CA148112 - the GAME-ON initiative), the Department of Defence (W81XWH-10-1-0341), the Canadian Institutes of Health Research (CIHR) for the CIHR Team in Familial Risks of Breast Cancer, Komen Foundation for the Cure, the Breast Cancer Research Foundation, and the Ovarian Cancer Research Fund. The Australian Breast Cancer Family Study (ABCFS) was supported by grant UM1 CA164920 from the National Cancer Institute (USA). The content of this manuscript does not necessarily reflect the views or policies of the National Cancer Institute or any of the collaborating centers in the Breast Cancer Family Registry (BCFR), nor does mention of trade names, commercial products, or organizations imply endorsement by the USA Government or the BCFR. The ABCFS was also supported by the National Health and Medical Research Council of Australia, the New South Wales Cancer Council, the Victorian Health Promotion Foundation (Australia) and the Victorian Breast Cancer Research Consortium. J.L.H. is a National Health and Medical Research Council (NHMRC) Senior Principal Research Fellow. M.C.S. is a NHMRC Senior Research Fellow. The ABCS study was supported by the Dutch Cancer Society [grants NKI 2007-3839; 2009 4363]; BBMRI-NL, which is a Research
by the Rudolf Bartling Foundation. Financial support for KARBAC was provided through the regional agreement on medical training and clinical research (ALF) between Stockholm County Council and Karolinska Institutet, the Swedish Cancer Society, The Gustav V Jubilee foundation and and Bert von Kantzows foundation. The KBCP was financially supported by the special Government Funding (EVO) of Kuopio University Hospital grants, Cancer Fund of North Savo, the Finnish Cancer Organizations, and by the strategic funding of the University of Eastern Finland. kConFab is supported by a grant from the National Breast Cancer Foundation, and previously by the National Health and Medical Research Council (NHMRC), the Queensland Cancer Fund, the Cancer Councils of New South Wales, Victoria, Tasmania and South Australia, and the Cancer Foundation of Western Australia. Financial support for the AOCS was provided by the United States Army Medical Research and Materiel Command [DAMD17-01-1-0729], Cancer Council Victoria, Queensland Cancer Fund, Cancer Council New South Wales, Cancer Council South Australia, The Cancer Foundation of Western Australia, Cancer Council Tasmania and the National Health and Medical Research Council of Australia (NHMRC; 400413, 400281, 199600). G.C.T. and P.W. are supported by the NHMRC. RB was a Cancer Institute NSW Clinical Research Fellow. LMBC is supported by the ‘Stichting tegen Kanker’ (232-2008 and 196-2010). Diether Lambrechts is supported by the FWO and the KULPFV/10/016-SymBioSysII. The MARIE study was supported by the Deutsche Krebshilfe e.V. [70-2892-BR I, 106332, 108253, 108419], the Hamburg Cancer Society, the German Cancer Research Center (DKFZ) and the Federal Ministry of Education and Research (BMBF) Germany [01KH0402]. MBCSG (Milan Breast Cancer Study Group) is supported by grants from the Italian Association for Cancer Research (AIRC) and by funds from the Italian citizens who allocated the 5/1000 share of their tax payment in support of the Fondazione IRCCS Istituto Nazionale Tumori, according to Italian laws (INT-Institutional strategic projects “5x1000”). The MCBCS was supported by the NIH grants CA192393, CA116167, CA176785 an NIH Specialized Program of Research Excellence (SPORE) in Breast Cancer [CA116201], and the Breast Cancer Research Foundation and a generous gift from the David F. and Margaret T. Grohne Family Foundation. MCCS cohort recruitment was funded by VicHealth and Cancer Council Victoria. The MCCS was further supported by Australian NHMRC grants 209057, 251553 and 504711 and by infrastructure provided by Cancer Council Victoria. Cases and their vital status were ascertained through the Victorian Cancer Registry (VCR) and the Australian Institute of Health and Welfare (AIHW), including the National Death Index and the Australian Cancer Database. The MEC was support by NIH grants CA63464, CA54281, CA098758 and CA132839. The work of MTLGEBCS was supported by